

Two enterprise tech giants—Oracle and Adobe—both reported strong quarterly results this past week. Each beat Wall Street expectations and highlighted their advancements in artificial intelligence. But the stock market reaction couldn’t have been more different:
- Oracle stock surged +13%
- Adobe stock declined –7%
At SWOTstock, we examined the earnings reports, management commentary, and investor sentiment. What we found illustrates a growing gap in how the market values AI strategy: it’s not about who talks the loudest—it’s about who delivers results.

Oracle: AI Execution Drives Confidence and Capital
Oracle’s Q4 FY2025 earnings confirmed the company’s transformation from legacy enterprise vendor to cloud-first AI infrastructure provider. Revenue climbed 11% YoY, while Oracle Cloud Infrastructure (OCI) accelerated an impressive 52%.
What truly stood out was Oracle’s $138 billion in remaining performance obligations (RPO), offering investors forward-looking visibility. With high-profile partnerships (NVIDIA, Cohere) and GenAI workloads already in production, Oracle isn’t pitching an AI future—it’s reporting on AI present.
SWOTstock Takeaway
Oracle’s strength lies in its ability to turn AI demand into revenue now—not years from now.
Key Strengths:
- Cloud Infrastructure (OCI) grew +52% YoY
- AI partnerships with NVIDIA and Cohere are already monetizing
- $138B RPO provides long-term visibility and stability
Risks to Watch:
- Continued competition from AWS, Microsoft, and Google
- Legacy on-premise business still weighs on blended growth

Adobe: Solid Results, But Investors Want AI ROI
Adobe’s Q2 FY2025 results were strong on the surface: 11% revenue growth, earnings beat, and raised guidance. Yet investors responded with skepticism, sending the stock down 7%.
The issue? Despite promoting new AI tools like Firefly, GenStudio, and Acrobat AI, Adobe has yet to show how these innovations will contribute meaningful revenue in the short term. Investor patience is wearing thin.
Meanwhile, competition is heating up. Canva is gaining ground in design, while OpenAI and Google are introducing productivity tools that threaten Adobe’s document business. In this environment, a premium pricing model without clear AI-driven ARR growth becomes difficult to defend.
SWOTstock Takeaway
Adobe’s innovation story is still credible, but without visible monetization, the stock is vulnerable.
Key Strengths:
- Industry-leading suite across Creative, Document, and Experience Cloud
- Rapid rollout of AI-powered features
Risks to Watch:
- No clear monetization path from AI features
- Growing threats from Canva, OpenAI, and Google
- Pressure on margins and customer retention

Why the Divergence?
Despite similar top-line growth, the market saw Oracle and Adobe very differently:
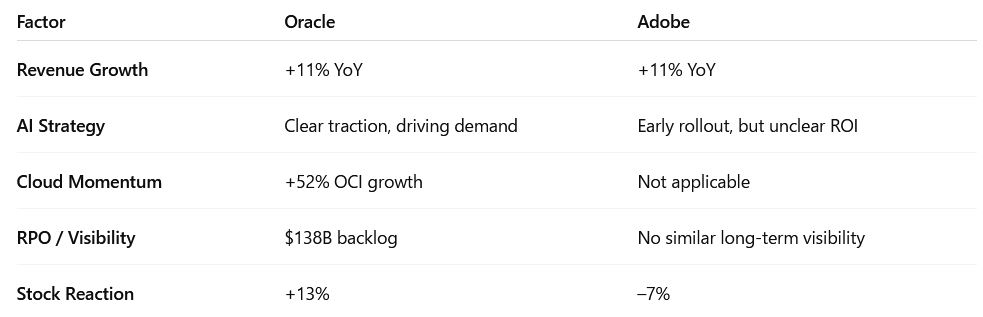
Oracle showed the market what execution looks like. Adobe reminded investors that potential alone is no longer enough.
What to Watch in the Next 6–12 Months
🔮 Oracle Outlook:
Expect continued strength if cloud growth persists and GenAI partnerships scale. RPO offers downside protection in case of macro softness.
⚠️ Adobe Outlook:
Needs to prove that AI tools are driving ARR and enterprise wins. Without that, competitive pressures may accelerate valuation compression.
Final Thoughts: AI Is Entering the Show-Me Phase
This earnings season proves that we’re past the AI hype cycle. The market is now demanding proof—measurable, monetizable traction.
At SWOTstock, we’ll keep tracking this shift as it plays out in earnings calls, product roadmaps, and valuation resets.
👉 Follow us for AI-enhanced stock insights built for growth-minded and DIY value investors.
⚠️ Disclaimer
This analysis is based on publicly available company financials, earnings call commentary, and official press releases as of June 2025. It is intended for informational purposes only and does not constitute investment advice. Always perform your own due diligence.


Leave a comment