TL;DR Summary
NVIDIA (NVDA:NASDAQ) delivered another extraordinary quarter, reporting Q1 FY2027 revenue of $81.6 billion, up 85% year over year, with Data Center revenue surging 92% to $75.2 billion. Blackwell deployment appears successful, enterprise AI adoption is broadening, and management continues positioning NVIDIA not merely as a chipmaker, but as the foundational infrastructure layer for the AI economy.
Yet despite the massive earnings beat, the stock declined after earnings. That reaction suggests the market is beginning to shift its focus from short-term growth toward a more difficult question: how sustainable is the current AI infrastructure spending cycle?
Our probability-weighted fair value estimate stands at approximately $266/share, with the market increasingly pricing NVIDIA as a long-duration AI platform rather than a traditional semiconductor company.
Quarter Recap
NVIDIA’s Q1 FY2027 results reinforced why the company remains the central player in the global AI boom.
Revenue reached $81.6 billion, growing 85% year over year and 20% sequentially. The Data Center segment once again dominated results, generating $75.2 billion in revenue, up 92% year over year. Gross margins remained extraordinarily strong at roughly 75%, while management also announced an additional $80 billion share repurchase authorization and raised the quarterly dividend.
Perhaps most importantly, management commentary strongly suggested that the transition from Hopper to Blackwell is progressing successfully. Earlier investor concerns about deployment bottlenecks, power constraints, and customer transition risks did not materialize in the quarter.
CEO Jensen Huang framed the AI buildout as “the largest infrastructure expansion in human history,” emphasizing NVIDIA’s long-term positioning across AI factories, networking, enterprise AI, robotics, and edge computing.
The company also revealed an important strategic shift: hyperscalers now represent roughly half of Data Center revenue, with the remaining demand increasingly coming from enterprise AI, sovereign AI projects, and AI-native cloud providers. That diversification helps reduce one of the major bear concerns surrounding customer concentration.
However, China export restrictions remain a meaningful headwind. NVIDIA disclosed that it had no Hopper shipments into China during the quarter, compared to billions of dollars of China-related revenue a year earlier.
Key Highlights
- Revenue grew 85% year over year to $81.6 billion
- Data Center revenue surged 92% to $75.2 billion
- Blackwell deployment appears to be ramping successfully
- Gross margins remained near 75%
- NVIDIA authorized an additional $80 billion buyback
- Dividend increased substantially
- Enterprise and sovereign AI demand broadened beyond hyperscalers
- China export restrictions remain a material geopolitical risk
- Market reaction after earnings was negative despite strong operational performance
SWOT Analysis
NVIDIA’s latest quarter continues to demonstrate extraordinary operational strength. However, investors are increasingly debating whether the current valuation already assumes years of uninterrupted AI infrastructure expansion.
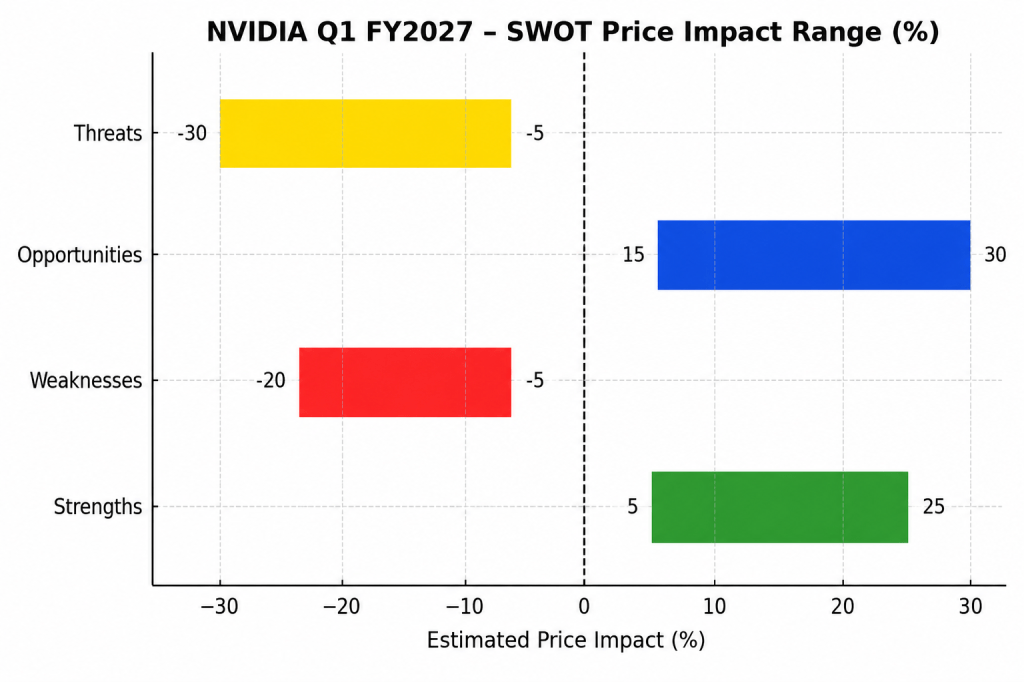
Strengths
- NVIDIA remains the dominant AI infrastructure platform globally, supported by CUDA, NVLink, networking, and a deeply integrated ecosystem.
- Estimated price impact: +15% to +25%
- Data Center growth remains exceptional, with revenue up 92% year over year despite ongoing China restrictions.
- Estimated price impact: +10% to +18%
- Blackwell deployment appears successful, easing prior investor concerns around product transition risks.
- Estimated price impact: +8% to +15%
- Gross margins near 75% and enormous cash generation continue to separate NVIDIA from most semiconductor peers.
- Estimated price impact: +5% to +12%
- Demand is increasingly diversifying beyond hyperscalers into enterprise AI, sovereign AI, and industrial AI deployments.
- Estimated price impact: +5% to +10%
Weaknesses
- NVIDIA’s valuation already reflects extremely high expectations for long-term AI dominance.
- Estimated price impact: -10% to -20%
- Current growth remains heavily dependent on sustained AI infrastructure spending globally.
- Estimated price impact: -8% to -18%
- Hyperscaler concentration risk, while improving, remains meaningful.
- Estimated price impact: -5% to -12%
- The company faces constant pressure to flawlessly execute across Blackwell, Rubin, networking, and software ecosystems.
- Estimated price impact: -5% to -10%
Opportunities
- AI inference demand could eventually surpass training demand as enterprise AI agents become mainstream.
- Estimated price impact: +15% to +30%
- Robotics, autonomous systems, and physical AI represent potentially massive adjacent growth markets.
- Estimated price impact: +10% to +25%
- Enterprise AI adoption still appears to be in the early innings globally.
- Estimated price impact: +10% to +20%
- NVIDIA’s evolution into a full-stack AI infrastructure provider could strengthen its competitive moat further.
- Estimated price impact: +8% to +18%
Threats
- China export restrictions remain a significant geopolitical and revenue risk.
- Estimated price impact: -10% to -20%
- Hyperscalers continue developing custom AI chips that may reduce dependency on NVIDIA over time.
- Estimated price impact: -8% to -18%
- AI infrastructure spending could eventually enter a digestion phase after the current deployment boom.
- Estimated price impact: -15% to -30%
- Competition and eventual margin normalization may pressure valuation multiples in the future.
- Estimated price impact: -5% to -15%
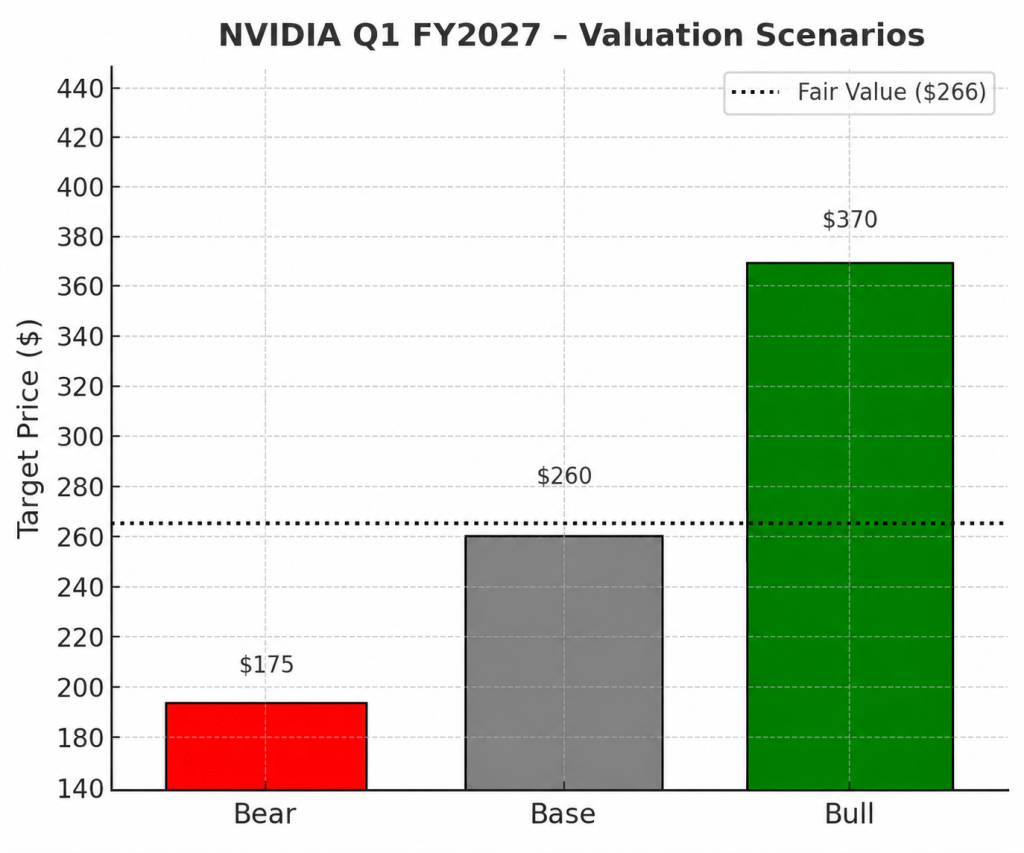
Valuation Scenarios
NVIDIA’s valuation increasingly depends on how long the AI infrastructure cycle continues and whether AI ultimately becomes a foundational layer of the global economy.
Bear Scenario
In the bear case, hyperscaler AI spending slows materially over the next several years as customers optimize deployed infrastructure and enterprise ROI proves slower than expected. Growth decelerates sharply, margins normalize lower, and valuation multiples compress.
- Estimated fair value: $160–$190
- Probability: 25%
Base Scenario
In the base case, AI infrastructure demand remains structurally strong but gradually moderates into a sustainable multi-year growth cycle. NVIDIA maintains leadership across AI compute, networking, and software ecosystems while enterprise AI adoption continues expanding globally.
- Estimated fair value: $240–$280
- Probability: 50%
Bull Scenario
In the bull case, AI evolves into a foundational global infrastructure layer comparable to cloud computing or the internet itself. Inference demand explodes, robotics and physical AI scale rapidly, and NVIDIA successfully becomes the operating platform for global AI infrastructure.
- Estimated fair value: $320–$420
- Probability: 25%
Based on these scenarios, our estimated probability-weighted fair value is approximately:
→ $266/share
Verdict
Operationally, NVIDIA still looks extraordinarily strong. The company continues to dominate the global AI infrastructure market, margins remain exceptional, and Blackwell deployment appears successful.
The market’s muted post-earnings reaction likely reflects a shift in investor psychology rather than disappointment in the quarter itself. Investors are beginning to ask whether the current pace of AI infrastructure spending can continue for many years and whether NVIDIA’s valuation already prices in near-perfect execution.
For long-term growth investors, NVIDIA still represents one of the highest-quality AI infrastructure companies globally. However, future returns may increasingly depend not only on continued strong growth, but on NVIDIA’s ability to justify its role as a long-duration AI platform rather than merely a cyclical semiconductor leader.
Call to Action
Do you think NVIDIA’s current valuation still underestimates the long-term AI opportunity, or is the market finally becoming more cautious about AI infrastructure sustainability?
Visit SWOTstock for more earnings breakdowns, SWOT analysis, and valuation scenarios focused on helping retail investors better understand the companies shaping the AI economy.
Disclaimer
This article is for informational and educational purposes only and does not constitute investment advice. Investors should conduct their own research and consider their financial situation and risk tolerance before making investment decisions.