Berkshire Hathaway Q1 2026 Earnings: Strong Results, But Market Signals “No Catalyst”

Berkshire Hathaway reported strong Q1 2026 results with operating earnings up 17% year-over-year. However, a modest market decline indicated investor concern over capital deployment, not fundamentals. The company’s capital allocation remains key, with future upside dependent on decisive actions rather than incremental earnings growth. The stock appears fairly valued at ~$470.

TL;DR Summary

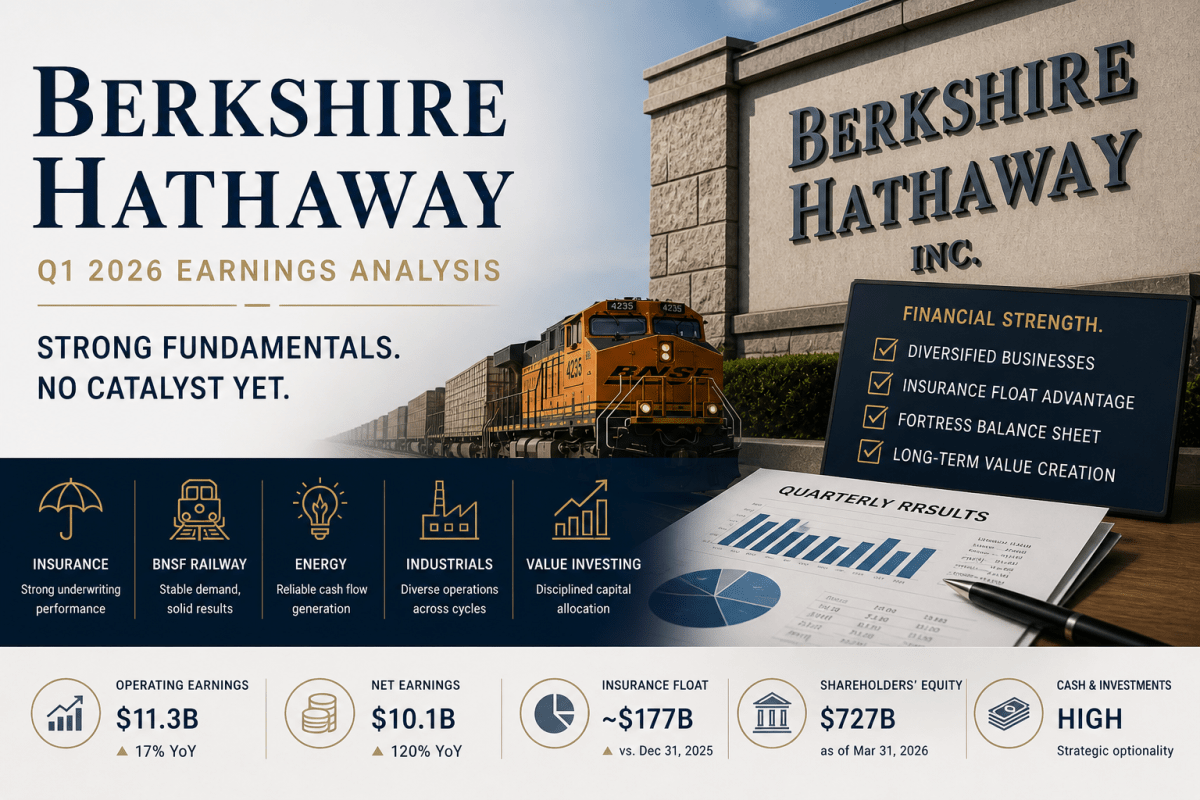
Berkshire Hathaway (BRK.A, BRK.B:NYSE) delivered solid Q1 2026 results, with operating earnings up ~17% year-over-year and continued strength in insurance underwriting. However, because earnings were released on a Saturday, the market reaction came on Monday—where BRK-B closed at $468.52, down 0.95%.

The muted decline suggests not a concern about fundamentals, but a lack of new catalysts—particularly around capital deployment.


Quarter Recap

Berkshire reported Q1 2026 earnings on May 2, 2026.

Key figures from official filings:

  • Operating earnings: ~$11.3B (vs ~$9.6B last year)
  • Net earnings: ~$10.1B (volatile due to investment swings)
  • Revenue: ~$93.7B

The core story remains consistent:
insurance continues to anchor the business, while rail, energy, and industrial operations provide steady, diversified earnings.


Key Highlights

  • Insurance underwriting improved, reinforcing a favorable cycle
  • Float expanded to approximately $177B, strengthening Berkshire’s capital base
  • BNSF delivered higher earnings, reflecting stable demand
  • Investment income declined slightly, showing rate sensitivity
  • Cash remains elevated, with limited visible deployment

Market Reaction — What Actually Happened

Berkshire released earnings on Saturday, when it closed on Monday (May 4, 2026):

  • BRK-B closed at $468.52
  • Down ~0.95%

What this tells us:

  • The market did not react negatively to the earnings quality
  • Instead, it reacted to what was missing

👉 No major acquisition
👉 No aggressive buyback signal
👉 No shift in capital allocation strategy

In other words:

The market is not questioning Berkshire’s business — it is questioning the next move.
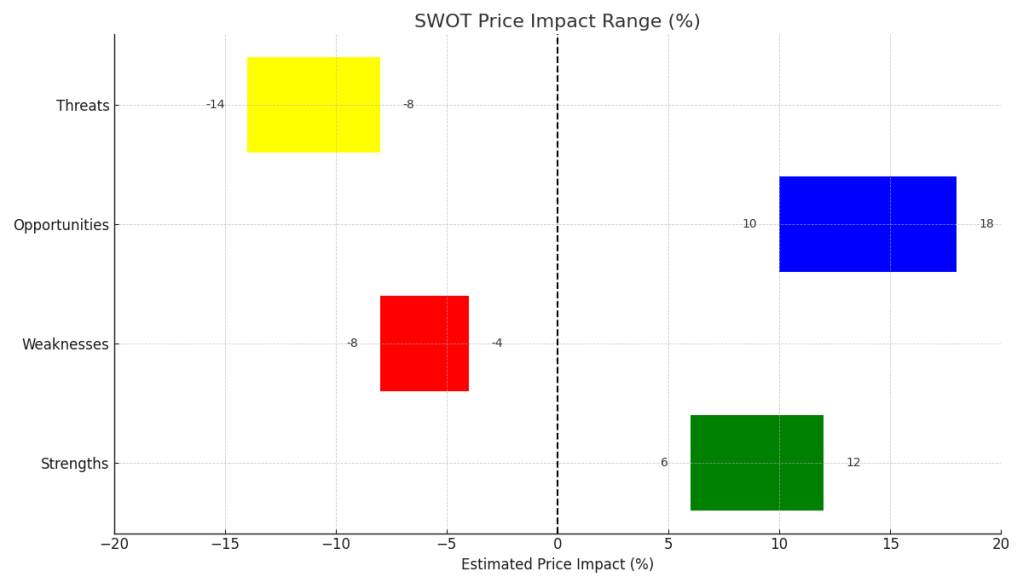

SWOT Analysis

Berkshire is best understood as a capital allocation platform rather than a traditional operating company. Its valuation is driven by how effectively it deploys capital across cycles.
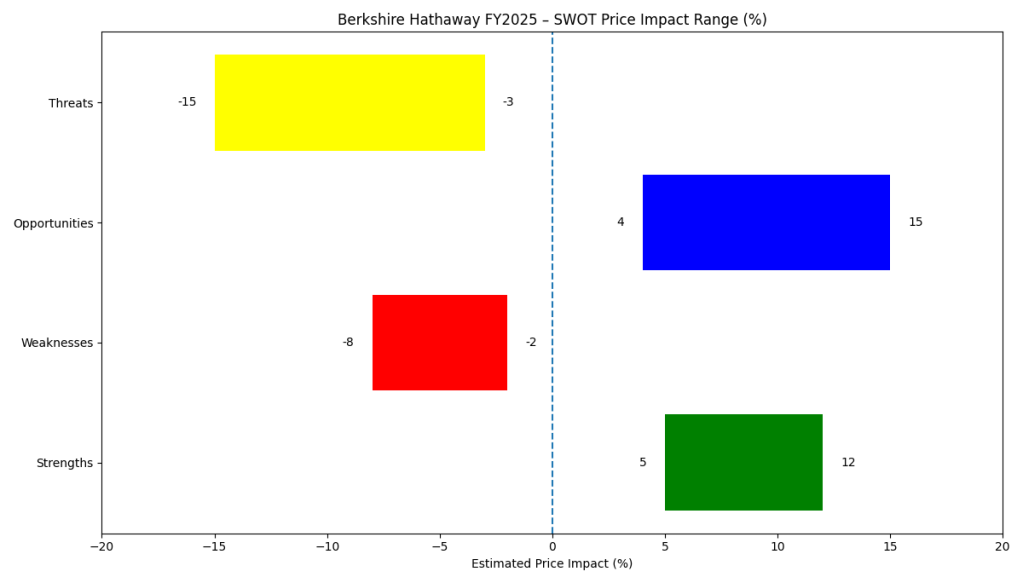
Strengths

  • Insurance float as low-cost leverage (+5% to +10%)
    ~$177B float provides structural funding advantage and enhances long-term returns.
  • Diversified earnings engine (+3% to +6%)
    Insurance, rail, energy, and industrial businesses create resilience across cycles.
  • Proven capital allocation track record (+5% to +8%)
    Long-term value creation is driven by disciplined investment decisions.
  • Fortress balance sheet (+2% to +4%)
    High liquidity provides downside protection and strategic flexibility.

Weaknesses

  • Capital deployment drag (-3% to -6%)
    Large cash reserves dilute returns when not actively deployed.
  • Succession uncertainty (-2% to -5%)
    Future capital allocation quality remains a key unknown.
  • Conglomerate discount (-2% to -4%)
    Structural complexity leads to valuation discount versus sum-of-parts.

Opportunities

  • Large-scale acquisitions in downturns (+5% to +12%)
    Berkshire’s biggest upside comes during market dislocations.
  • Higher interest income on cash (+2% to +4%)
    Elevated rates increase returns on idle capital.
  • Insurance cycle tailwinds (+3% to +6%)
    Strong underwriting conditions can drive outsized profits.

Threats

  • Equity portfolio volatility (-4% to -10%)
    Reported earnings remain sensitive to market movements.
  • Scale limitation (-3% to -7%)
    Berkshire’s size limits high-return opportunities.
  • Catastrophe risk (-3% to -8%)
    Large insurance events can materially impact results.
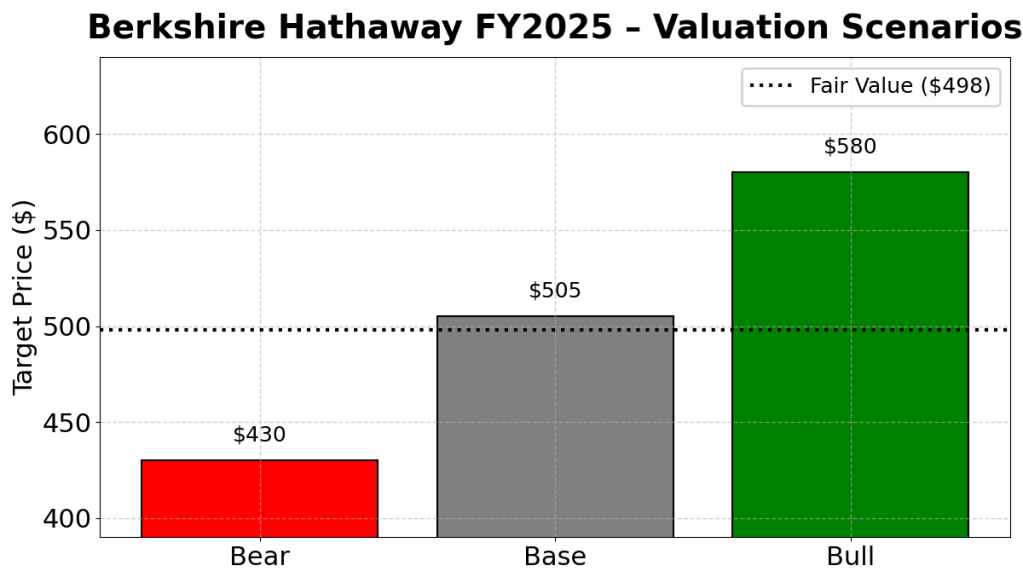
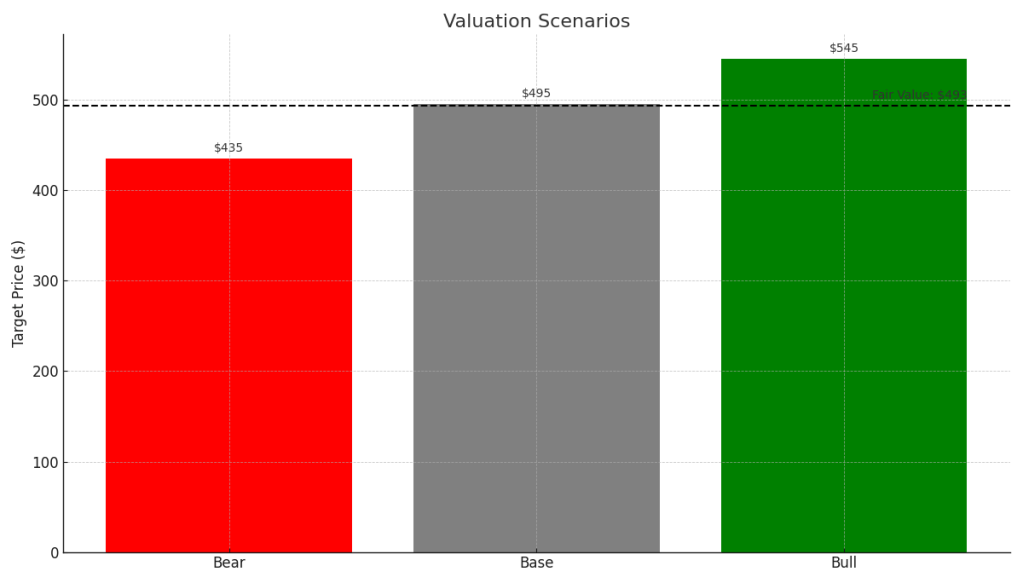
Valuation Scenarios

Berkshire’s valuation depends less on earnings beats and more on capital deployment and earnings durability.

Bear Case (25%)

  • Limited capital deployment
  • Insurance cycle weakens
  • ~1.3x book multiple

👉 Estimated price: $400–420


Base Case (50%)

  • Stable earnings growth
  • Moderate buybacks
  • No major acquisition

👉 Estimated price: $460–480


Bull Case (25%)

  • Major capital deployment at attractive returns
  • Strong insurance cycle persists
  • Multiple expansion to ~1.7x book

👉 Estimated price: $520–550


Probability-Weighted Fair Value

👉 ~$470


Verdict

Berkshire Hathaway continues to execute exactly as expected:
steady earnings, strong underwriting, and unmatched balance sheet strength.

But the market reaction—a modest -0.95% decline on Monday—reveals the real issue:

This is no longer a story about earnings. It’s a story about capital deployment.

At current levels, the stock appears fairly valued.
The upside will not come from incremental earnings—it will come from decisive capital allocation.


Call to Action

If you’re a long-term investor, Berkshire remains a core holding for stability and compounding.

But if you’re looking for upside:

👉 Watch the cash.
👉 Watch the deals.

That’s where the next move will come from.

Follow SWOTstock for more earnings breakdowns grounded in official filings and real investor thinking.


Disclaimer

This article is for informational purposes only and does not constitute financial advice. Always conduct your own research before making investment decisions.


Berkshire Hathaway FY2025: Still a Compounding Machine — But Is There Enough Margin of Safety?

Berkshire Hathaway’s FY2025 results showed a slight decline in operating earnings and increased insurance volatility, yet the company holds a record cash position of over $370B. With disciplined capital allocation under CEO Greg Abel, the stock trades near its intrinsic value at around $500 per share, offering limited margin of safety for value investors.

TL;DR Summary

Berkshire Hathaway’s FY2025 results showed softer operating earnings and insurance volatility, yet the balance sheet has never been stronger. With over $370B in cash and disciplined capital allocation under Greg Abel, the long-term compounding story remains intact. However, at around $500 per BRK.B share, the stock appears close to fair value. For DIY value investors, the key question is no longer quality — it’s margin of safety.


Quarter Recap

Berkshire Hathaway reported FY2025 results in late February 2026. Operating earnings declined modestly year-over-year, reflecting weaker insurance underwriting and investment writedowns. GAAP net income was more volatile due to mark-to-market adjustments in the equity portfolio.

Despite softer earnings, Berkshire ended the year with a record cash position exceeding $370B. Share repurchases remained limited, and the company was a net seller of equities during much of the year.

This was also the first full annual report under CEO Greg Abel, marking a formal transition from the Buffett era while maintaining the same capital allocation philosophy.


Key Highlights

• Operating earnings declined modestly year-over-year

• Insurance underwriting results weakened in Q4

• Cash & equivalents reached record levels (~$370B+)

• No major acquisition deployed despite large liquidity

• Leadership transition to Greg Abel formally underway

• Equity portfolio remains concentrated in high-quality holdings


SWOT Analysis

Berkshire is not an earnings-momentum stock. It is a capital allocator built for long-term compounding. FY2025 did not break the story — but it did test investor patience. For value investors, durability matters more than quarterly growth.


Strengths

• Massive cash position providing downside protection and acquisition optionality

Estimated Price Impact: +5% to +12%

• Diversified operating businesses (insurance, rail, energy, manufacturing)

Estimated Price Impact: +4% to +8%

• Long-standing capital allocation discipline now reinforced under Abel

Estimated Price Impact: +3% to +7%

• High-quality equity portfolio generating dividends and embedded gains

Estimated Price Impact: +4% to +10%


Weaknesses

• Insurance earnings volatility and catastrophe exposure

Estimated Price Impact: -3% to -8%

• Slower organic growth relative to high-growth market leaders

Estimated Price Impact: -2% to -6%

• Leadership transition uncertainty in post-Buffett era

Estimated Price Impact: -3% to -7%


Opportunities

• Large-scale acquisition during market downturn

Estimated Price Impact: +8% to +15%

• Improvement in insurance pricing cycle

Estimated Price Impact: +4% to +9%

• Opportunistic share buybacks below intrinsic value

Estimated Price Impact: +5% to +10%


Threats

• Major insurance catastrophe event

Estimated Price Impact: -6% to -15%

• Significant equity portfolio drawdown

Estimated Price Impact: -5% to -12%

• Prolonged inability to deploy excess cash effectively

Estimated Price Impact: -3% to -8%

Horizontal SWOT price impact bar chart for Berkshire Hathaway FY2025 showing full percentage ranges: Strengths (+5% to +12%), Opportunities (+4% to +15%), Weaknesses (-8% to -2%), and Threats (-15% to -3%), with a vertical dashed zero line.
Berkshire Hathaway FY2025 SWOT price impact ranges highlight asymmetric downside risk from insurance volatility (-15%) versus upside potential from capital deployment and earnings normalization (+15%).

Valuation Scenarios (based on BRK.B)

Berkshire should be valued on normalized operating earnings rather than GAAP net income due to mark-to-market volatility. Using conservative assumptions aligned with Buffett-style valuation discipline:


Bear Case

Flat or declining operating earnings

14× earnings multiple

No major capital deployment

Implied Price Target: $430

Probability: 30%


Base Case

4–6% operating earnings growth

16× earnings multiple

Gradual capital deployment

Implied Price Target: $505

Probability: 50%


Bull Case

8–10% earnings growth

Successful large acquisition

18× earnings multiple

Implied Price Target: $580

Probability: 20%


Probability-Weighted Fair Value:

≈ $498

Vertical valuation scenarios bar chart for Berkshire Hathaway FY2025 showing Bear case at $430 (red), Base case at $505 (gray), and Bull case at $580 (green), with a dotted fair value line at $498.
Berkshire Hathaway FY2025 valuation scenarios range from $430 in a bear case to $580 in a bull case, with a probability-weighted fair value estimate of approximately $498 per share.

Verdict

Berkshire Hathaway remains one of the highest-quality capital allocators in the world. The balance sheet strength is extraordinary, and the business model remains durable.

However, at roughly $500 per BRK.B share, the stock trades close to intrinsic value under conservative assumptions. There is limited margin of safety unless earnings growth accelerates or a large acquisition creates incremental intrinsic value.

For DIY value investors, Berkshire is still a core compounding vehicle — but not a deep bargain today.


Call to Action

If you are building a long-term value portfolio, ask yourself:

Are you buying Berkshire for safety, or for upside?

Follow SWOTstock for structured, investor-focused earnings analysis grounded in intrinsic value logic — not headlines.


Disclaimer

This article is for informational purposes only and does not constitute investment advice. Investors should conduct their own research and consider their financial circumstances before making investment decisions.


Berkshire Hathaway Q3 2025 — Earnings Strength, Record Cash, and a Market That Shrugged

Berkshire Hathaway reported strong Q3 2025 earnings, with $13.5B in operating profits and a record cash reserve of $381B. Despite excellent insurance gains, the stock’s reaction was muted, reflecting cautious investor sentiment and no share buybacks. The outlook remains stable, but without capital deployment, the stock appears fairly valued.

TL;DR Summary

Berkshire delivered one of its strongest operating quarters in years: $13.5B in operating earnings (+34% YoY)$30.8B in net income, and a record $381B cash pile. Insurance posted exceptional underwriting profits and float grew to $176B. Yet the stock barely reacted on Nov 3 — reflecting Buffett’s continued caution, no buybacks, and heavy cash positioning. Berkshire looks fairly valued, with modest upside if capital deployment improves.


Quarter Recap

Berkshire reported Q3 2025 earnings on Saturday, November 1. The results showcased the strength of its core businesses:

  • Operating earnings surged to $13.485B, driven by rebounding insurance profitability.
  • Net income came in at $30.796B, boosted by mark-to-market investment gains.
  • Insurance underwriting delivered $2.369B in profit — nearly triple YoY.
  • Berkshire Hathaway Energy earned $1.489B; BNSF generated $1.449B.
  • The company ended the quarter with $305B in U.S. Treasury bills and $381.7B in total cash and equivalents — a historic record.

Despite these results, Berkshire again did not repurchase shares and was a net seller of equities during the quarter — a message that did not go unnoticed by the market.


Key Highlights

1. A Massive Cash Wall
Berkshire now holds one of the largest cash positions in its history — a sign of both discipline and a lack of compelling opportunities.

2. Insurance Delivered Its Best Quarter in Years
Underwriting profit and investment income both rose sharply, supported by higher rates and disciplined pricing.

3. Apple Exposure Remains High
Apple continues to dominate the equity portfolio, though Berkshire reduced its position earlier in the year.

4. No Buybacks in 2025
Management chose not to repurchase shares for the first nine months — a strong signal that Buffett does not view Berkshire as undervalued at current levels.

5. Market Reaction Was Muted
On Nov 3 (first trading day after earnings), BRK.B closed near $476, showing almost no reaction to the strong quarter — reflecting cautious investor sentiment and the sense that Berkshire is in a holding pattern.


SWOT Analysis

Strengths (+6% to +12%)

  • Record cash levels
  • Strong underwriting performance
  • Diversified, resilient businesses
  • Significant float growth

Weaknesses (–4% to –8%)

  • Sluggish revenue growth
  • No buybacks YTD
  • Heavy reliance on Apple

Opportunities (+8% to +15%)

  • Capital deployment potential
  • Treasury valuation upside
  • Insurance pricing cycle

Threats (–10% to –18%)

  • Succession transition
  • Market downturn exposure
  • Catastrophe risk
Berkshire Q3 2025 earnings SWOT analysis horizontal bar chart showing Strengths (+6 to +12%), Weaknesses (–8 to –4%), Opportunities (+10 to +18%), and Threats (–14 to –8%) with all labels outside the bars, a vertical dashed zero line, and x-axis from –20 to +20.

Valuation Scenarios (Bull / Base / Bear)

Bear Case — $435 (25%)

  • Uses mid-threat impact
  • No buybacks, leadership uncertainty
  • Market correction risk
    Fair value: $476 × (1 – 9%) ≈ $435

Base Case — $495 (50%)

  • Balanced strengths/weaknesses
  • Stable operating earnings
  • Treasury yield support
    Fair value: $476 × (1 + 4%) ≈ $495

Bull Case — $545 (25%)

  • Strong insurance profitability
  • Opportunistic capital deployment
  • Rate cuts boosting Treasury book
    Fair value: $476 × (1 + 14.5%) ≈ $545

Probability-Weighted Fair Value

= (0.25 × 435) + (0.50 × 495) + (0.25 × 545)
$493

Final Fair Value: $493

≈ 3.6% above current price → Fairly Valued

Valuation scenarios bar chart for Microsoft Q1 FY2026 showing Bear case at $435, Base case at $495, and Bull case at $545, with a dashed Fair Value line at $493 fully visible across the chart.

Verdict

Berkshire remains a fortress — high-quality, resilient, and disciplined. But with such a massive cash position and no buybacks, the market is waiting for a catalyst. Q3 shows strength, but until Berkshire deploys capital or signals undervaluation with buybacks, the stock likely stays range-bound.

For long-term value investors, Berkshire remains a low-risk compounder — but not yet a bargain.


Call to Action

If you found this analysis helpful, follow SWOTstock for more breakdowns of major earnings, fair-value scenarios, and investor-focused research. Share this post with another DIY value investor who follows Berkshire closely.


Disclaimer

This article is for informational and educational purposes only and is not investment advice. All analysis is based solely on Berkshire Hathaway’s official Q3 2025 financial report and management disclosures.