AMD Q1 2026 Earnings: AI Breakout or Fully Priced Momentum?

Advanced Micro Devices (AMD) demonstrated strong Q1 2026 results, with a significant shift towards AI-driven growth, particularly in its data center business. The stock experienced a ~20% pre-market gain, reflecting increased market confidence. However, risks related to expectation management and competition with NVIDIA remain, posing potential challenges to sustained growth.

TL;DR Summary

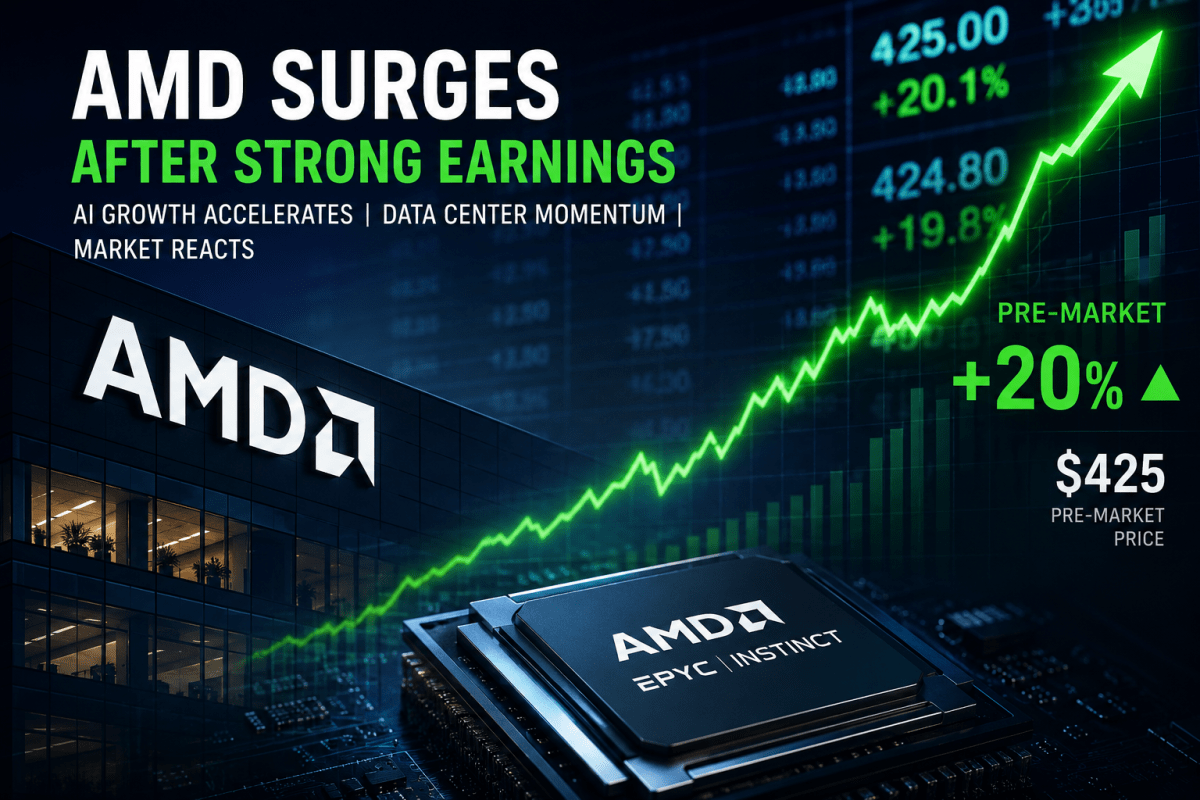
Advanced Micro Devices (AMD:NASDAQ) delivered a clear AI-driven breakout in Q1 2026, triggering a ~20% pre-market gain at one time, re-rating from ~$355 to ~$425. The market is no longer questioning AMD’s role in AI—it is pricing in continued execution. The key question now is not whether AMD can grow, but whether it can outperform already elevated expectations. Upside remains, but risk has shifted toward expectation compression.


Quarter Recap

AMD’s Q1 2026 results confirm a structural shift in the business.

The company is no longer driven by a balanced portfolio across client, gaming, and embedded segments. Instead, growth is now clearly concentrated in Data Center, powered by EPYC CPUs and MI300 AI accelerators.

Client showed early signs of stabilization after a prolonged downturn, while Gaming and Embedded continued to decline due to cyclical normalization and inventory digestion. Profitability improved, supported by a mix shift toward higher-margin AI and data center products.

Management emphasized strong hyperscaler demand and an accelerating AI deployment pipeline, reinforcing that AMD is now positioned as a meaningful participant in AI infrastructure.


Key Highlights

AMD’s earnings were not just “good”—they were better than what the market had already priced in.

The most important takeaway is that AI is no longer a future narrative for AMD. It is now the current growth engine, with real revenue contribution and margin impact.

However, this strength is not evenly distributed. Legacy segments remain weak, and the company is increasingly dependent on continued AI momentum to sustain growth.


SWOT Analysis (with Price Impact)

AMD’s valuation must now be understood in the context of a post-re-rating stock. The ~20% jump pre-market reflects a shift in expectations, not just fundamentals.

Strengths

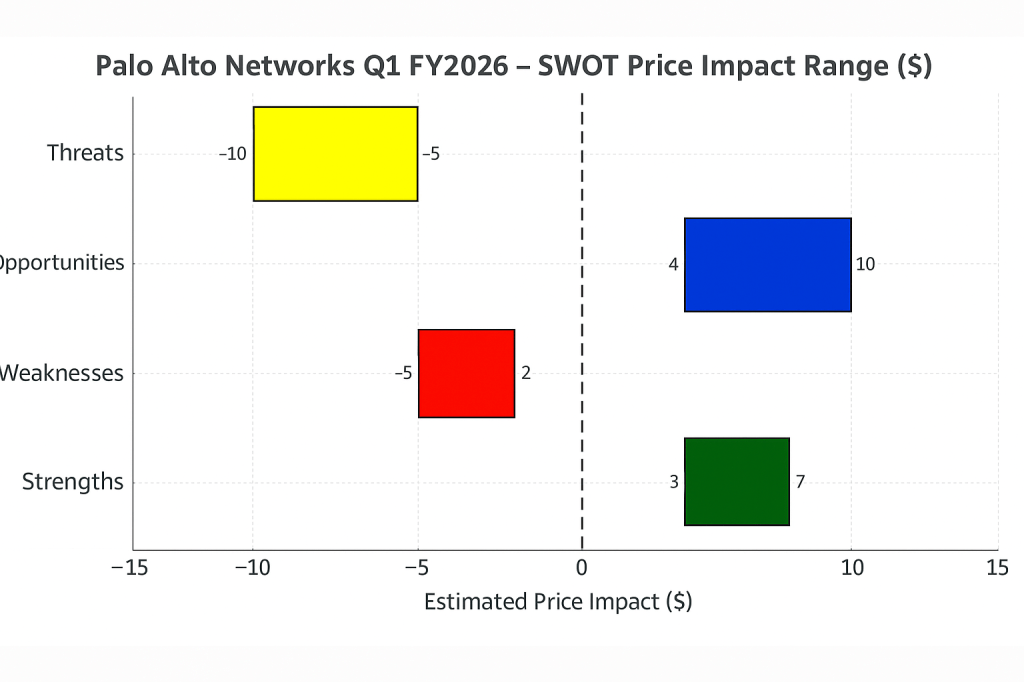
AMD’s AI and data center business has reached an inflection point. The MI300 ramp and EPYC demand validate that AMD is no longer an AI outsider. This directly drove the recent re-rating and remains the core upside driver, contributing an estimated +10% to +20% impact on valuation.

At the same time, the mix shift toward higher-margin AI products is improving profitability, supporting an additional +5% to +10% upside.


Weaknesses

Despite strong hardware progress, AMD still trails NVIDIA in software ecosystem strength. CUDA remains a significant moat, limiting AMD’s ability to fully capture AI demand. This gap represents a -10% to -20% valuation drag.

Additionally, AMD’s reliance on AI is increasing as other segments underperform. Gaming and Embedded remain weak, creating concentration risk, with a -5% to -10% impact.


Opportunities

The AI market remains the largest opportunity. If AMD continues to gain share in hyperscaler and enterprise deployments, the upside is substantial, contributing +20% to +40% potential.

AMD also benefits from being a credible second supplier in a market dominated by NVIDIA. Hyperscalers are actively seeking alternatives, creating a structural tailwind worth +10% to +20%.


Threats

The biggest risk is no longer execution—it is expectations.

After a ~20% move, the market now requires AMD to consistently exceed forecasts. Any sign of normalization could trigger -20% to -35% downside through multiple compression.

Competition remains intense. NVIDIA continues to innovate aggressively, while companies like Amazon and Microsoftare investing in in-house AI chips. This creates a -10% to -25% risk to long-term positioning.


SWOT Summary Table

CategoryFactorPrice Impact
StrengthAI/Data Center breakout+10% to +20%
StrengthMargin expansion+5% to +10%
WeaknessNVIDIA ecosystem gap-10% to -20%
WeaknessAI concentration risk-5% to -10%
OpportunityAI market share expansion+20% to +40%
OpportunitySecond supplier advantage+10% to +20%
ThreatExpectation compression-20% to -35%
ThreatCompetitive pressure-10% to -25%

Valuation Scenarios

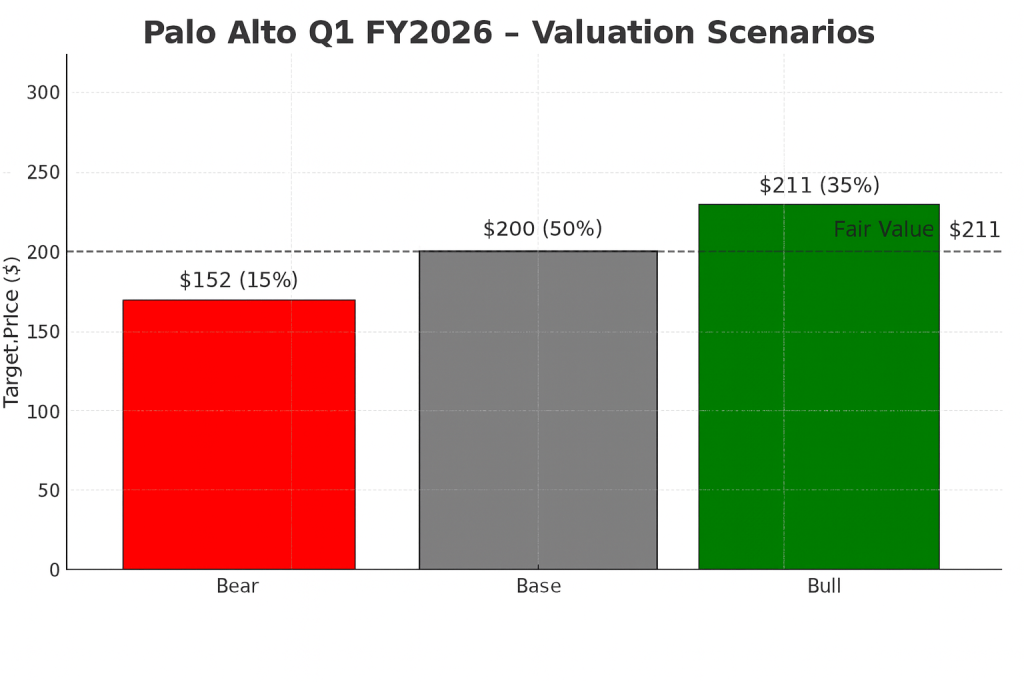
AMD is now trading at approximately $425 post-earnings, following a significant re-rating.

Instead of relying on arbitrary EPS assumptions, we anchor valuation to business outcomes and market positioning.

  • Bear Case ($200–300): AI growth slows or fails to exceed expectations. Multiple compresses as the narrative weakens.
  • Base Case ($300–400): AMD executes well, with steady AI growth and margin improvement.
  • Bull Case ($400–600+): AMD achieves meaningful AI share gains and is re-rated closer to top-tier AI infrastructure players.

Verdict

AMD has successfully crossed the most important threshold—it has proven that it belongs in the AI conversation.

However, the stock is no longer early. At ~$425, the market is already pricing in a significant portion of future success.

This creates a shift in the investment thesis. AMD is no longer a “discovery” story but an execution story, where upside depends on consistently exceeding already high expectations.

For investors, this means the risk-reward profile has become more balanced, with less margin for error.


Call to Action

If you’re following AI infrastructure stocks, AMD is now a critical name to watch—not for its potential, but for its ability to deliver quarter after quarter.

Follow SWOTstock for grounded, investor-focused earnings analysis that separates facts, market reaction, and real valuation thinking.


Disclaimer

This content is for informational purposes only and does not constitute financial advice. Investors should conduct their own research and consider their risk tolerance before making investment decisions.


Berkshire Hathaway Q1 2026 Earnings: Strong Results, But Market Signals “No Catalyst”

Berkshire Hathaway reported strong Q1 2026 results with operating earnings up 17% year-over-year. However, a modest market decline indicated investor concern over capital deployment, not fundamentals. The company’s capital allocation remains key, with future upside dependent on decisive actions rather than incremental earnings growth. The stock appears fairly valued at ~$470.

TL;DR Summary

Berkshire Hathaway (BRK.A, BRK.B:NYSE) delivered solid Q1 2026 results, with operating earnings up ~17% year-over-year and continued strength in insurance underwriting. However, because earnings were released on a Saturday, the market reaction came on Monday—where BRK-B closed at $468.52, down 0.95%.

The muted decline suggests not a concern about fundamentals, but a lack of new catalysts—particularly around capital deployment.


Quarter Recap

Berkshire reported Q1 2026 earnings on May 2, 2026.

Key figures from official filings:

  • Operating earnings: ~$11.3B (vs ~$9.6B last year)
  • Net earnings: ~$10.1B (volatile due to investment swings)
  • Revenue: ~$93.7B

The core story remains consistent:
insurance continues to anchor the business, while rail, energy, and industrial operations provide steady, diversified earnings.


Key Highlights

  • Insurance underwriting improved, reinforcing a favorable cycle
  • Float expanded to approximately $177B, strengthening Berkshire’s capital base
  • BNSF delivered higher earnings, reflecting stable demand
  • Investment income declined slightly, showing rate sensitivity
  • Cash remains elevated, with limited visible deployment

Market Reaction — What Actually Happened

Berkshire released earnings on Saturday, when it closed on Monday (May 4, 2026):

  • BRK-B closed at $468.52
  • Down ~0.95%

What this tells us:

  • The market did not react negatively to the earnings quality
  • Instead, it reacted to what was missing

👉 No major acquisition
👉 No aggressive buyback signal
👉 No shift in capital allocation strategy

In other words:

The market is not questioning Berkshire’s business — it is questioning the next move.


SWOT Analysis

Berkshire is best understood as a capital allocation platform rather than a traditional operating company. Its valuation is driven by how effectively it deploys capital across cycles.

Strengths

  • Insurance float as low-cost leverage (+5% to +10%)
    ~$177B float provides structural funding advantage and enhances long-term returns.
  • Diversified earnings engine (+3% to +6%)
    Insurance, rail, energy, and industrial businesses create resilience across cycles.
  • Proven capital allocation track record (+5% to +8%)
    Long-term value creation is driven by disciplined investment decisions.
  • Fortress balance sheet (+2% to +4%)
    High liquidity provides downside protection and strategic flexibility.

Weaknesses

  • Capital deployment drag (-3% to -6%)
    Large cash reserves dilute returns when not actively deployed.
  • Succession uncertainty (-2% to -5%)
    Future capital allocation quality remains a key unknown.
  • Conglomerate discount (-2% to -4%)
    Structural complexity leads to valuation discount versus sum-of-parts.

Opportunities

  • Large-scale acquisitions in downturns (+5% to +12%)
    Berkshire’s biggest upside comes during market dislocations.
  • Higher interest income on cash (+2% to +4%)
    Elevated rates increase returns on idle capital.
  • Insurance cycle tailwinds (+3% to +6%)
    Strong underwriting conditions can drive outsized profits.

Threats

  • Equity portfolio volatility (-4% to -10%)
    Reported earnings remain sensitive to market movements.
  • Scale limitation (-3% to -7%)
    Berkshire’s size limits high-return opportunities.
  • Catastrophe risk (-3% to -8%)
    Large insurance events can materially impact results.

Valuation Scenarios

Berkshire’s valuation depends less on earnings beats and more on capital deployment and earnings durability.

Bear Case (25%)

  • Limited capital deployment
  • Insurance cycle weakens
  • ~1.3x book multiple

👉 Estimated price: $400–420


Base Case (50%)

  • Stable earnings growth
  • Moderate buybacks
  • No major acquisition

👉 Estimated price: $460–480


Bull Case (25%)

  • Major capital deployment at attractive returns
  • Strong insurance cycle persists
  • Multiple expansion to ~1.7x book

👉 Estimated price: $520–550


Probability-Weighted Fair Value

👉 ~$470


Verdict

Berkshire Hathaway continues to execute exactly as expected:
steady earnings, strong underwriting, and unmatched balance sheet strength.

But the market reaction—a modest -0.95% decline on Monday—reveals the real issue:

This is no longer a story about earnings. It’s a story about capital deployment.

At current levels, the stock appears fairly valued.
The upside will not come from incremental earnings—it will come from decisive capital allocation.


Call to Action

If you’re a long-term investor, Berkshire remains a core holding for stability and compounding.

But if you’re looking for upside:

👉 Watch the cash.
👉 Watch the deals.

That’s where the next move will come from.

Follow SWOTstock for more earnings breakdowns grounded in official filings and real investor thinking.


Disclaimer

This article is for informational purposes only and does not constitute financial advice. Always conduct your own research before making investment decisions.


Palo Alto Networks Q1 FY2026 — “Steady Growth, Strong ARR, and a Market That Wanted More”

Palo Alto Networks reported strong FY2026 Q1 results, with a 16% revenue increase to $2.50 billion and a 29% rise in NGS ARR to $5.9

TL;DR Summary

Palo Alto Networks delivered a solid first quarter for FY2026: revenue climbed 16% to $2.50 billion, NGS ARR rose 29% to $5.9 billion, and RPO expanded 24% to $15.5 billion. Non-GAAP EPS of $0.93 beat expectations, reaffirming the company’s execution as customers expand platform adoption across Strata, Prisma, and Cortex. Yet shares traded lower after earnings as full-year guidance held steady, signaling a “good but not great” quarter for a stock priced for upside surprises. Our probability-weighted fair value comes in at $211, modestly above today’s ~$200 level.


Quarter Recap

Palo Alto Networks opened fiscal 2026 with steady momentum across its recurring revenue engines. Revenue grew 16% year-on-year to $2.50 billion, reflecting consistent demand for platformized security solutions. Next-Generation Security ARR expanded 29% to $5.9 billion, and the company’s Remaining Performance Obligation reached $15.5 billion, illustrating multi-year visibility as customers commit to broader and longer-term contracts. Non-GAAP EPS of $0.93 came in ahead of expectations, supported by robust software mix and continued traction in large deals. GAAP net income softened to $334 million due to higher operating investments and recent acquisition activity. Full-year guidance was reaffirmed at 14% revenue growth and 38–39% free cash flow margin, indicating stable execution without major revisions.


Key Highlights

  • Revenue grew 16% YoY to $2.50B
  • NGS ARR increased 29% YoY to $5.9B
  • RPO reached $15.5B, up 24% YoY
  • GAAP net income: $334M
  • Non-GAAP EPS: $0.93
  • FY2026 revenue guide: $10.50B–$10.54B (~14% YoY)
  • FY2026 non-GAAP EPS guide: $3.80–$3.90
  • FY2026 FCF margin: 38–39%
  • Strong platform adoption across Strata, Prisma, Cortex
  • Deal cycles remain healthy with large multi-module wins

SWOT Analysis

Strengths (+6% to +12%)

Palo Alto’s platform strategy continues to resonate, with customers consolidating disparate tools into unified architectures across network, cloud, and SOC operations. Robust ARR and RPO growth demonstrate durable demand and expanding wallet share. Execution remains consistent, with non-GAAP EPS beating expectations and free cash flow margins reaffirmed at attractive levels.

Weaknesses (–5% to –10%)

GAAP profitability remains pressured as the company absorbs integration costs and continues its investment cycle. The flat full-year revenue outlook reflects strong but not accelerating momentum, which limits near-term operating leverage. Competition and elevated valuation require continuous outperformance to sustain premium multiples.

Opportunities (+8% to +15%)

AI-aligned security represents a significant long-term catalyst. Enterprises are rearchitecting systems to protect AI workloads, model governance, and data pipelines — opening the door for larger platform deals. If AI-driven security cycles broaden or ARR momentum accelerates, Palo Alto could benefit from expanding deal sizes and higher-margin software adoption.

Threats (–8% to –15%)

The competitive landscape remains intense, with CrowdStrike, Zscaler, Fortinet, and hyperscalers rolling out AI-native security features. Deal timing remains sensitive to macro conditions, and any slowdown in billings or ARR conversion could weigh on sentiment. With valuation elevated, even modest disappointments can trigger multiple compression.


SWOT Table

Strengths
+6% to +12%
Execution strength, ARR growth, platform adoption

Weaknesses
–5% to –10%
GAAP margin pressure, flat guide, integration costs

Opportunities
+8% to +15%
AI-security demand, larger platform deals, multi-year contracts

Threats
–8% to –15%
Intense competition, valuation risk, deal-cycle volatility

SWOT price impact chart for Palo Alto Networks Q1 FY2026 showing strengths, weaknesses, opportunities, and threats with corresponding dollar impact ranges on a horizontal bar graph.

Valuation Scenarios & Fair Value

Bull Case — $253 (35% probability)

Assumes stronger ARR expansion, AI-security deal momentum, and upside to FY26 revenue.
EPS: $3.95
Multiple: 64×
Target: $253

Base Case — $200 (50% probability)

Represents steady execution consistent with FY26 guidance.
EPS: $3.85
Multiple: 52×
Target: $200

Bear Case — $152 (15% probability)

Reflects slower deal cycles or competitive pressure leading to multiple compression.
EPS: $3.80
Multiple: 40×
Target: $152

Probability-Weighted Fair Value

0.35(253)+0.50(200)+0.15(152)=2110.35(253)+0.50(200)+0.15(152)=211

➡️ Fair Value Estimate: $211 per share

Today’s price near ~$200 suggests modest upside.

Valuation scenarios chart for Palo Alto Networks Q1 FY2026 showing bear case target of $152, base case target of $200, and bull case target of $253, with a dashed line indicating fair value at $211.”

Verdict

Palo Alto delivered a confident and well-executed quarter with strong ARR performance and healthy deal momentum. The reaffirmed full-year outlook signals stability, but the market was looking for acceleration, especially given the AI-security narrative. For long-term growth investors, the fundamentals remain compelling: resilient demand, high software mix, and strong free cash flow. With shares trading slightly below our $211 fair-value estimate, Palo Alto represents a reasonable entry point for exposure to platformized, AI-aligned cybersecurity — though upside may rely on renewed momentum in billings or a more aggressive guidance raise later in FY2026.


Call to Action

If you found this breakdown helpful, follow SWOTstock for more AI-driven fundamental analysis on today’s most important tech and cybersecurity companies. Each report is built from official filings, earnings transcripts, and a structured methodology designed for disciplined investors.


Disclaimer

This article is for informational purposes only and is not investment advice. All analysis is based exclusively on Palo Alto Networks’ official earnings report, financial disclosures, and management commentary from the latest quarter. Investors should perform their own research or consult a financial professional before making investment decisions.