TSMC Q2 2026 Earnings: AI Demand Accelerates, but Is the Stock Still Attractive at $410?

TSMC reported strong Q2 results with revenues of $40.20 billion, driven by high demand for AI and advanced chips. Despite exceeding forecasts, shares fell 2.3% due to high capital spending and margin pressures. The company raised its 2026 revenue growth outlook, but geopolitical risks remain a concern for investors.

TL;DR Summary

TSMC delivered another exceptional quarter, driven by leading-edge chips and rapidly expanding AI demand. Revenue reached the top of management’s guidance, margins exceeded expectations, and the company raised its full-year growth outlook. Yet the ADR fell 2.3% after the report.

The problem was not weak execution. It was the combination of a demanding valuation, a much larger capital program, and visible margin pressure from the 2nm ramp and overseas fabs.

  • Q2 revenue increased 33.7% year over year in US dollars to $40.20 billion.
  • Gross margin reached 67.7%, while operating margin reached 60.3%.
  • High-performance computing grew 20% sequentially and represented 66% of revenue.
  • Management now expects 2026 revenue growth to be slightly above 40% in US-dollar terms.
  • The 2026 capital budget was raised to $60–64 billion, increasing both TSMC’s growth capacity and its execution risk.
  • Our estimated fair value is $440 per ADR, compared with the July 16 closing price of $409.74.
  • The shares appear slightly undervalued, but the margin of safety remains limited.

Quarter Recap

TSMC reported Q2 2026 revenue of NT$1.270 trillion, equivalent to $40.20 billion. Revenue increased 36.0% year over year in New Taiwan dollars and 33.7% in US dollars. Sequential growth was 12.0%.

Profitability was even stronger. Gross profit increased 57.2% year over year, operating income increased 65.4%, and net income attributable to shareholders increased 77.4%. Gross margin reached 67.7%, operating margin reached 60.3%, and annualized return on equity reached 45.9%.

The headline EPS figure requires one adjustment. Reported ADR earnings of $4.31 included approximately $0.35 per ADR from gains related to Vanguard International Semiconductor shares. Excluding that identified contribution, normalized Q2 ADR earnings were approximately $3.96.

The underlying operating result was still exceptional, but the full 77.4% increase in reported EPS was not entirely recurring.

For Q3, management expects revenue of $44.6–45.8 billion. The midpoint represents approximately 12% sequential growth and 37% year-over-year growth. Gross margin is expected to fall to 65–67%, while operating margin is expected to moderate to 56–58%.

The market reacted negatively despite the strong report. TSM closed at $419.48 before the release and $409.74 afterward, a decline of 2.32%. The ADR opened down more than 3% before recovering part of the loss.

This was not a rejection of TSMC’s operating performance. It was a reassessment of what investors must pay—and how much TSMC must spend—to capture the AI opportunity.

Key Highlights

  • AI has become the central growth engine. HPC revenue increased 20% sequentially and represented 66% of total revenue, up from 61% in Q1 and 60% a year earlier.
  • Advanced-node adoption continues to strengthen. Technologies at 7nm and below generated 77% of wafer revenue. The mix included 3% from 2nm, 30% from 3nm, 33% from 5nm, and 11% from 7nm.
  • The 2nm ramp has begun. Its first revenue contribution confirms that the technology is entering commercial production, but management expects the ramp to reduce second-half gross margin by approximately three to four percentage points.
  • Capital expenditure is rising sharply. TSMC raised its 2026 capital budget to $60–64 billion from an original $52–56 billion. Management attributed the increase mainly to stronger customer demand and, secondarily, equipment-price inflation.
  • Free cash flow remains positive but is under pressure. Operating cash flow reached NT$783.36 billion, while capital expenditure reached NT$496.00 billion. Free cash flow was NT$287.36 billion, down sequentially because investment grew faster than operating cash generation.
  • The balance sheet remains formidable. TSMC ended the quarter with NT$3.518 trillion in cash and marketable securities and NT$2.486 trillion in net cash reserves.
  • Demand outside AI is less convincing. Management described consumer and price-sensitive markets as challenged. Mature-node shortages remain concentrated in AI-related power-management chips and sensors rather than the broader market.
  • Advanced packaging remains a bottleneck. Management acknowledged that packaging capacity is still tight enough to restrict customer growth, even as TSMC increases back-end investment.
  • The long-term technology road map remains intact. A14 risk production is scheduled for 2027 and volume production for 2028. Compared with N2, A14 is designed to deliver 10–15% more speed at the same power or 25–30% lower power at the same speed.

SWOT Analysis

TSMC combines one of the strongest competitive positions in global technology with unusually concentrated geopolitical and capital-allocation risks. The estimated price-impact ranges below represent isolated 12-month sensitivities and should not be added together because several factors overlap.

Strengths

  • Leading-edge manufacturing leadership: +8% to +14%. Advanced technologies represented 77% of wafer revenue, while 2nm entered commercial production. This mix supports pricing, customer retention, and long-term returns on capital.
  • Exceptional AI and HPC demand: +10% to +18%. HPC now generates two-thirds of revenue, and management continues to receive strong demand signals from customers and cloud-service providers.
  • Industry-leading profitability: +5% to +9%. A 67.7% gross margin and 60.3% operating margin demonstrate considerable pricing power, utilization, and manufacturing efficiency.
  • Strong balance sheet: +3% to +7%. TSMC’s net-cash position allows it to finance an enormous expansion program without immediately compromising financial stability.
  • Deep customer integration: +4% to +8%. Management estimates that technology selection, qualification, and capacity preparation can take approximately five years. This makes foundry switching slow, costly, and operationally risky for customers.

Weaknesses

  • Rising capital intensity: −6% to −12%. The $60–64 billion capital budget reduces near-term free-cash-flow conversion and raises the financial cost of any future forecasting error.
  • Margin dilution: −5% to −10%. The 2nm ramp will pressure second-half margins, while overseas fabs are expected to reduce gross margin by two to three percentage points initially and three to four points at a later stage.
  • HPC and geographic concentration: −4% to −8%. HPC accounts for 66% of revenue, while North American customers account for 78%. This increases exposure to a concentrated AI investment cycle.
  • Advanced-packaging constraints: −3% to −7%. Packaging shortages currently limit how quickly customers can translate leading-edge wafers into complete AI systems.
  • Nonrecurring support to reported EPS: −1% to −3%. The Vanguard-related gain added NT$2.24 per ordinary share to reported earnings and should not be capitalized as recurring income.

Opportunities

  • The 2nm ramp: +8% to +15%. Initial margin dilution could give way to stronger earnings once utilization, yield, and cost improvements develop.
  • Agentic AI and CPU demand: +6% to +12%. Agentic systems require CPUs alongside accelerators. Major x86, Arm, and RISC-V participants are predominantly TSMC customers, allowing the company to benefit across competing architectures.
  • Advanced-packaging expansion: +5% to +10%. Closing the supply-demand gap in CoWoS and related technologies would allow more existing AI demand to convert into shipments.
  • The A14 technology family: +4% to +8%. A14, A13, and A12 could extend TSMC’s leading-edge advantage through the end of the decade.
  • Global capacity: +3% to +7%. Manufacturing expansion in the US, Japan, and Europe may deepen strategic customer relationships and reduce concerns about geographic supply concentration.

Threats

  • An AI infrastructure slowdown: −15% to −25%. The investment program assumes that customer demand remains strong for several years. A slowdown could expose TSMC to lower utilization just as depreciation rises.
  • Taiwan geopolitical risk: −20% to −35%. This remains the largest low-frequency, high-impact risk to the investment case and warrants a persistent valuation discount.
  • Simultaneous expansion risk: −8% to −15%. TSMC must ramp 2nm, expand packaging, and execute several overseas projects without losing its manufacturing discipline.
  • Weakness outside AI: −5% to −10%. Consumer, price-sensitive, and most commodity mature-node categories are not participating equally in the current expansion.
  • Foundry and packaging competition: −6% to −12%. Rapid displacement is unlikely, but selective customer diversification or competing packaging solutions could reduce TSMC’s share of future value creation.

Valuation Scenarios

Our valuation starts with estimated normalized 2026 ADR earnings of approximately $16.40. This removes the identified Vanguard gain and models the second half from TSMC’s Q3 guidance and full-year growth outlook.

We then estimate 2027 earnings under three operating environments. These are independent scenarios, not analyst-consensus forecasts.

  • Bear case — $327, with a 25% probability. Normalized 2027 ADR earnings rise only 5% to approximately $17.20. Applying a 19× multiple produces $326.80, rounded to $327. This scenario reflects weaker AI spending, lower utilization, and continued overseas-fab dilution. It implies approximately 20% downside from $409.74.
  • Base case — $445, with a 50% probability. Normalized 2027 ADR earnings increase 18% to approximately $19.35. A 23× multiple produces $445.05, rounded to $445. This assumes that 2nm and packaging capacity expand successfully while overseas costs prevent meaningful margin expansion. It implies approximately 9% upside.
  • Bull case — $546, with a 25% probability. Normalized 2027 ADR earnings increase 28% to approximately $20.99. A 26× multiple produces approximately $546. This requires continued accelerator demand, incremental CPU demand from agentic AI, strong utilization, and effective cost control. It implies approximately 33% upside.

Weighting the three scenarios produces a value of approximately $441 per ADR. Our final fair-value estimate is rounded to $440, with a reasonable range of $400–480.

The estimated 2026 dividend of NT$24 per ordinary share is equivalent to roughly $3.75 per ADR at an exchange rate near NT$32. Including the dividend, a move from $409.74 to fair value would produce a potential total return of approximately 8%.

Verdict

TSMC’s Q2 report strengthened the business thesis. AI demand is translating into revenue, advanced-node utilization, and a larger capital program. The company is not investing against a vague market narrative; management is responding to direct customer demand and acknowledged capacity shortages.

That does not automatically make the ADR inexpensive. At approximately $410, investors are paying for substantial growth while accepting three important risks: unusually high capital expenditure, margin dilution, and geopolitical concentration.

Our $440 fair value suggests that the ADR is modestly undervalued, but the expected return is not large enough to constitute a clear margin-of-safety opportunity. The stock may still suit a tech-savvy growth investor who is confident in the durability of AI infrastructure spending and willing to tolerate geopolitical volatility. It is less compelling for an investor seeking a classic value entry point.

The central question is no longer whether TSMC is benefiting from AI. The evidence clearly says it is. The question is whether AI demand will remain strong enough, for long enough, to generate attractive returns on the enormous capacity now being built.

Call to Action

Would you buy TSMC near $410, or would the combination of capital intensity and geopolitical risk require a larger discount?

Share your view in the comments, and follow SWOTstock for independent, evidence-based analysis of the next major earnings report.

Disclaimer

This article is for informational and educational purposes only and does not constitute financial advice, investment advice, or a recommendation to buy or sell any security. Valuation estimates depend on assumptions that may not materialize.

Semiconductor demand, foreign-exchange movements, capital expenditure, technology execution, and geopolitical events may cause actual outcomes to differ materially. Investors should conduct their own research and consider their objectives, financial circumstances, and risk tolerance before making an investment decision.
NVIDIA Q1 FY2027 Earnings: AI Infrastructure King Still Dominates — But Is the Market Starting to Question Sustainability?

NVIDIA reported Q1 FY2027 revenue of $81.6 billion, an 85% year-over-year increase, with Data Center revenue up 92%. Despite strong earnings, the stock fell, indicating investor concerns about sustaining AI infrastructure spending. The company’s strategic shift and ongoing growth suggest a promising future, but geopolitical risks and valuation questions remain.

TL;DR Summary

NVIDIA (NVDA:NASDAQ) delivered another extraordinary quarter, reporting Q1 FY2027 revenue of $81.6 billion, up 85% year over year, with Data Center revenue surging 92% to $75.2 billion. Blackwell deployment appears successful, enterprise AI adoption is broadening, and management continues positioning NVIDIA not merely as a chipmaker, but as the foundational infrastructure layer for the AI economy.

Yet despite the massive earnings beat, the stock declined after earnings. That reaction suggests the market is beginning to shift its focus from short-term growth toward a more difficult question: how sustainable is the current AI infrastructure spending cycle?

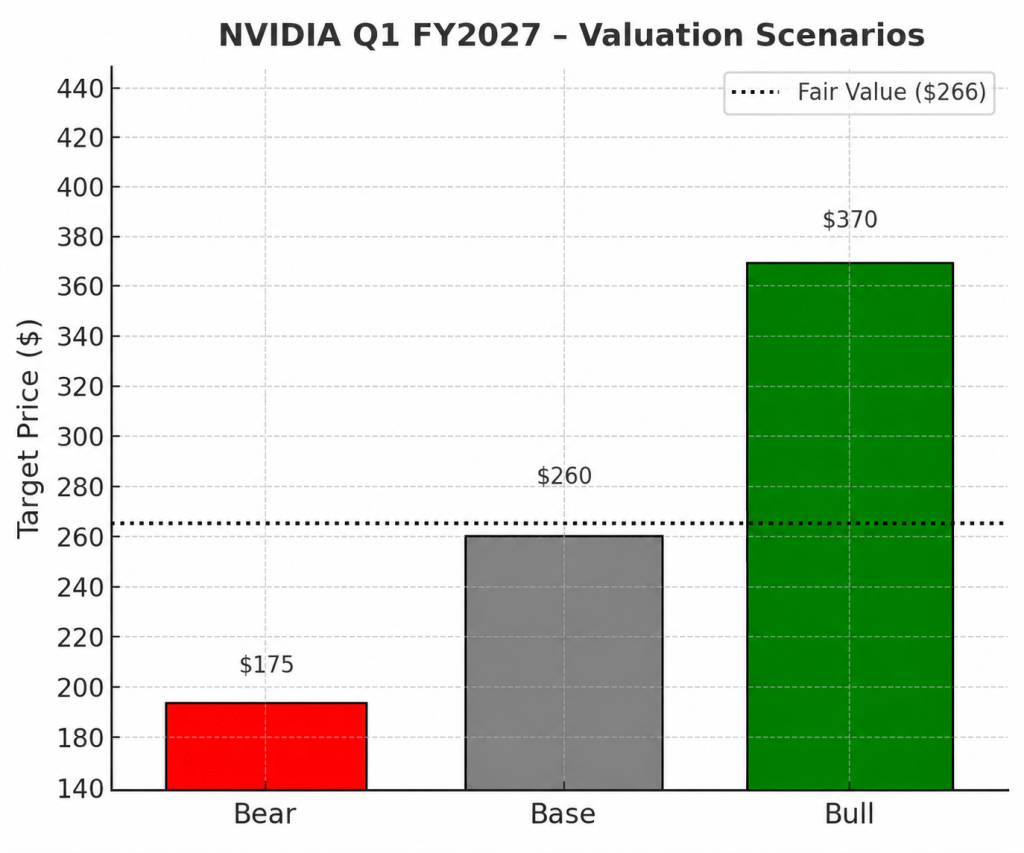
Our probability-weighted fair value estimate stands at approximately $266/share, with the market increasingly pricing NVIDIA as a long-duration AI platform rather than a traditional semiconductor company.


Quarter Recap

NVIDIA’s Q1 FY2027 results reinforced why the company remains the central player in the global AI boom.

Revenue reached $81.6 billion, growing 85% year over year and 20% sequentially. The Data Center segment once again dominated results, generating $75.2 billion in revenue, up 92% year over year. Gross margins remained extraordinarily strong at roughly 75%, while management also announced an additional $80 billion share repurchase authorization and raised the quarterly dividend.

Perhaps most importantly, management commentary strongly suggested that the transition from Hopper to Blackwell is progressing successfully. Earlier investor concerns about deployment bottlenecks, power constraints, and customer transition risks did not materialize in the quarter.

CEO Jensen Huang framed the AI buildout as “the largest infrastructure expansion in human history,” emphasizing NVIDIA’s long-term positioning across AI factories, networking, enterprise AI, robotics, and edge computing.

The company also revealed an important strategic shift: hyperscalers now represent roughly half of Data Center revenue, with the remaining demand increasingly coming from enterprise AI, sovereign AI projects, and AI-native cloud providers. That diversification helps reduce one of the major bear concerns surrounding customer concentration.

However, China export restrictions remain a meaningful headwind. NVIDIA disclosed that it had no Hopper shipments into China during the quarter, compared to billions of dollars of China-related revenue a year earlier.


Key Highlights

  • Revenue grew 85% year over year to $81.6 billion
  • Data Center revenue surged 92% to $75.2 billion
  • Blackwell deployment appears to be ramping successfully
  • Gross margins remained near 75%
  • NVIDIA authorized an additional $80 billion buyback
  • Dividend increased substantially
  • Enterprise and sovereign AI demand broadened beyond hyperscalers
  • China export restrictions remain a material geopolitical risk
  • Market reaction after earnings was negative despite strong operational performance

SWOT Analysis

NVIDIA’s latest quarter continues to demonstrate extraordinary operational strength. However, investors are increasingly debating whether the current valuation already assumes years of uninterrupted AI infrastructure expansion.

Strengths

  • NVIDIA remains the dominant AI infrastructure platform globally, supported by CUDA, NVLink, networking, and a deeply integrated ecosystem.
    • Estimated price impact: +15% to +25%
  • Data Center growth remains exceptional, with revenue up 92% year over year despite ongoing China restrictions.
    • Estimated price impact: +10% to +18%
  • Blackwell deployment appears successful, easing prior investor concerns around product transition risks.
    • Estimated price impact: +8% to +15%
  • Gross margins near 75% and enormous cash generation continue to separate NVIDIA from most semiconductor peers.
    • Estimated price impact: +5% to +12%
  • Demand is increasingly diversifying beyond hyperscalers into enterprise AI, sovereign AI, and industrial AI deployments.
    • Estimated price impact: +5% to +10%

Weaknesses

  • NVIDIA’s valuation already reflects extremely high expectations for long-term AI dominance.
    • Estimated price impact: -10% to -20%
  • Current growth remains heavily dependent on sustained AI infrastructure spending globally.
    • Estimated price impact: -8% to -18%
  • Hyperscaler concentration risk, while improving, remains meaningful.
    • Estimated price impact: -5% to -12%
  • The company faces constant pressure to flawlessly execute across Blackwell, Rubin, networking, and software ecosystems.
    • Estimated price impact: -5% to -10%

Opportunities

  • AI inference demand could eventually surpass training demand as enterprise AI agents become mainstream.
    • Estimated price impact: +15% to +30%
  • Robotics, autonomous systems, and physical AI represent potentially massive adjacent growth markets.
    • Estimated price impact: +10% to +25%
  • Enterprise AI adoption still appears to be in the early innings globally.
    • Estimated price impact: +10% to +20%
  • NVIDIA’s evolution into a full-stack AI infrastructure provider could strengthen its competitive moat further.
    • Estimated price impact: +8% to +18%

Threats

  • China export restrictions remain a significant geopolitical and revenue risk.
    • Estimated price impact: -10% to -20%
  • Hyperscalers continue developing custom AI chips that may reduce dependency on NVIDIA over time.
    • Estimated price impact: -8% to -18%
  • AI infrastructure spending could eventually enter a digestion phase after the current deployment boom.
    • Estimated price impact: -15% to -30%
  • Competition and eventual margin normalization may pressure valuation multiples in the future.
    • Estimated price impact: -5% to -15%
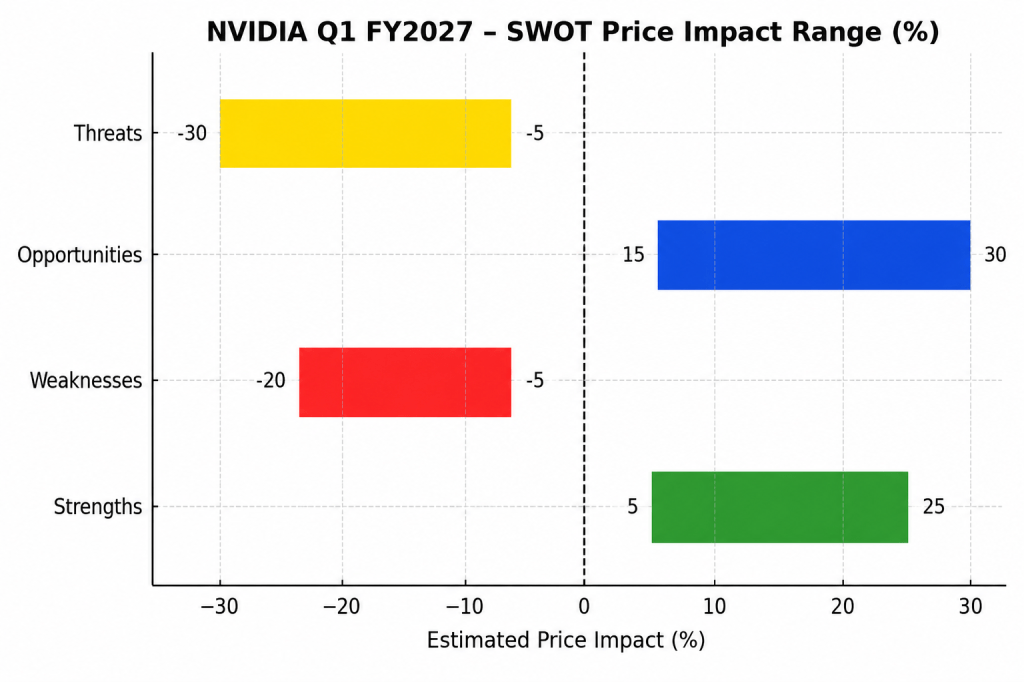
NVIDIA Q1 FY2027 SWOT price impact range chart showing strengths, weaknesses, opportunities, and threats with estimated percentage impacts on stock valuation following strong AI infrastructure earnings growth.
NVIDIA Q1 FY2027 SWOT analysis chart illustrating the estimated valuation impact ranges from AI infrastructure leadership, Blackwell deployment, enterprise AI expansion, valuation risks, and geopolitical threats.

Valuation Scenarios

NVIDIA’s valuation increasingly depends on how long the AI infrastructure cycle continues and whether AI ultimately becomes a foundational layer of the global economy.

Bear Scenario

In the bear case, hyperscaler AI spending slows materially over the next several years as customers optimize deployed infrastructure and enterprise ROI proves slower than expected. Growth decelerates sharply, margins normalize lower, and valuation multiples compress.

  • Estimated fair value: $160–$190
  • Probability: 25%

Base Scenario

In the base case, AI infrastructure demand remains structurally strong but gradually moderates into a sustainable multi-year growth cycle. NVIDIA maintains leadership across AI compute, networking, and software ecosystems while enterprise AI adoption continues expanding globally.

  • Estimated fair value: $240–$280
  • Probability: 50%

Bull Scenario

In the bull case, AI evolves into a foundational global infrastructure layer comparable to cloud computing or the internet itself. Inference demand explodes, robotics and physical AI scale rapidly, and NVIDIA successfully becomes the operating platform for global AI infrastructure.

  • Estimated fair value: $320–$420
  • Probability: 25%

Based on these scenarios, our estimated probability-weighted fair value is approximately:

→ $266/share

NVIDIA Q1 FY2027 valuation scenarios chart showing bear, base, and bull case target prices with a probability-weighted fair value estimate of $266 per share.
NVIDIA Q1 FY2027 valuation scenario analysis comparing bear, base, and bull case price targets based on AI infrastructure demand sustainability, enterprise AI adoption, and long-term platform dominance potential.

Verdict

Operationally, NVIDIA still looks extraordinarily strong. The company continues to dominate the global AI infrastructure market, margins remain exceptional, and Blackwell deployment appears successful.

The market’s muted post-earnings reaction likely reflects a shift in investor psychology rather than disappointment in the quarter itself. Investors are beginning to ask whether the current pace of AI infrastructure spending can continue for many years and whether NVIDIA’s valuation already prices in near-perfect execution.

For long-term growth investors, NVIDIA still represents one of the highest-quality AI infrastructure companies globally. However, future returns may increasingly depend not only on continued strong growth, but on NVIDIA’s ability to justify its role as a long-duration AI platform rather than merely a cyclical semiconductor leader.


Call to Action

Do you think NVIDIA’s current valuation still underestimates the long-term AI opportunity, or is the market finally becoming more cautious about AI infrastructure sustainability?

Visit SWOTstock for more earnings breakdowns, SWOT analysis, and valuation scenarios focused on helping retail investors better understand the companies shaping the AI economy.


Disclaimer

This article is for informational and educational purposes only and does not constitute investment advice. Investors should conduct their own research and consider their financial situation and risk tolerance before making investment decisions.


AMD Q1 2026 Earnings: AI Breakout or Fully Priced Momentum?

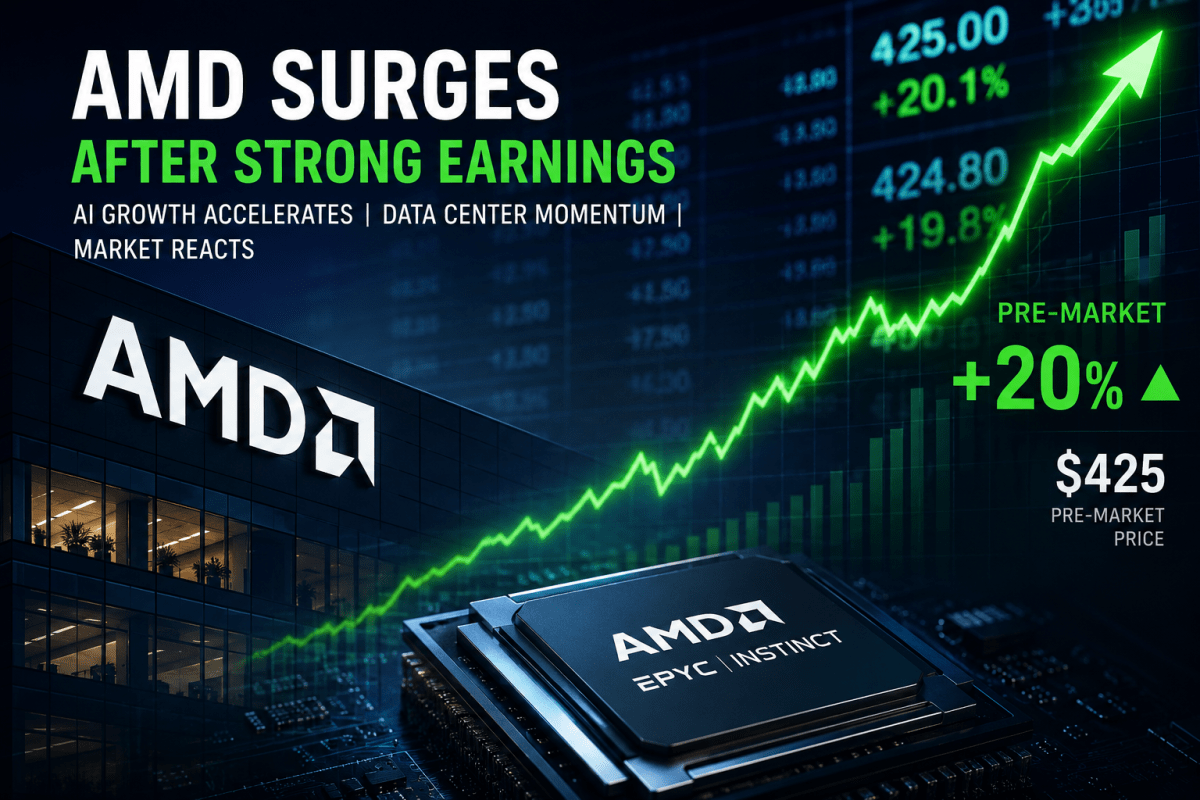
Advanced Micro Devices (AMD) demonstrated strong Q1 2026 results, with a significant shift towards AI-driven growth, particularly in its data center business. The stock experienced a ~20% pre-market gain, reflecting increased market confidence. However, risks related to expectation management and competition with NVIDIA remain, posing potential challenges to sustained growth.

TL;DR Summary

Advanced Micro Devices (AMD:NASDAQ) delivered a clear AI-driven breakout in Q1 2026, triggering a ~20% pre-market gain at one time, re-rating from ~$355 to ~$425. The market is no longer questioning AMD’s role in AI—it is pricing in continued execution. The key question now is not whether AMD can grow, but whether it can outperform already elevated expectations. Upside remains, but risk has shifted toward expectation compression.


Quarter Recap

AMD’s Q1 2026 results confirm a structural shift in the business.

The company is no longer driven by a balanced portfolio across client, gaming, and embedded segments. Instead, growth is now clearly concentrated in Data Center, powered by EPYC CPUs and MI300 AI accelerators.

Client showed early signs of stabilization after a prolonged downturn, while Gaming and Embedded continued to decline due to cyclical normalization and inventory digestion. Profitability improved, supported by a mix shift toward higher-margin AI and data center products.

Management emphasized strong hyperscaler demand and an accelerating AI deployment pipeline, reinforcing that AMD is now positioned as a meaningful participant in AI infrastructure.


Key Highlights

AMD’s earnings were not just “good”—they were better than what the market had already priced in.

The most important takeaway is that AI is no longer a future narrative for AMD. It is now the current growth engine, with real revenue contribution and margin impact.

However, this strength is not evenly distributed. Legacy segments remain weak, and the company is increasingly dependent on continued AI momentum to sustain growth.


SWOT Analysis (with Price Impact)

AMD’s valuation must now be understood in the context of a post-re-rating stock. The ~20% jump pre-market reflects a shift in expectations, not just fundamentals.

Strengths

AMD’s AI and data center business has reached an inflection point. The MI300 ramp and EPYC demand validate that AMD is no longer an AI outsider. This directly drove the recent re-rating and remains the core upside driver, contributing an estimated +10% to +20% impact on valuation.

At the same time, the mix shift toward higher-margin AI products is improving profitability, supporting an additional +5% to +10% upside.


Weaknesses

Despite strong hardware progress, AMD still trails NVIDIA in software ecosystem strength. CUDA remains a significant moat, limiting AMD’s ability to fully capture AI demand. This gap represents a -10% to -20% valuation drag.

Additionally, AMD’s reliance on AI is increasing as other segments underperform. Gaming and Embedded remain weak, creating concentration risk, with a -5% to -10% impact.


Opportunities

The AI market remains the largest opportunity. If AMD continues to gain share in hyperscaler and enterprise deployments, the upside is substantial, contributing +20% to +40% potential.

AMD also benefits from being a credible second supplier in a market dominated by NVIDIA. Hyperscalers are actively seeking alternatives, creating a structural tailwind worth +10% to +20%.


Threats

The biggest risk is no longer execution—it is expectations.

After a ~20% move, the market now requires AMD to consistently exceed forecasts. Any sign of normalization could trigger -20% to -35% downside through multiple compression.

Competition remains intense. NVIDIA continues to innovate aggressively, while companies like Amazon and Microsoftare investing in in-house AI chips. This creates a -10% to -25% risk to long-term positioning.


SWOT Summary Table

CategoryFactorPrice Impact
StrengthAI/Data Center breakout+10% to +20%
StrengthMargin expansion+5% to +10%
WeaknessNVIDIA ecosystem gap-10% to -20%
WeaknessAI concentration risk-5% to -10%
OpportunityAI market share expansion+20% to +40%
OpportunitySecond supplier advantage+10% to +20%
ThreatExpectation compression-20% to -35%
ThreatCompetitive pressure-10% to -25%

Valuation Scenarios

AMD is now trading at approximately $425 post-earnings, following a significant re-rating.

Instead of relying on arbitrary EPS assumptions, we anchor valuation to business outcomes and market positioning.

  • Bear Case ($200–300): AI growth slows or fails to exceed expectations. Multiple compresses as the narrative weakens.
  • Base Case ($300–400): AMD executes well, with steady AI growth and margin improvement.
  • Bull Case ($400–600+): AMD achieves meaningful AI share gains and is re-rated closer to top-tier AI infrastructure players.

Verdict

AMD has successfully crossed the most important threshold—it has proven that it belongs in the AI conversation.

However, the stock is no longer early. At ~$425, the market is already pricing in a significant portion of future success.

This creates a shift in the investment thesis. AMD is no longer a “discovery” story but an execution story, where upside depends on consistently exceeding already high expectations.

For investors, this means the risk-reward profile has become more balanced, with less margin for error.


Call to Action

If you’re following AI infrastructure stocks, AMD is now a critical name to watch—not for its potential, but for its ability to deliver quarter after quarter.

Follow SWOTstock for grounded, investor-focused earnings analysis that separates facts, market reaction, and real valuation thinking.


Disclaimer

This content is for informational purposes only and does not constitute financial advice. Investors should conduct their own research and consider their risk tolerance before making investment decisions.