SAP Q1 2026 Earnings: From Cloud Transition to Cash Flow Compounder?

SAP reported strong Q1 2026 results, showcasing accelerated cloud ERP growth, a significant backlog increase, and improved profitability. Although investors reacted positively, full-year guidance remains unchanged, raising concerns about future growth sustainability. As SAP transitions to a recognized compounder, investors must evaluate if its current premium valuation is warranted.

TL;DR

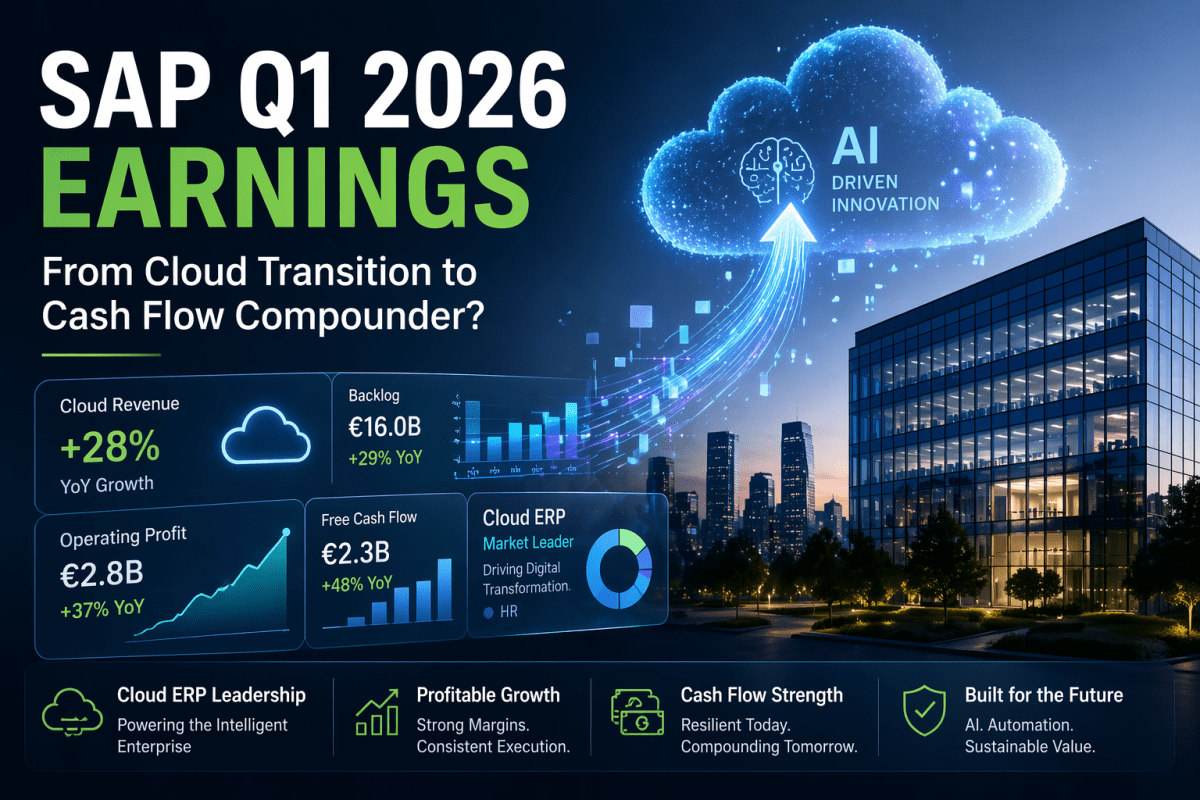
SAP (SAP:NYSE) delivered a strong Q1 2026 with accelerating cloud ERP growth, rising backlog visibility, and expanding margins. The stock’s ~+6% post-earnings reaction signals that investors are regaining confidence in SAP as a durable, high-quality enterprise software compounder.

However, the key debate has shifted: this is no longer about turnaround — it’s about whether SAP deserves a premium valuation.


Quarter Recap

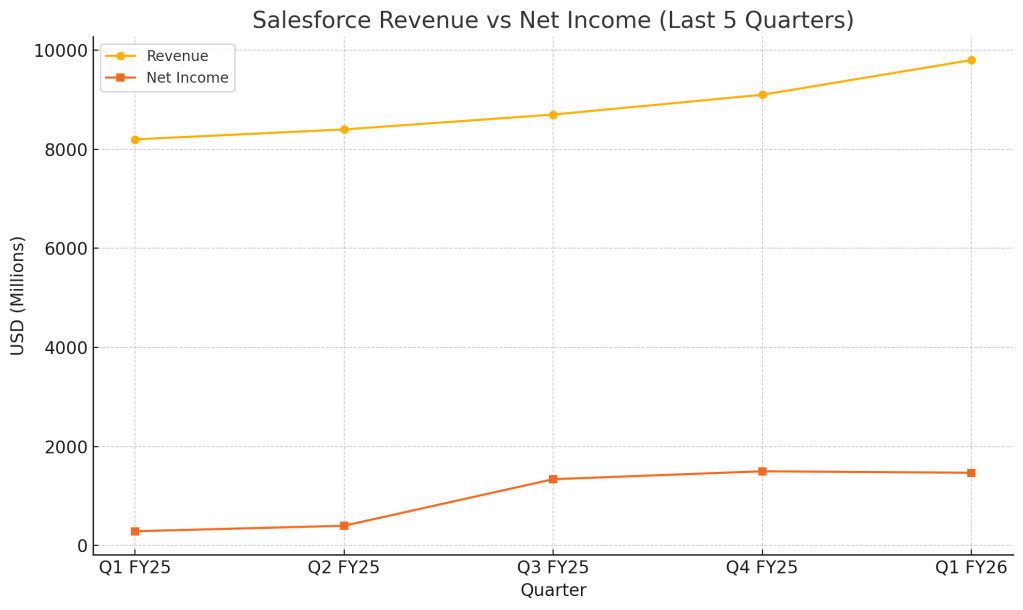
SAP’s Q1 results confirmed that its multi-year cloud transition is not only intact but strengthening. Cloud backlog rose to €21.9B, growing 25% in constant currency, while cloud ERP suite revenue accelerated to 30% growth.

At the same time, profitability improved meaningfully, with operating profit rising 24% in constant currency. This combination — growth plus margin expansion — is exactly what long-term investors look for in a maturing software platform.

Yet, SAP did not raise full-year guidance. That detail matters more than it looks.


Key Highlights

SAP’s quarter can be summarized as follows:

  • Strong cloud backlog growth reinforcing revenue visibility
  • Continued dominance in cloud ERP, the company’s core moat
  • Clear operating leverage and margin expansion
  • Ongoing decline in legacy license and services revenue
  • Stable (not upgraded) FY2026 guidance

This creates a tension between strong execution today and uncertainty about the growth trajectory ahead.


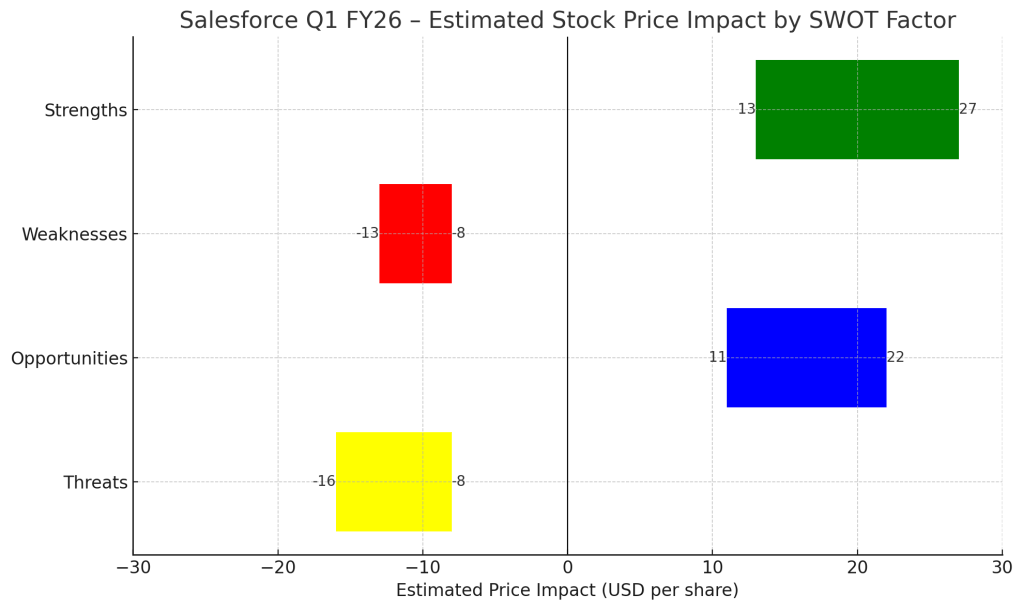
SWOT Analysis (with Price Impact)

SAP’s current positioning reflects a transition into a quality compounder, but not without risks.

Strengths

SAP’s backlog growth provides strong forward visibility, reducing downside risk and supporting valuation stability. At the same time, its cloud ERP suite continues to expand rapidly, reinforcing its dominance in mission-critical enterprise systems. Combined with rising operating leverage, SAP is increasingly viewed as a cash flow engine rather than just a cloud transition story.

Weaknesses

The decline in legacy license and services revenue continues to weigh on overall growth perception. More importantly, the decision to maintain — rather than raise — full-year guidance introduces uncertainty about how sustainable the current growth momentum really is.

Opportunities

SAP is uniquely positioned to embed AI into existing ERP workflows, which could unlock incremental monetization. In parallel, continued margin expansion could justify a re-rating toward premium software multiples.

Threats

Growth normalization remains the biggest risk. SAP itself signaled that Q1 benefited from timing effects, with slower growth expected in Q2. In addition, macro and geopolitical assumptions embedded in guidance introduce external uncertainty uncommon for software firms.
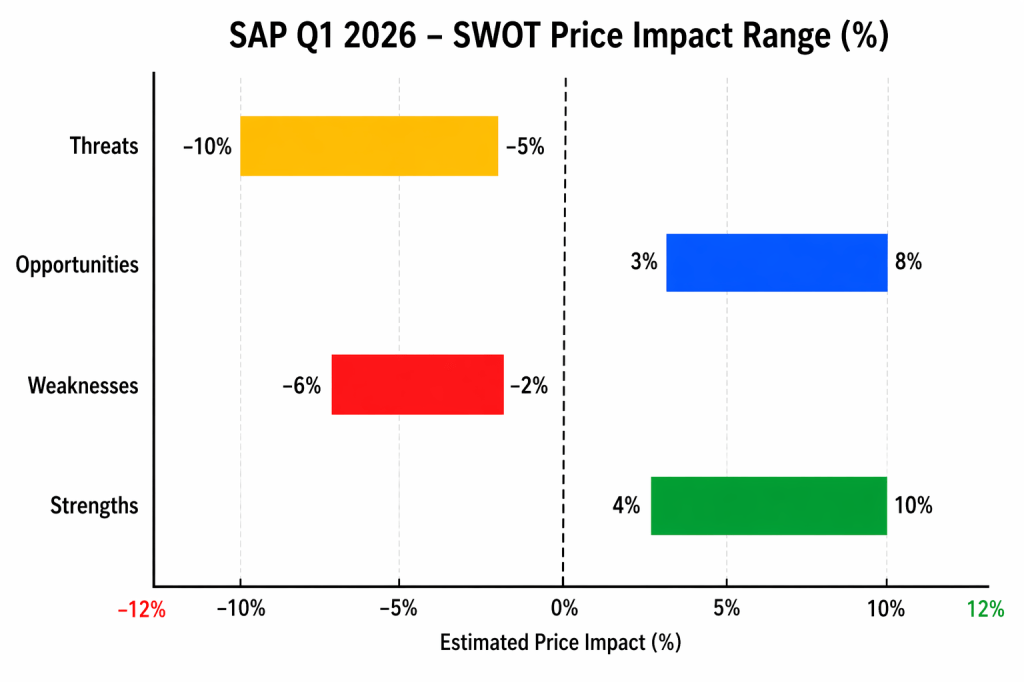
CategoryDriverPrice Impact
StrengthBacklog visibility+6% to +10%
StrengthCloud ERP dominance+5% to +9%
StrengthMargin expansion+4% to +8%
WeaknessLegacy decline-3% to -6%
WeaknessNo guidance raise-2% to -5%
OpportunityAI monetization+3% to +8%
OpportunityMultiple expansion+4% to +7%
ThreatGrowth normalization-5% to -10%
ThreatMacro/geopolitical risk-3% to -7%
SAP Q1 2026 SWOT price impact range chart showing upside from backlog and ERP growth versus downside from normalization risks
SAP’s valuation is driven by strong ERP and backlog momentum, with downside risks centered on growth normalization

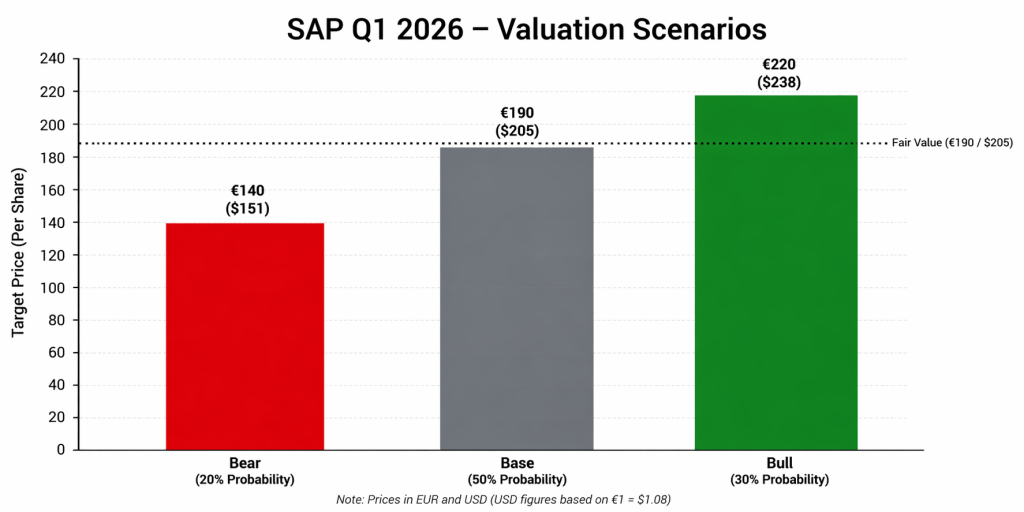
Valuation Scenarios (EUR & USD)

The ADR closing price after earnings released was ~USD175, up more than 7%

  • FX assumption: €1 ≈ $1.08

Bull Case (30% probability)

SAP successfully transitions into a premium compounder with sustained ERP growth and continued margin expansion.

  • EUR: €210 – €230
  • USD: $227 – $248

Base Case (50% probability)

Growth moderates but remains durable. SAP trades as a high-quality but mature enterprise software leader.

  • EUR: €184 – €196
  • USD: $199 – $212

Bear Case (20% probability)

Growth slows faster than expected, and Q1 proves to be a peak quarter.

  • EUR: €130 – €150
  • USD: $140 – $162

Probability-Weighted Outcome

  • Expected fair value range:
    → €187 – €193
    → $202 – $208

This implies moderate upside from current levels, but not a deep margin of safety.

SAP Q1 2026 valuation scenarios chart showing bear, base, and bull case price targets in euros and US dollars with probability weighting and fair value reference
SAP’s valuation suggests moderate upside under the base case, with potential re-rating if margin expansion continues, while downside risk remains if growth normalizes faster than expected

Verdict

SAP is no longer a turnaround story. It is evolving into a high-quality enterprise compounder with strong cash flow characteristics.

But that evolution comes with a new challenge:

The market is already starting to price it that way.

For investors, the opportunity is not in identifying whether SAP is improving — that is now clear. The real question is whether the current valuation fully reflects that improvement.


Call to Action

If you are a long-term investor, SAP remains a strong candidate for a core portfolio holding, especially if you believe in the durability of enterprise ERP systems.

However, this is no longer a stock to chase aggressively. Entry discipline matters more than ever.


Disclaimer

This analysis is for informational purposes only and does not constitute financial advice. Always conduct your own research and consider your risk tolerance before making investment decisions.


Why Oracle Soared While Adobe Slipped: What Diverging Stock Reactions Reveal About Investor Confidence in AI

Oracle and Adobe both beat earnings expectations, but their stocks moved in opposite directions. Discover why Oracle soared while Adobe slipped—and what it reveals about investor confidence in AI execution vs. hype.

Two enterprise tech giants—Oracle and Adobe—both reported strong quarterly results this past week. Each beat Wall Street expectations and highlighted their advancements in artificial intelligence. But the stock market reaction couldn’t have been more different:

  • Oracle stock surged +13%
  • Adobe stock declined –7%

At SWOTstock, we examined the earnings reports, management commentary, and investor sentiment. What we found illustrates a growing gap in how the market values AI strategy: it’s not about who talks the loudest—it’s about who delivers results.

Visual comparison chart of Oracle and Adobe's Q2 FY2025 earnings and AI strategies. The chart contrasts both companies across key metrics: revenue growth (+11% each), AI strategy (Oracle monetizing, Adobe uncertain), cloud momentum (Oracle’s OCI +52%), revenue visibility ($138B RPO for Oracle), and stock reaction (+13% vs. –7%). Highlights Oracle's strong execution versus Adobe’s investor skepticism.

Oracle: AI Execution Drives Confidence and Capital

Oracle’s Q4 FY2025 earnings confirmed the company’s transformation from legacy enterprise vendor to cloud-first AI infrastructure provider. Revenue climbed 11% YoY, while Oracle Cloud Infrastructure (OCI) accelerated an impressive 52%.

What truly stood out was Oracle’s $138 billion in remaining performance obligations (RPO), offering investors forward-looking visibility. With high-profile partnerships (NVIDIA, Cohere) and GenAI workloads already in production, Oracle isn’t pitching an AI future—it’s reporting on AI present.

SWOTstock Takeaway
Oracle’s strength lies in its ability to turn AI demand into revenue now—not years from now.

Key Strengths:

  • Cloud Infrastructure (OCI) grew +52% YoY
  • AI partnerships with NVIDIA and Cohere are already monetizing
  • $138B RPO provides long-term visibility and stability

Risks to Watch:

  • Continued competition from AWS, Microsoft, and Google
  • Legacy on-premise business still weighs on blended growth
Oracle SWOT analysis chart with four quadrants:

    Strengths: Strong OCI momentum, deep enterprise relationships

    Weaknesses: Slow AI service adoption, legacy business drag

    Opportunities: Expanding AI workload footprint, growing infrastructure demand

    Threats: Cloud competition from hyperscalers, changing enterprise IT spending trends

Adobe: Solid Results, But Investors Want AI ROI

Adobe’s Q2 FY2025 results were strong on the surface: 11% revenue growth, earnings beat, and raised guidance. Yet investors responded with skepticism, sending the stock down 7%.

The issue? Despite promoting new AI tools like Firefly, GenStudio, and Acrobat AI, Adobe has yet to show how these innovations will contribute meaningful revenue in the short term. Investor patience is wearing thin.

Meanwhile, competition is heating up. Canva is gaining ground in design, while OpenAI and Google are introducing productivity tools that threaten Adobe’s document business. In this environment, a premium pricing model without clear AI-driven ARR growth becomes difficult to defend.

SWOTstock Takeaway
Adobe’s innovation story is still credible, but without visible monetization, the stock is vulnerable.

Key Strengths:

  • Industry-leading suite across Creative, Document, and Experience Cloud
  • Rapid rollout of AI-powered features

Risks to Watch:

  • No clear monetization path from AI features
  • Growing threats from Canva, OpenAI, and Google
  • Pressure on margins and customer retention
SWOT analysis chart of Adobe featuring the company logo at the center. The four quadrants highlight:

    Strengths: Leading creative software suite, growing AI capabilities

    Weaknesses: High valuation concerns, reliance on Creative Cloud

    Opportunities: Expansion into diverse AI applications, enterprise software potential

    Threats: Economic uncertainty, increasing competition in creative software market

Why the Divergence?

Despite similar top-line growth, the market saw Oracle and Adobe very differently:

Table comparing Oracle and Adobe’s Q2 FY2025 earnings and market reactions. Oracle delivered +11% revenue growth, +52% OCI growth, and a $138B RPO backlog, leading to a +13% stock surge. Adobe also posted +11% revenue growth but lacked visible AI monetization and competitive defense, resulting in a –7% stock drop.

Oracle showed the market what execution looks like. Adobe reminded investors that potential alone is no longer enough.


What to Watch in the Next 6–12 Months

🔮 Oracle Outlook:
Expect continued strength if cloud growth persists and GenAI partnerships scale. RPO offers downside protection in case of macro softness.

⚠️ Adobe Outlook:
Needs to prove that AI tools are driving ARR and enterprise wins. Without that, competitive pressures may accelerate valuation compression.


Final Thoughts: AI Is Entering the Show-Me Phase

This earnings season proves that we’re past the AI hype cycle. The market is now demanding proof—measurable, monetizable traction.

At SWOTstock, we’ll keep tracking this shift as it plays out in earnings calls, product roadmaps, and valuation resets.

👉 Follow us for AI-enhanced stock insights built for growth-minded and DIY value investors.


⚠️ Disclaimer

This analysis is based on publicly available company financials, earnings call commentary, and official press releases as of June 2025. It is intended for informational purposes only and does not constitute investment advice. Always perform your own due diligence.


Leave a comment


Salesforce Q1 FY26: AI Signals Are Strong, But The Market Demands More Than Hype

Salesforce Q1 FY26 earnings: strong cash flow, $1B+ AI revenue, and raised guidance—but the stock dipped. Discover our in-depth SWOT analysis, valuation scenarios, and why long-term tech investors may see upside.

🚀 TL;DR – Earnings Solid, Outlook Raised, But Street Unconvinced

Salesforce (NYSE: CRM) delivered on many fronts in Q1 FY26: strong free cash flow, a raised full-year outlook, and impressive AI momentum with over $1B in annualized AI revenue. Yet the market reaction was subdued. Shares slipped ~3% post-earnings as investors weighed modest growth against growing acquisition dependency. For long-term investors focused on enterprise AI, the current pullback may offer an attractive re-entry point — but execution risk remains high.


📊 Quarter Recap – Cash-Rich, AI-Forward, But Investors Ask: What’s Next?

Line chart showing Salesforce’s revenue and net income over the last five quarters, with revenue rising steadily from Q1 FY25 to Q1 FY26 and net income spiking in Q3 FY25 and Q4 FY25.

Salesforce reported Q1 FY26 revenue of $9.8 billion, reflecting 8% growth year-over-year. The company continues to demonstrate financial discipline, posting a 32.3% non-GAAP operating margin and generating $6.3 billion in free cash flow — a key metric that reinforces the strength of its subscription-based business model.

However, the earnings story wasn’t just about operational metrics. Management spent considerable time during the call highlighting Salesforce’s evolving identity as an AI-first enterprise software provider. The AI and Data Cloud segment reached a milestone of over $1 billion in annualized recurring revenue, up 120% from the prior year. Additionally, Agentforce — the company’s AI-powered sales assistant platform — closed over 8,000 deals, with 50% of them already monetized.

Despite these advancements, investor enthusiasm appeared tempered. Salesforce also unveiled its intention to acquire Informatica in a transaction valued at over $8 billion. While the strategic rationale centered on data integration and platform expansion, some investors viewed it as a sign that organic AI monetization remains in its early innings.


📌 Key Highlights

(📌 Visual Placeholder: Q1 FY26 Metrics Snapshot)

  • Revenue: $9.8B (+8% YoY)
  • Subscription & Support Revenue: $9.3B (+8% YoY)
  • Non-GAAP Operating Margin: 32.3%
  • Free Cash Flow: $6.3B (+4% YoY)
  • AI & Data Cloud ARR: $1B+ (+120% YoY)
  • Agentforce Deals: 8,000+ closed, 50% paid
  • Shareholder Return: $3.1B (including $2.7B in buybacks)
  • FY26 Guidance: Revenue raised to $41–41.3B, EPS to $11.27–11.33

🧠 SWOT Analysis – Is Salesforce Building Sustainable AI Moats?

(📊 Visual Placeholder: Horizontal Bar Chart – SWOT Price Impact Ranges)

Horizontal bar chart showing Salesforce’s estimated stock price impact by SWOT factor for Q1 FY26 with x-axis from –30 to 30. Categories include Threats (–16 to –8), Opportunities (+11 to +22), Weaknesses (–13 to –8), and Strengths (+13 to +27).

To evaluate Salesforce’s trajectory, we use a SWOT framework — layering qualitative insight with quantitative impact ranges to assess where the stock could go next.

✅ Strengths

Salesforce’s high-margin business continues to generate substantial cash, supporting both R&D and shareholder returns. With a 32.3% non-GAAP operating margin and $6.3B in quarterly free cash flow, the company remains financially resilient. Meanwhile, the $1B+ in AI annual recurring revenue — up 120% year-over-year — signals that the firm’s early bets on generative AI are beginning to materialize.

Estimated Price Impact: +5% to +10% ($13–27)

⚠️ Weaknesses

At 8% year-over-year growth, revenue is expanding — but not at a pace that excites growth-focused investors. Combined with an $8B acquisition of Informatica, some view the quarter as a reminder that Salesforce still leans heavily on M&A for platform expansion. This can dilute long-term returns if integration is poorly executed or if synergy realization takes longer than anticipated.

Estimated Price Impact: –3% to –5% ($8–13)

🌱 Opportunities

The most obvious upside lies in the scaling of Agentforce and global AI deployment. Management noted that over 8,000 Agentforce deals were signed, with paid conversion already at 50%. On top of that, international expansion — particularly in Japan, the UK, and Canada — could provide incremental growth via cross-product bundling and new verticals.

Estimated Price Impact: +4% to +8% ($11–22)

🧨 Threats

Salesforce is not immune to macroeconomic uncertainty. Should enterprise IT budgets tighten further, even AI-led offerings could face delayed adoption. Add to that the integration risk tied to Informatica, and the bear case begins to take shape. Investors have seen how difficult it can be to maintain focus and cost discipline amid large-scale acquisitions.

Estimated Price Impact: –3% to –6% ($8–16)


📋 SWOT Summary Table

SWOT summary table showing Salesforce’s Q1 FY26 strengths, weaknesses, opportunities, and threats with estimated stock price impacts. Strengths include strong cash flow and $1B+ AI ARR (+$13 to +$27); weaknesses include slower revenue growth and M&A reliance (–$8 to –$13); opportunities like Agentforce expansion and international AI rollout (+$11 to +$22); and threats such as macro uncertainty and acquisition risk (–$8 to –$16).

📐 Valuation Scenarios – Realistic Upside, But No Easy Wins

Bar chart showing Salesforce Q1 FY26 valuation scenarios: Bear Case at $260, Base Case at $290, Bull Case at $320, and Current Price at $266.92. A blue dotted line represents the fair value estimate at $293.

🟢 Bull Case – Target: $320 (Probability: 30%)

A best-case scenario assumes Salesforce executes flawlessly: Agentforce expands rapidly, international AI rollouts outperform, and Informatica is integrated smoothly. In this case, margin expansion and top-line acceleration could support a price of $320.

⚫ Base Case – Target: $290 (Probability: 50%)

In a more measured scenario, AI and cloud revenue continue to build gradually while macro headwinds and integration friction create a modest drag. Here, the valuation rests on steady execution — not breakout success.

🔴 Bear Case – Target: $260 (Probability: 20%)

The bear case includes a slower-than-expected AI ramp, growing customer budget constraints, and post-acquisition inefficiencies. Margins may hold, but revenue growth could fall short.

Weighted Fair Value:

(0.3 × $320) + (0.5 × $290) + (0.2 × $260) = $293


🔍 Peer Comparison – Where Salesforce Stands in the AI-Enterprise Cloud Race

Table comparing Salesforce, Microsoft, and ServiceNow across key enterprise AI metrics: AI ARR growth, free cash flow margins, AI integration strategies, transparency in disclosures, and M&A approach. Salesforce shows 120% AI ARR growth with high cash flow and aggressive acquisitions, Microsoft focuses on embedded AI with less disclosure, while ServiceNow emphasizes workflow-native AI with selective partnerships.

While Salesforce has made impressive strides in monetizing AI, investors are right to compare its positioning against other enterprise software giants. Let’s take a closer look at how Salesforce stacks up against Microsoft and ServiceNow — two of the most visible players in enterprise AI and workflow automation.

  • Microsoft (MSFT) remains the dominant force in cloud infrastructure and productivity software, with its AI integration deeply embedded in products like Office 365, Azure OpenAI, and Dynamics. Although Microsoft has been less transparent about standalone AI ARR, its cross-product integration strategy has kept it at the forefront of enterprise adoption. Its advantage lies in seamless native integration — rather than monetizing AI as a separate revenue line, it’s baking it into everything.
  • ServiceNow (NOW), on the other hand, is pursuing a focused strategy in workflow automation with GenAI capabilities tied to task orchestration, IT operations, and HR service delivery. While it doesn’t disclose AI revenue explicitly, estimates suggest significant uptake across modules, especially post its strategic partnerships with NVIDIA and Microsoft. Its modular SaaS structure allows for more agile, vertical-specific AI adoption.
  • Salesforce (CRM) is unique in that it publicly discloses AI ARR, which recently crossed the $1B threshold (up 120% YoY). This offers greater transparency — a potential edge with analysts and investors — but also sets higher expectations. Salesforce’s AI strategy is tied closely to its Data Cloud and the Agentforce platform, but the question remains whether it can scale these innovations organically or will rely on acquisitions like Informatica to accelerate adoption.

Overall, Salesforce appears to be ahead in AI monetization transparency, but trails in seamlessness of integration (vs. Microsoft) and vertical execution (vs. ServiceNow). The coming quarters will be critical in demonstrating that these early AI wins are scalable — not just showcase projects.


🧭 Verdict – AI Execution Will Make or Break This Re-Rating

At ~$267, Salesforce is trading about 9% below its probability-weighted fair value of $293. That’s not a deep discount — but for investors willing to wait on Agentforce and international AI scaling, it may represent a reasonable opportunity.

Still, this is not a momentum trade. Salesforce must show it can deliver consistent AI-driven revenue growth without leaning too heavily on M&A to do it.


📩 Call to Action

Follow @SWOTstock and subscribe to get clear, no-spin earnings breakdowns.


⚠️ Disclaimer

This article is based solely on Salesforce’s official Q1 FY26 earnings report and management’s public comments. It is not investment advice.


Leave a comment