Accenture Q1 FY2026 Earnings: A Wonderful Business, Still Waiting for Growth

Accenture reported strong fiscal Q1 2026 results, exceeding revenue and earnings expectations while managing margins and generating cash. However, growth remains cautious with low-single-digit revenue increases. AI demand is emphasized as crucial for long-term growth, yet short-term challenges persist. The stock is viewed as fairly valued at approximately $270.

TL;DR

Accenture  (ACN:NYSE) delivered another quarter of solid execution, beating expectations on revenue and earnings while maintaining margins and strong cash generation. AI demand continues to build, but management remains cautious on near-term revenue acceleration. At around $270, ACN appears fairly valued, with upside dependent on whether AI-led reinvention can meaningfully lift topline growth.


Quarter Recap

  • Fiscal Q1 2026 revenue came in at the high end of guidance, reflecting resilient enterprise demand despite a cautious macro environment.
  • Adjusted earnings grew faster than revenue, supported by disciplined cost control and modest operating leverage.
  • New bookings remained healthy, including continued momentum in AI-related transformation programs.
  • Management reiterated a cautious full-year outlook, emphasizing execution and long-term positioning rather than near-term acceleration.

Key Highlights

  • Revenue growth remained in the low- to mid-single-digit range, consistent with guidance.
  • Adjusted operating margins expanded modestly year over year.
  • Free cash flow supported ongoing dividends and share repurchases.
  • AI was framed as a core component of multi-year reinvention programs, not a standalone growth spike.
  • U.S. federal-related work continued to weigh on near-term growth visibility.
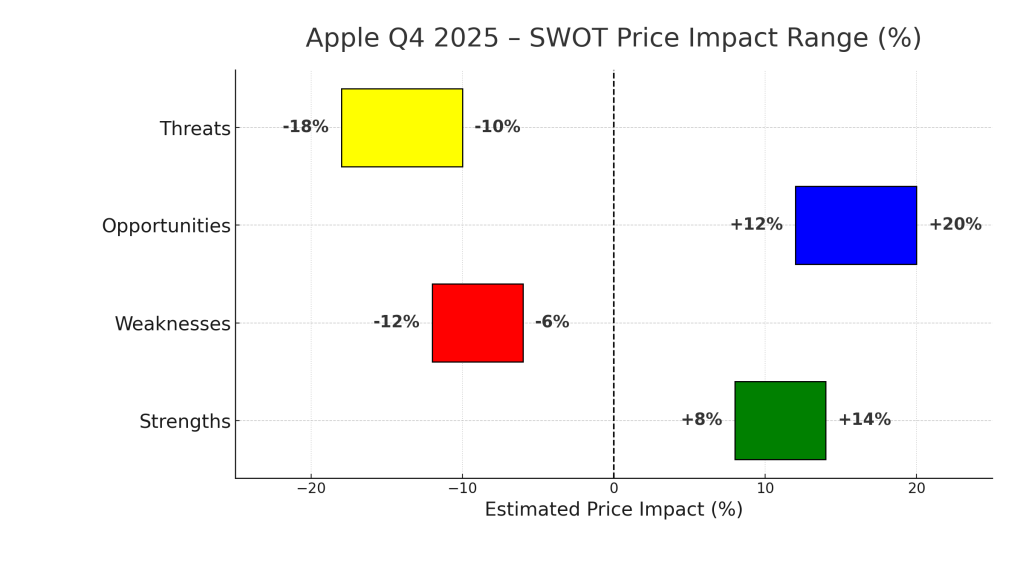
SWOT Analysis

Accenture’s investment profile reflects a balance between durable execution strength and a growth trajectory that remains steady rather than accelerating. The ranges below translate qualitative factors into estimated stock price impact.

Strengths

  • Deep enterprise relationships and recurring transformation demand (+8% to +12%)
  • AI embedded into large-scale reinvention programs, supporting long-term monetization (+6% to +10%)
  • Strong cash flow, balance sheet discipline, and shareholder returns (+4% to +6%)

Strengths — overall impact: +18% to +28%


Weaknesses

  • Low-single-digit organic revenue growth profile (–6% to –10%)
  • Continued softness in U.S. federal business (–4% to –7%)
  • Premium valuation leaves limited margin for disappointment (–5% to –8%)

Weaknesses — overall impact: –15% to –25%


Opportunities

  • Scaling AI-led reinvention programs across global enterprises (+10% to +18%)
  • Operating leverage if demand gradually normalizes (+6% to +10%)
  • Leadership role as an enterprise AI orchestrator across platforms and models (+5% to +8%)

Opportunities — overall impact: +21% to +36%


Threats

  • Prolonged enterprise budget caution delaying large transformation decisions (–10% to –15%)
  • Investor narrative around AI commoditization compressing consulting multiples (–8% to –12%)
  • Competitive pricing pressure from smaller firms and in-house teams (–5% to –8%)

Threats — overall impact: –23% to –35%
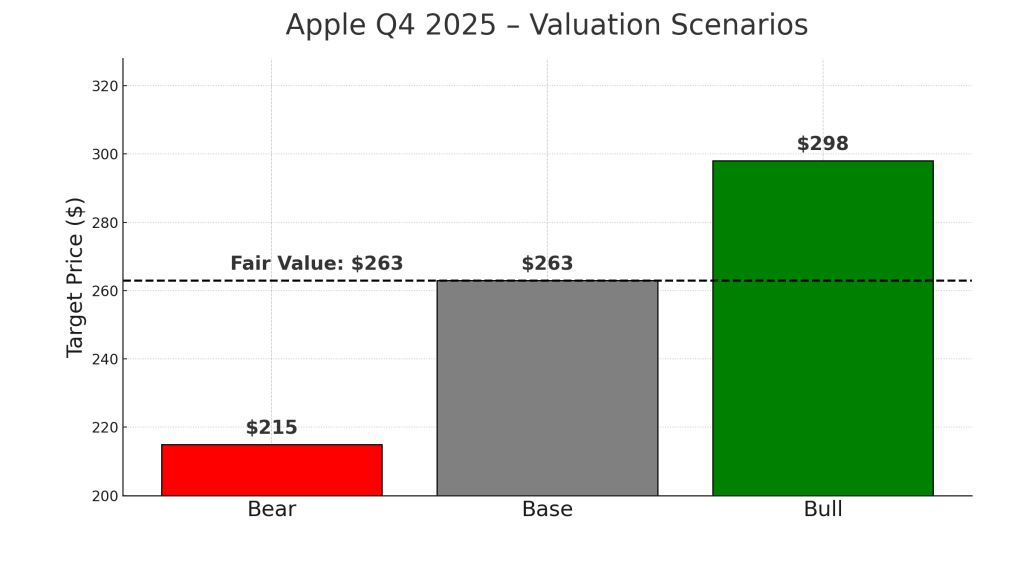
Accenture Q1 FY2026 SWOT price impact chart showing estimated stock impact ranges: strengths +18% to +28%, weaknesses −15% to −25%, opportunities +21% to +36%, and threats −23% to −35%, with a dashed zero reference line.

Valuation Scenarios

Accenture’s valuation outcome hinges less on margin execution—which remains strong—and more on whether AI-driven reinvention can re-accelerate revenue growth.

Using $270 as the current price anchor:

Bear Case

  • Revenue growth remains around 2–3%
  • Federal weakness persists and AI monetization is slower than expected
  • Valuation multiple compresses toward the lower end of historical ranges
  • Implied price: ~$209 (–22.5%)

Base Case

  • Revenue growth stabilizes around 4–5%
  • AI bookings convert gradually into revenue
  • Margins expand modestly, supporting high-single-digit EPS growth
  • Implied price: ~$290 (+7.5%)

Bull Case

  • AI-led reinvention drives sustained revenue acceleration above 6%
  • Enterprise spending cycle improves
  • Operating leverage supports double-digit EPS growth with modest multiple expansion
  • Implied price: ~$351 (+30%)

Fair Value Assessment

Applying a probability-weighted approach:

  • Bear: 25%
  • Base: 50%
  • Bull: 25%

This results in a probability-weighted fair value of approximately $285, or about 5–6% upside from current levels.

Accenture valuation scenarios chart based on Q1 FY2026 earnings, showing bear case price target of $209, base case $290, bull case $351, and a probability-weighted fair value of $285.

Verdict

Accenture remains a high-quality compounder with durable client relationships, strong execution, and disciplined capital returns. At around $270, the stock looks fairly valued rather than cheap. Downside is cushioned by cash flow and margins, but meaningful upside will require clearer evidence that AI-led reinvention can translate into sustained topline acceleration.


Call to Action

If you’re tracking enterprise AI adoption beyond the hype, follow SWOTstock for earnings-driven analysis that focuses on what actually moves stock prices.


Disclaimer

This article is for informational purposes only and does not constitute investment advice. All analysis is based on publicly available, official company disclosures and earnings call commentary. Investors should conduct their own research or consult a financial professional before making investment decisions.


Oracle Q2 FY2026 — Revenue Miss, AI Backlog Surge, and a 14% Drop: Value Reset or Warning Sign?

Oracle’s Q2 FY2026 results showed mixed performance with revenue at $16.06B slightly below expectations, while adjusted EPS at $2.26 was aided by a one-time gain. A significant $523B RPO backlog indicates strong future demand, yet stock fell over 10% to ~$199 amid concerns over profitability and capital intensity.

TL;DR Summary

Oracle (NYSE: ORCL) reported mixed Q2 FY2026 results: revenue came in slightly below expectations, adjusted EPS beat but was boosted by a one-time gain, and OCI continued strong but not hyper-scale acceleration. The standout metric was a massive $523B RPO backlog, signaling powerful long-term demand for AI and cloud infrastructure. Yet the stock still dropped over 10% after hours to ~$199 as investors recalibrated near-term profitability, cloud CapEx intensity, and the quality of earnings. Our fair value stands at $210–$215, with the pullback offering a more reasonable entry point for value-oriented investors who can tolerate AI-cycle volatility.


Quarter Recap

Oracle released its Q2 FY2026 results on December 10. Total revenue reached $16.06B, a modest YoY increase but a slight miss versus expectations. Adjusted EPS beat estimates at $2.26; however, the strength was driven by a $2.7B pretax gain from selling Oracle’s stake in Ampere Computing. OCI remained a bright spot, growing roughly 68% YoY and supported by AI training and inference demand, although growth did not exceed bullish expectations.

The biggest surprise came from Remaining Performance Obligations (RPO), which surged to $523B — one of the highest forward-demand indicators in enterprise tech. Despite this, the stock sold off sharply as investors focused more on margin pressure, heavy CapEx needs, and the softer revenue print. By late after-hours trading, Oracle shares had fallen to around $199, down more than 10%.


Key Highlights

  • Revenue: $16.06B, slightly below consensus
  • Adjusted EPS: $2.26, aided by a one-time Ampere stake sale
  • OCI: ~68% YoY growth, strong but not accelerating beyond expectations
  • RPO: Jumped to $523B, signaling multi-year cloud and AI demand
  • CapEx & Debt: Rising commitments for cloud infrastructure expansion
  • Market Reaction: Stock dropped from ~$230 to ~$199 after hours

SWOT Analysis

Oracle’s Q2 results highlight a company balancing immense long-term opportunity with near-term financial strain. While the AI infrastructure cycle is driving unprecedented backlog levels, the path to monetizing this demand profitably remains uncertain. The sell-off reflects this tension: long-term durable demand on one side, and rising costs, slower revenue, and an inflated EPS figure on the other.

Strengths (Price Impact: +6% to +12%)

  • Massive RPO backlog of $523B supporting multi-year revenue visibility (+3% to +5%)
  • Highly sticky database and support revenue base anchoring cash flow (+2% to +4%)
  • Strong OCI growth of ~68% YoY securing relevance in AI infrastructure (+3% to +5%)
  • Consistent capital returns through buybacks and dividends (+1% to +2%)

Weaknesses (Price Impact: –6% to –12%)

  • Revenue miss relative to AI-fueled expectations (–3% to –5%)
  • EPS beat driven by one-time Ampere stake sale (–2% to –4%)
  • Near-term margin pressure from heavy cloud infrastructure investments (–3% to –5%)
  • Elevated debt profile reducing financial flexibility (–1% to –2%)

Opportunities (Price Impact: +10% to +18%)

  • Multi-year AI infrastructure demand cycle boosting OCI adoption (+5% to +8%)
  • Database migration to OCI offering structural margin lift (+3% to +5%)
  • Cerner modernization creating long-term operating leverage (+2% to +4%)
  • Enterprise consolidation driving large, integrated cloud modernization deals (+2% to +3%)

Threats (Price Impact: –12% to –20%)

  • CapEx requirements rising to fulfill massive AI/cloud backlog (–5% to –8%)
  • Fierce competition from AWS, Azure, and Google Cloud (–3% to –6%)
  • AI contract profitability still unclear and may dilute margins (–2% to –4%)
  • Macro slowdown could hit enterprise IT spending (–2% to –3%)
Oracle Q2 FY2026 SWOT analysis chart showing estimated stock price impact ranges: Strengths +6% to +12%, Weaknesses –12% to –6%, Opportunities +10% to +18%, and Threats –20% to –12%, displayed on a horizontal bar chart with x-axis starting at –25%.

Valuation Scenarios

With shares falling to ~$199, Oracle now trades below our intrinsic value range. The key valuation driver is how quickly OCI can scale profitably relative to the heavy CapEx needed to support long-term AI demand. Below are three scenarios based on earnings normalization, cloud margin trajectories, and the appropriate earnings multiple for a hybrid software + cloud infrastructure business.

Bear Case — $175

  • OCI slows to 40–50%
  • CapEx stays elevated for multiple years
  • Core EPS normalizes lower after removing one-time gains
  • Multiple compresses to 15× forward EPS
  • Price Target: ~$175

Base Case — $215

  • OCI grows 55–65%
  • Revenue normalizes to mid-single digits
  • CapEx moderates by FY2027
  • Margins expand gradually
  • Valuation at ~17.5× forward EPS
  • Price Target: ~$215

Bull Case — $255

  • OCI re-accelerates to 70%+
  • AI contracts become margin accretive
  • Cloud and software synergy improves profitability
  • Market assigns a premium 20× forward multiple
  • Price Target: ~$255

Fari Value

Assigning scenario probabilities:

  • Bear: 30%
  • Base: 50%
  • Bull: 20%

FV = (175 x 0.3) + (215 x 0.5) + (255 x 0.2)

= 52.5 + 107.5 + 51 = 211

🎯 Probability-Weighted Fair Value = $211

Oracle Q2 FY2026 valuation scenarios chart comparing Bear case price target $175, Base case $215, and Bull case $255, with a dashed line indicating the probability-weighted fair value of $211.

Verdict

Oracle’s Q2 numbers delivered a mixed message: enormous long-term demand but weaker near-term fundamentals. The stock’s drop to ~$199 reflects investors resetting expectations for cloud profitability and earnings quality. Still, the pullback now places Oracle below our fair value estimate, creating a potentially attractive entry point for long-term, value-oriented investors who accept AI-cycle volatility. For investors seeking steady cash flow, disciplined capital returns, and long-term cloud upside, Oracle now screens more reasonable than before.


Call to Action

If you want structured, fact-based breakdowns of every earnings season — from Big Tech to industrials to retail — subscribe to SWOTstock. We turn dense earnings reports into clear insights so you can invest with conviction, not noise.


Disclaimer

This analysis is for informational purposes only and is not financial advice. All estimates are based on publicly available company filings and earnings calls. Investors should conduct their own due diligence before making investment decisions.


Apple Q4 2025 — The Comeback Quarter That Put “Intelligence” Back in Apple

Apple reported 8% revenue growth to $102.5 billion and a record $28.75 billion in Services, signaling a return to growth after a flat trend. The iPhone 17 launch and deeper ecosystem engagement drove this performance. Guidance for the holiday quarter suggests continued growth, aligning with Apple’s AI ambitions. Investors reacted positively, with a 6% share price increase post-announcement.

TL;DR Summary

Apple finally broke its flat-growth streak.
Revenue climbed 8 % y/y to $102.5 billion, EPS reached $1.85 (+9 %), and Services hit a record $28.75 billion.
Guidance for the holiday quarter calls for +10–12 % growth, reigniting belief that Apple Intelligence is more than a buzzword.
For growth investors, this quarter marks Apple’s return to the AI-led expansion narrative.


Quarter Recap

After four quarters of muted growth, Apple delivered what Tim Cook called “our strongest lineup ever.”
The iPhone 17 launch, deeper ecosystem engagement, and record Services revenue lifted results well above expectations.
Gross margin expanded to 47.2 %, net income rose to $24.2 billion, and Apple declared another $0.26 dividend while continuing aggressive buybacks.

Beyond the numbers, the tone of the call signaled confidence: management expects the December quarter to be the best holiday season in Apple’s history.
That optimism—and the 6 % share-price jump that followed—suggests investors finally see Apple’s AI strategy taking shape.


Key Highlights

  • Services: $28.75 B (+15 %) — now 28 % of total revenue and driving margin expansion.
  • iPhone: $49.0 B (+6 %) — AI-capable models leading upgrade cycle.
  • Mac / iPad: Flat to down slightly as users wait for AI refreshes.
  • Geography: Greater China $14.5 B (+3 %) — showing early stabilization.
  • Guidance: Revenue +10–12 %, gross margin 47–48 % next quarter.

(Note: Apple’s 8 % revenue growth trails Microsoft’s +12 % and Google’s +10 %, but represents its strongest acceleration since 2022.)


How Apple Intelligence Actually Creates Value

For now, “Apple Intelligence” isn’t a separate subscription—it’s a device-pull engine.
AI-driven features such as natural-language photo search, cross-app summaries, and on-device personal assistance require the latest hardware chips (A18, M4).
That design forces upgrades and feeds Services usage. Apple plans to layer paid tiers later, turning AI into a recurring revenue lever by FY 2026.


SWOT Analysis — Estimated Price Impact

Strengths (+6 to +12 %)
A 2.2 billion-device installed base and record Services margin growth create durable pricing power.
AI-ready devices expand average selling prices and lift gross margin.
→ + $15 – $30 per share

Weaknesses (–5 to –10 %)
Hardware still ≈ 48 % of sales; tariffs and China competition pressure margins.
AI monetization lag keeps near-term EPS growth modest.
→ – $13 – $26 per share

Opportunities (+10 to +18 %)
AI integration across devices and services bundles can boost ARPU by 5–8 %.
Emerging-market FinTech and subscriptions expand TAM.
→ + $20 – $36 per share

Threats (–8 to –15 %)
Regulation (EU DMA, App Store fees), supply-chain relocation costs, and AI competition remain real headwinds.
→ – $18 – $32 per share

Horizontal SWOT bar chart for Apple Q4 2025 showing the estimated stock-price impact ranges for Strengths, Weaknesses, Opportunities, and Threats. Strengths (green) range from +8% to +14%, Weaknesses (red) from –12% to –6%, Opportunities (blue) from +12% to +20%, and Threats (yellow) from –18% to –10%.

Valuation Scenarios

Apple’s fair value clusters around $270, but outcomes vary depending on how quickly its AI ecosystem monetizes.
Here’s how the road ahead could play out:

  • Bull Case ($305, ~30 % probability):
    Apple executes on AI integration, driving 12 % EPS growth and pushing Services beyond 30 % of total revenue.
    The market rewards it with a premium multiple near 32×.
  • Base Case ($270, ~50 % probability):
    EPS grows about 8 % as AI demand builds gradually.
    The stock trades around 29× earnings — roughly where it sits today.
  • Bear Case ($230, ~20 % probability):
    China softness, regulation, and muted AI monetization limit EPS to +3 %.
    Multiple compresses to 25× as investors rotate to faster-growing peers.

➡️ Fair Value Estimate: ≈ $272.5 per share, balancing these three outcomes.

Vertical bar chart for Apple Q4 2025 valuation scenarios showing Bear, Base, and Bull price estimates. Bear scenario (red) is $215, Base (gray) is $263, and Bull (green) is $298. A horizontal dashed line marks Fair Value at $263.

Verdict

At ≈ $270, Apple is fairly valued with a clear path to earnings expansion.
Growth investors should hold core positions and add on dips near $230–240.
The next inflection point arrives mid-2026, when AI features begin contributing revenue and Apple could justify a re-rating to 32–34× P/E ($285–295 target).
If Apple proves that Intelligence sells devices — not just headlines — $300 may come sooner than bears expect.


What to Watch Next

  • Adoption metrics for Apple Intelligence features in real-world use.
  • Services ARPU growth and subscription renewal rates.
  • China unit sales momentum post-holiday quarter.
  • Margin management as $1.4 B tariff cost hits Q1.

(Visual Placeholder #5 – Peer Comparison Table: Apple vs Microsoft vs Alphabet Growth and Margins)


Call to Action

Follow SWOTstock for AI-era earnings analysis of Amazon, Microsoft, and Tesla as we track how AI execution reshapes Big Tech leadership.
Subscribe for alerts when next-quarter AI scorecards drop.


Disclaimer

This analysis uses only Apple Inc.’s official Q4 FY 2025 financial report and earnings call.
It is for informational purposes only and not investment advice.