🏦 JPMorgan Q2 2025 Earnings — A Value Anchor in a Rate-Driven Storm

PMorgan’s Q2 2025 earnings beat expectations with 21% ROTCE, strong trading revenue, and raised NII guidance. Read our full SWOT analysis, fair value breakdown, and how JPM compares to Citi and Wells Fargo.

📌 TL;DR

JPMorgan (NYSE: JPM) delivered a strong Q2 with a solid earnings beat and raised full-year guidance, returning $11B to shareholders. While the stock barely moved, long-term value remains intact. DIY investors should watch for dips below $285.


📆 Q2 2025 Recap — Earnings Beat, Capital Strength

JPMorgan’s Q2 2025 performance was a masterclass in disciplined execution. The bank delivered an 11% EPS beat, maintained a stellar 21% ROTCE, and raised its full-year NII guidance—despite a revenue drop tied to tough comps from the prior year. Business segments like investment banking and trading outperformed, while capital return to shareholders remained robust with $11B distributed in just one quarter. This level of consistency and balance is exactly what long-term value investors look for.

Earnings highlights (July 15 release):

  • 🧾 EPS: $4.96 (vs $4.48 est), +11% beat
  • 💰 Net income: $15.0B (or $14.2B excl. tax benefit)
  • 📉 Revenue: $45.7B, down 10% YoY (due to Visa gain comp)
  • 💸 Capital Return: $3.9B in dividends + $7.1B in buybacks
  • 📈 ROTCE: 21% (20% adjusted)

Corporate & Investment Bank (CIB):

  • Net income: $6.7B, +13% YoY
  • Dealmaking fees: $2.5B, +7% YoY
  • Markets revenue: +15%, led by fixed income

📊 FY NII guidance raised: $95.5B (previously ~$94B)

Line chart showing JPMorgan's revenue and net income over the past five quarters from Q2 2024 to Q2 2025, highlighting strong Q2 2025 earnings performance.

📉 Market Reaction — Earnings Beat, Flat Price

JPM closed at $286.55, down ~0.3% on earnings day.

Despite delivering an impressive earnings beat and raising its full-year NII guidance, JPMorgan’s stock barely budged—closing the day slightly lower. The muted reaction puzzled many, but it likely reflects broader market caution rather than company-specific weakness. Investors may be focusing on rising expense trends, margin pressure from anticipated rate cuts, or simply digesting mixed signals from the banking sector as a whole. In other words, the fundamentals impressed—but sentiment lagged behind. For long-term investors, that disconnect may represent an opportunity.

  • YoY revenue drop from one-offs
  • Core expenses rising 5% YoY
  • Margin pressure from rate cuts

🧠 Jamie Dimon cautioned on “geopolitical instability, unsustainable fiscal deficits, and central bank pressure.”


🧠 SWOT Analysis with Price Ranges

To make sense of JPMorgan’s positioning, we broke down the quarter using our dollar-anchored SWOT framework. This isn’t just a list of talking points—it’s a tool to map potential price impacts. Strengths like high ROTCE and capital discipline support the upside, while expense growth and macro risk could pull against it. The result? A snapshot of both opportunity and risk that’s grounded in the fundamentals, not speculation.

Horizontal bar chart showing JPMorgan's SWOT analysis with estimated stock price impact ranges for Q2 2025. Strengths and Opportunities show upside potential, while Weaknesses and Threats show downside risks.
SWOT table summarizing JPMorgan's strengths, weaknesses, opportunities, and threats for Q2 2025, with estimated stock price impact ranges for each factor.

📊 Valuation Scenarios

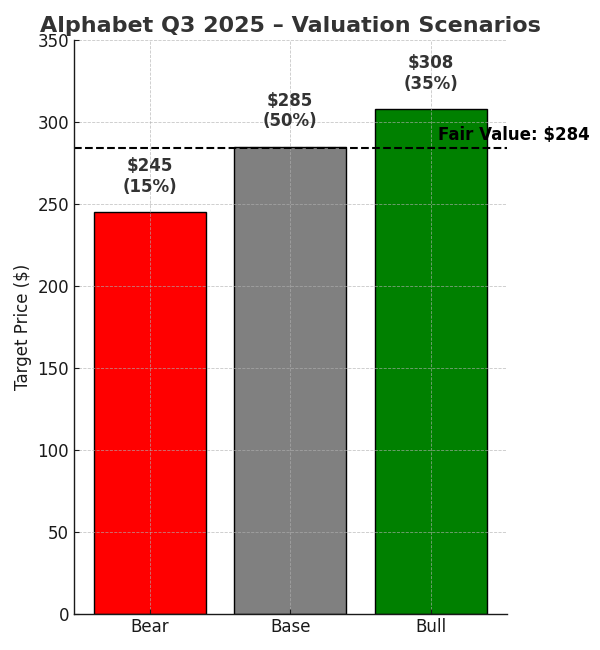
JPMorgan’s current share price sits just below our estimated fair value—but the path ahead depends on how macro and internal drivers unfold. In our model, we outline three scenarios: a bull case driven by continued earnings strength and compounding tech investments; a base case reflecting stable profitability; and a bear case factoring in rate compression and regulatory drag. We assign probabilities to each and arrive at a weighted fair value—offering a disciplined way to anchor expectations.

Vertical bar chart showing JPMorgan's bull, base, bear case target prices and current stock price for Q2 2025, with a dotted line indicating the fair value estimate.
Table showing JPMorgan’s Q2 2025 bull, base, and bear case price targets with associated probabilities and a calculated fair value estimate.

🔍 JPM vs Peers (Q2 2025 Snapshot)

What sets JPMorgan apart isn’t just the size of its balance sheet—but how efficiently it runs. Compared to Citi and Wells Fargo this quarter, JPM led in ROTCE, delivered solid beats, and even raised guidance. Meanwhile, peers either maintained or cut forecasts. The market’s muted response to JPM’s beat may have more to do with sector fatigue than actual fundamentals. The data tells a clearer story.

Comparison table of JPMorgan, Citigroup, and Wells Fargo showing Q2 2025 metrics including ROTCE, EPS surprise, NII guidance direction, and stock price reaction.

→ JPM’s valuation remains more attractive vs peers with stronger capital efficiency.


✅ Verdict — Value with a Margin of Safety

For value-focused investors, JPMorgan continues to check the boxes: high ROTCE, strong dividend yield, and durable earnings. The muted stock reaction creates an opening—not for hype-driven gains, but for steady compounding. With shares trading just below our fair value estimate, the risk-reward profile remains favorable. If your investing playbook includes buying quality on dips, JPM still earns a spot near the top of the list.

  • Strong ROTCE and stable capital return
  • Resilient fee-based businesses (trading, IB, payments)
  • Undervalued at current price with room for compounding

Buy range: Below $285
Fair value: $290–$295
Dividend yield: ~2.0%
5-Year Dividend CAGR: ~8.6%


📣 Why Subscribe to SWOTstock?

If you found this analysis useful, don’t just bookmark it—subscribe. At SWOTstock, we break down every major earnings report using only official numbers, structured insights, and investor-first language. No hype, no jargon. Just clear, actionable takeaways built for long-term thinkers. Whether you’re tracking your portfolio or building conviction, you’ll get the clarity you need—right when it matters most.


📬 Official-sourced only.
📉 No hype. Just facts.
📈 Fair value + SWOT + Visuals in every post.

👉 Subscribe now and get value investor reports delivered weekly.


⚠️ Disclaimer

This content is provided for informational and educational purposes only and does not constitute investment advice, a recommendation, or an offer to buy or sell any securities. All analysis is based solely on publicly available financial reports and official company statements. Always conduct your own research or consult with a licensed financial advisor before making investment decisions. The authors of this post may hold positions in the companies mentioned.


Leave a comment


JPMorgan vs. Citigroup: How Q1 Set the Tone for a Pivotal Q2 2025

Featured image displaying JPMorgan and Citi logos side by side on a blue background with “vs.” between them, representing a comparison of their Q1 2025 earnings performance.

TL;DR:
JPMorgan Chase (NYSE: JPM) and Citigroup (NYSE: C) kicked off 2025 with strong Q1 earnings, bolstered by solid trading performance and robust net interest income. But as Q2 earnings approach, both banks face persistent macroeconomic uncertainty, cautious client sentiment, and a potentially slower investment banking environment. Here’s how Q1 played out—and what investors should be watching this July.


Q1 Recap: Momentum With a Hint of Caution

U.S. megabanks are heading into Q2 earnings season on the back of a strong start to 2025. JPMorgan Chase and Citigroup delivered better-than-expected first-quarter results, supported by healthy interest income, strong trading activity, and improved cost discipline. Yet, under the surface, both management teams signaled caution—highlighting inflation, geopolitical risk, and client conservatism as emerging themes.

Let’s break down how each bank performed and what might lie ahead.


JPMorgan: Trading Desk Strength and Rate Tailwinds

JPMorgan reported Q1 net revenue of $46 billion, up 8% year-over-year, and net income of $14.6 billion, with earnings per share at $5.07, beating expectations. The strength came from two key engines:

  • Net interest income, which jumped to $23.4 billion thanks to favorable rate conditions and sustained loan growth.
  • Trading revenues, which surged 21% to $9.7 billion—fueled by a 48% jump in equities trading, a record quarter for that unit.

Investment banking fees rose 12%, signaling resilience in select M&A and debt market deals. However, credit provisions increased to $3.3 billion, suggesting a more conservative stance heading into a potentially rockier second half.

CEO Jamie Dimon struck a familiar note of pragmatism, warning about “considerable turbulence” from inflation, fiscal deficits, and geopolitical instability—even as those same forces have benefited JPM’s market-facing businesses.

Q2 Watchlist for JPM:

  • Can trading continue to outperform amid summer market activity?
  • Will loan growth in consumer and commercial lending remain resilient?
  • Are credit provisions hinting at broader credit concerns?

Citigroup: Cost Discipline and Trading Surprise

Citigroup also posted a solid Q1, with net income of $4.1 billion, up 21% from a year ago, and revenue of $21.6 billion. Earnings per share came in at $1.96, topping consensus. What stood out was the mix of trading performance and improved cost controls.

  • Markets revenue rose 12%, with equities trading jumping 23%.
  • Operating expenses declined 5%, aided by lower FDIC assessments and progress on Citi’s restructuring efforts.
  • RoTCE reached 9.1%, and the bank’s CET1 capital ratio stood at a strong 13.4%.

Still, Citi added $2.7 billion in credit provisions, increasing total reserves to $22.8 billion—a sign that management is not letting its guard down. CEO Jane Fraser struck a constructive tone, citing the U.S. economy’s relative resilience but emphasizing the need to remain cautious amid global uncertainty.

Q2 Watchlist for Citi:

  • Are cost control and digital investments delivering lasting operating leverage?
  • Will interest margins hold up if rates remain steady?
  • Can investment banking recover in a choppy macro environment?

JPMorgan vs. Citi: Diverging Strengths, Common Risks

While both banks had strong first quarters, they are navigating Q2 with different levers of strength.

Table comparing JPMorgan and Citigroup Q1 2025 performance across trading revenue, cost discipline, investment banking activity, and risk management. Highlights JPMorgan’s strength in equities trading and diversified earnings versus Citigroup’s progress in cost control and capital efficiency.

JPMorgan’s scale and diversified earnings base give it an edge in uncertain times, while Citigroup is gaining ground through cost cuts and capital efficiency. But both are facing the same headwinds: tighter client budgets, regulatory pressure, and slowing deal activity.


What to Expect in Q2 2025

Q2 earnings will likely test whether Q1 momentum is sustainable. Trading may stay strong if market volatility persists, but credit costs and weak investment banking pipelines could put pressure on profits.

Key themes to monitor:

  • Credit quality: Are rising reserves signaling trouble ahead?
  • Capital deployment: Will management remain cautious with buybacks and dividends?
  • Tech and efficiency: Are digital investments translating into real operating leverage?

Don’t overlook the earnings call commentary from Jamie Dimon and Jane Fraser—their tone will offer key signals about how megabanks view the second half of the year.


Verdict

JPMorgan remains the more defensive play, with a proven trading engine and diversified model. Citigroup is a potential turnaround story, showing credible progress on efficiency. Both face macro uncertainty, but also opportunity—especially if rate conditions stay supportive and markets remain active.

Retail investors should stay focused on margin resilience, capital trends, and credit provisioning as the next round of earnings unfolds.


Follow SWOTstock for JPMorgan and Citigroup Q2 earnings detail SWOT analysis and valuation scenarios.


Leave a comment


Why Oracle Soared While Adobe Slipped: What Diverging Stock Reactions Reveal About Investor Confidence in AI

Oracle and Adobe both beat earnings expectations, but their stocks moved in opposite directions. Discover why Oracle soared while Adobe slipped—and what it reveals about investor confidence in AI execution vs. hype.

Two enterprise tech giants—Oracle and Adobe—both reported strong quarterly results this past week. Each beat Wall Street expectations and highlighted their advancements in artificial intelligence. But the stock market reaction couldn’t have been more different:

  • Oracle stock surged +13%
  • Adobe stock declined –7%

At SWOTstock, we examined the earnings reports, management commentary, and investor sentiment. What we found illustrates a growing gap in how the market values AI strategy: it’s not about who talks the loudest—it’s about who delivers results.

Visual comparison chart of Oracle and Adobe's Q2 FY2025 earnings and AI strategies. The chart contrasts both companies across key metrics: revenue growth (+11% each), AI strategy (Oracle monetizing, Adobe uncertain), cloud momentum (Oracle’s OCI +52%), revenue visibility ($138B RPO for Oracle), and stock reaction (+13% vs. –7%). Highlights Oracle's strong execution versus Adobe’s investor skepticism.

Oracle: AI Execution Drives Confidence and Capital

Oracle’s Q4 FY2025 earnings confirmed the company’s transformation from legacy enterprise vendor to cloud-first AI infrastructure provider. Revenue climbed 11% YoY, while Oracle Cloud Infrastructure (OCI) accelerated an impressive 52%.

What truly stood out was Oracle’s $138 billion in remaining performance obligations (RPO), offering investors forward-looking visibility. With high-profile partnerships (NVIDIA, Cohere) and GenAI workloads already in production, Oracle isn’t pitching an AI future—it’s reporting on AI present.

SWOTstock Takeaway
Oracle’s strength lies in its ability to turn AI demand into revenue now—not years from now.

Key Strengths:

  • Cloud Infrastructure (OCI) grew +52% YoY
  • AI partnerships with NVIDIA and Cohere are already monetizing
  • $138B RPO provides long-term visibility and stability

Risks to Watch:

  • Continued competition from AWS, Microsoft, and Google
  • Legacy on-premise business still weighs on blended growth
Oracle SWOT analysis chart with four quadrants:

    Strengths: Strong OCI momentum, deep enterprise relationships

    Weaknesses: Slow AI service adoption, legacy business drag

    Opportunities: Expanding AI workload footprint, growing infrastructure demand

    Threats: Cloud competition from hyperscalers, changing enterprise IT spending trends

Adobe: Solid Results, But Investors Want AI ROI

Adobe’s Q2 FY2025 results were strong on the surface: 11% revenue growth, earnings beat, and raised guidance. Yet investors responded with skepticism, sending the stock down 7%.

The issue? Despite promoting new AI tools like Firefly, GenStudio, and Acrobat AI, Adobe has yet to show how these innovations will contribute meaningful revenue in the short term. Investor patience is wearing thin.

Meanwhile, competition is heating up. Canva is gaining ground in design, while OpenAI and Google are introducing productivity tools that threaten Adobe’s document business. In this environment, a premium pricing model without clear AI-driven ARR growth becomes difficult to defend.

SWOTstock Takeaway
Adobe’s innovation story is still credible, but without visible monetization, the stock is vulnerable.

Key Strengths:

  • Industry-leading suite across Creative, Document, and Experience Cloud
  • Rapid rollout of AI-powered features

Risks to Watch:

  • No clear monetization path from AI features
  • Growing threats from Canva, OpenAI, and Google
  • Pressure on margins and customer retention
SWOT analysis chart of Adobe featuring the company logo at the center. The four quadrants highlight:

    Strengths: Leading creative software suite, growing AI capabilities

    Weaknesses: High valuation concerns, reliance on Creative Cloud

    Opportunities: Expansion into diverse AI applications, enterprise software potential

    Threats: Economic uncertainty, increasing competition in creative software market

Why the Divergence?

Despite similar top-line growth, the market saw Oracle and Adobe very differently:

Table comparing Oracle and Adobe’s Q2 FY2025 earnings and market reactions. Oracle delivered +11% revenue growth, +52% OCI growth, and a $138B RPO backlog, leading to a +13% stock surge. Adobe also posted +11% revenue growth but lacked visible AI monetization and competitive defense, resulting in a –7% stock drop.

Oracle showed the market what execution looks like. Adobe reminded investors that potential alone is no longer enough.


What to Watch in the Next 6–12 Months

🔮 Oracle Outlook:
Expect continued strength if cloud growth persists and GenAI partnerships scale. RPO offers downside protection in case of macro softness.

⚠️ Adobe Outlook:
Needs to prove that AI tools are driving ARR and enterprise wins. Without that, competitive pressures may accelerate valuation compression.


Final Thoughts: AI Is Entering the Show-Me Phase

This earnings season proves that we’re past the AI hype cycle. The market is now demanding proof—measurable, monetizable traction.

At SWOTstock, we’ll keep tracking this shift as it plays out in earnings calls, product roadmaps, and valuation resets.

👉 Follow us for AI-enhanced stock insights built for growth-minded and DIY value investors.


⚠️ Disclaimer

This analysis is based on publicly available company financials, earnings call commentary, and official press releases as of June 2025. It is intended for informational purposes only and does not constitute investment advice. Always perform your own due diligence.


Leave a comment