TL;DR Summary
Microsoft (MSFT:NASDAQ) delivered another strong quarter, driven by Azure and AI demand. The key signal—AI demand exceeding capacity—confirms real enterprise adoption.
But the story is shifting. Investors are no longer asking “Is AI real?” but rather “How profitable is AI?”
At ~$425, the stock reflects confidence in growth, but not full certainty on margins. That leaves Microsoft in a high-quality, fairly valued zone—with upside tied to execution, not hype.
Quarter Recap
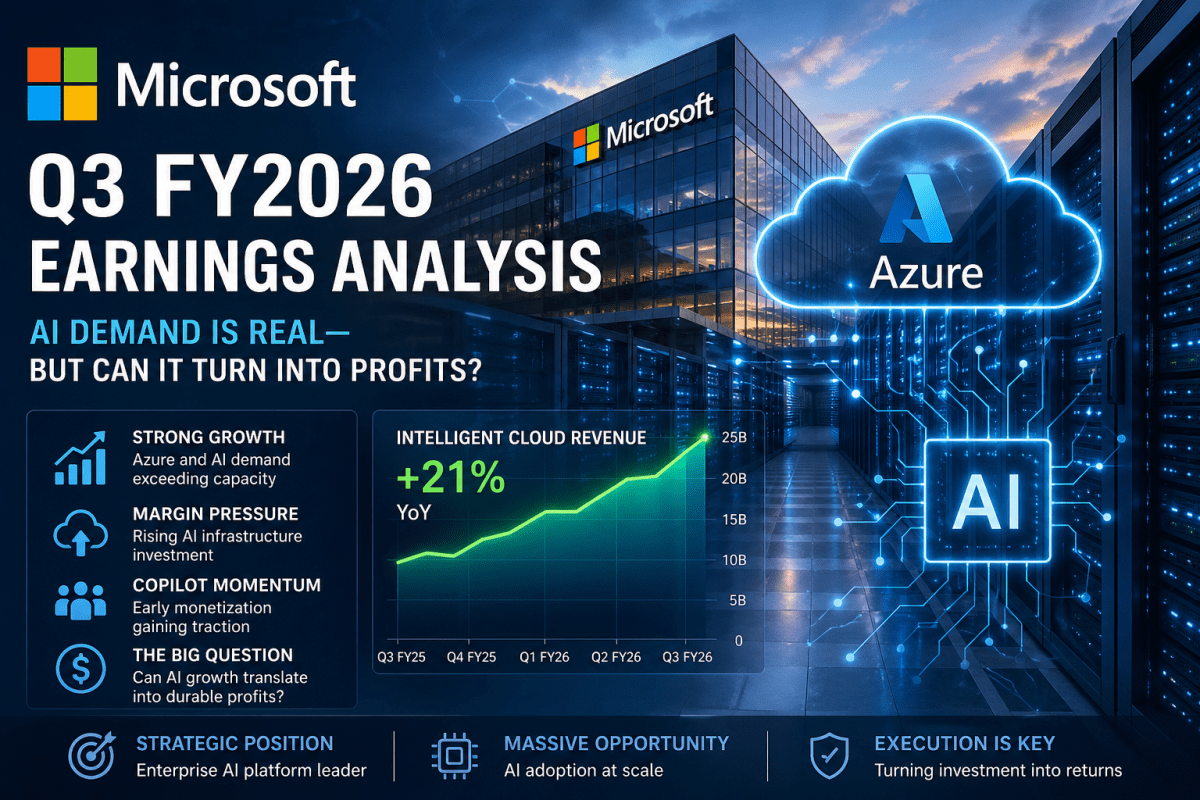
Microsoft’s Q3 FY2026 results reinforce a consistent pattern: strong growth driven by cloud and AI, paired with rising investment intensity.
Revenue growth remained robust, supported by Azure and AI services. Management highlighted that demand for AI continues to outstrip available capacity, signaling strong forward visibility. This is one of the clearest indicators that AI is not theoretical—it is already being deployed at scale.
However, the cost side of the equation is becoming more visible. Continued investment in AI infrastructure—data centers, GPUs, and networking—has started to weigh on margins. This is not a sign of weakness, but it introduces a timing gap between investment and return.
The business mix continues to shift toward Intelligent Cloud and AI-driven services, while legacy segments remain stable but secondary.
Key Highlights
Microsoft’s performance this quarter can be summarized in one sentence:
AI demand is accelerating faster than the infrastructure supporting it.
Azure remains the core growth engine, increasingly tied to AI workloads. At the same time, early monetization signals from Copilot suggest Microsoft is successfully embedding AI into enterprise workflows.
Yet the trade-off is clear. Growth is strong—but it is capital-intensive.
Market Reaction
The market response was measured rather than dramatic. After-hours trading showed a slight gain of about +0.34%, bringing the stock to around $425.89.
This tells us something important.
Investors are not reacting to short-term margin pressure. Instead, they are focusing on long-term positioning. The slight positive move suggests confidence that AI investments will eventually translate into meaningful returns.
In other words, the market is currently willing to tolerate lower margins in exchange for future growth.
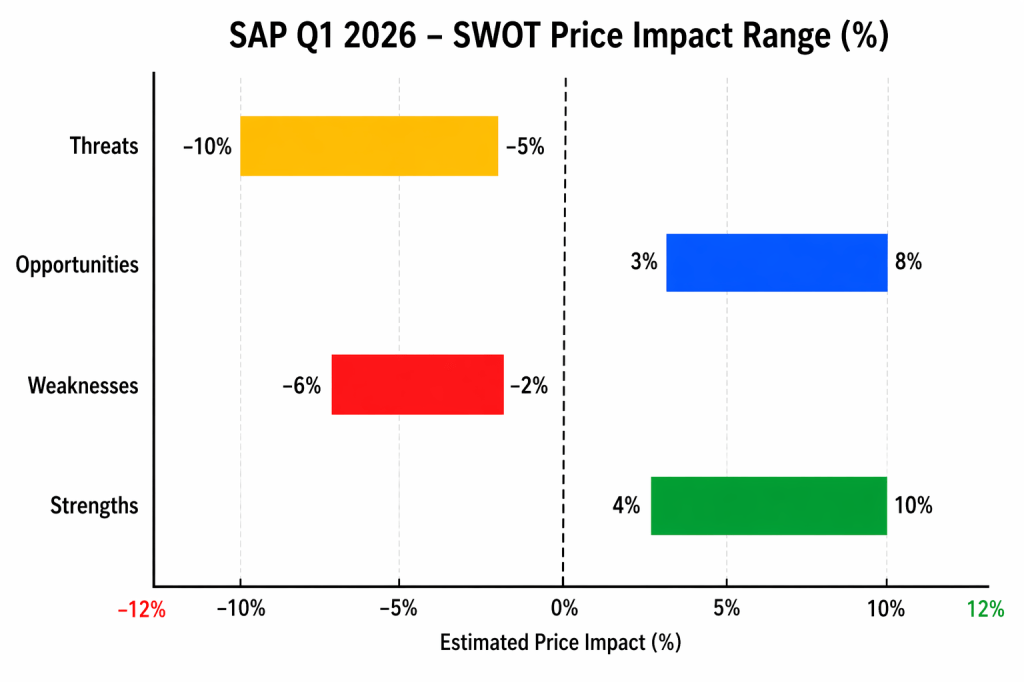
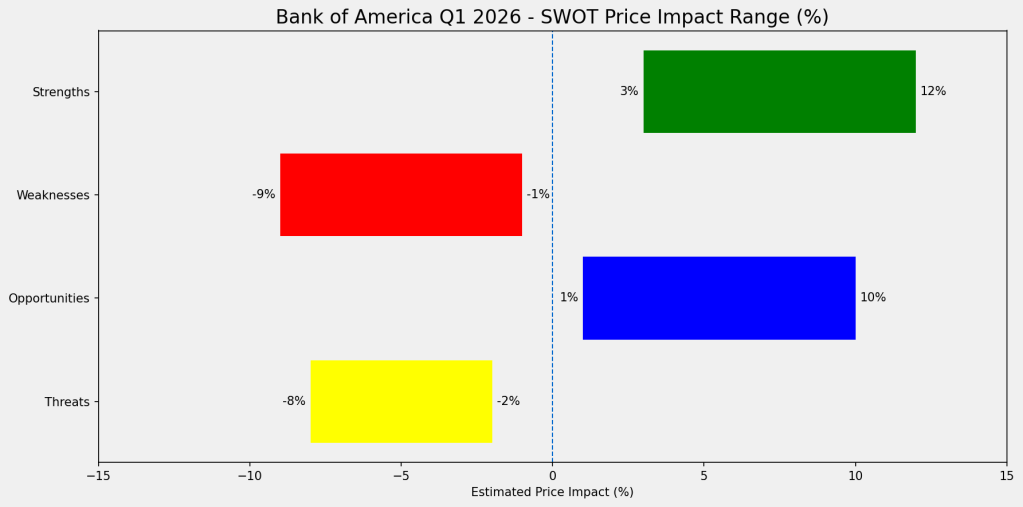
SWOT Analysis (with Price Impact Ranges)
Microsoft’s investment case now hinges on one central question:
Can AI demand be converted into durable, high-margin revenue?
Strengths
Microsoft’s strongest advantage is its position as the default enterprise AI platform. With Azure, Copilot, and deep integration into enterprise workflows, it has a clear monetization pathway that competitors struggle to replicate.
Estimated Impact: +8% to +12%
Weaknesses
The main constraint is capital intensity. AI requires sustained investment in infrastructure, creating near-term pressure on margins and delaying free cash flow realization.
Estimated Impact: -4% to -6%
Opportunities
The upside lies in scaling monetization. If AI usage translates into recurring, high-margin services—especially through Copilot and Azure—Microsoft could see both revenue acceleration and multiple expansion.
Estimated Impact: +6% to +10%
Threats
The biggest risk is economic efficiency. If AI remains expensive to operate or fails to deliver clear ROI for customers, growth could continue without corresponding profitability gains.
Estimated Impact: -5% to -8%
| Category | Driver | Price Impact |
|---|---|---|
| Strengths | AI demand + platform dominance | +8% to +12% |
| Weaknesses | Capex + margin pressure | -4% to -6% |
| Opportunities | AI monetization scaling | +6% to +10% |
| Threats | AI economics + ROI uncertainty | -5% to -8% |
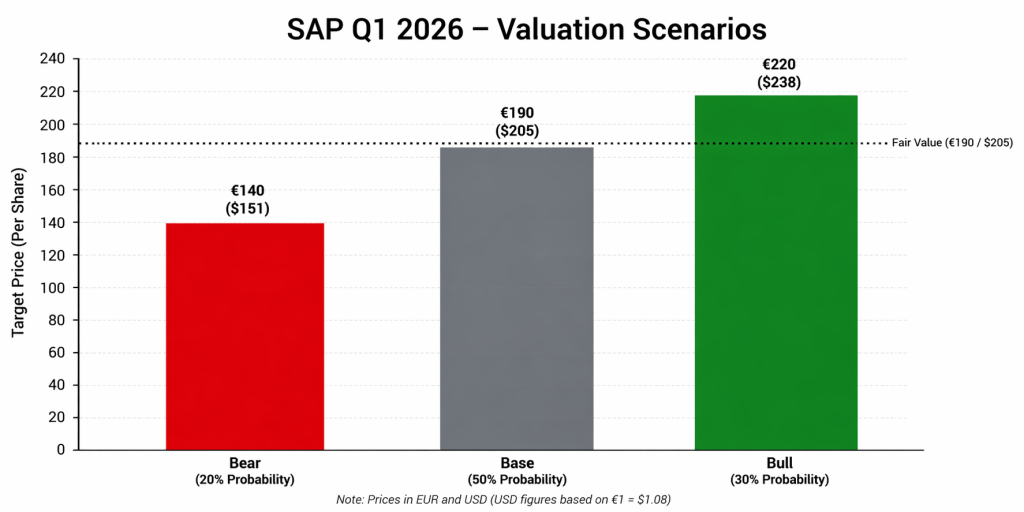
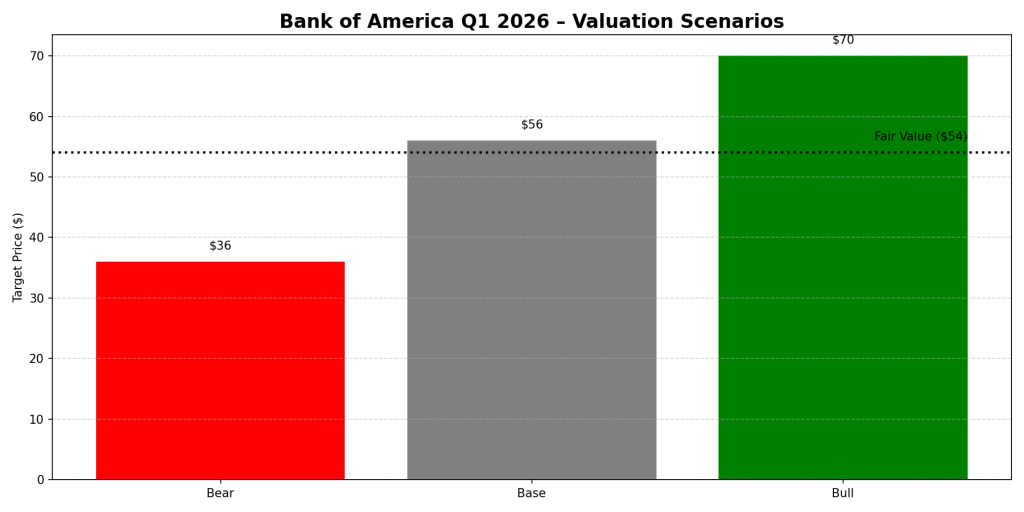
Valuation Scenarios
Microsoft’s valuation now depends less on growth and more on how efficiently that growth converts into profit.
Base Case — Gradual Monetization
AI adoption continues steadily, with margins recovering over time.
Price Range: $430 – $470
Bull Case — Strong Monetization
AI becomes deeply embedded in enterprise workflows, driving high-margin recurring revenue.
Price Range: $500 – $560
Bear Case — Growth Without Leverage
AI demand remains strong, but profitability lags due to sustained high costs.
Price Range: $340 – $380
Probability-Weighted Fair Value
Estimated fair value: ~$456
Verdict
Microsoft remains one of the strongest structural winners in AI. Its platform positioning, enterprise distribution, and early monetization signals are all real advantages.
However, at current levels, the stock already reflects much of that optimism.
The investment case is no longer about whether Microsoft will grow—it is about whether it can convert that growth into efficient, high-margin returns.
At ~$425, the stock sits in a balanced zone:
Strong business, but limited margin of safety.
Call to Action
If you’re tracking AI leaders, Microsoft should remain on your core watchlist.
The key signals to monitor next:
- Copilot adoption and pricing power
- Azure AI workload monetization
- Margin trajectory as AI scales
Follow SWOTstock for grounded, investor-focused analysis based on official company disclosures—not headlines.
Disclaimer
This content is for informational purposes only and does not constitute investment advice. Always conduct your own research before making investment decisions.