TL;DR
Oracle’s Q1 FY2027 results increasingly confirm that it is transforming from a database and enterprise software company into an AI hyperscale infrastructure company anchored by its existing database and applications franchise.
The good: OCI revenue surged 121% to $7.4 billion, total cloud revenue grew 62%, and RPO reached $664 billion. AI demand continues to exceed available supply. Importantly, customer prepayments and customer-provided infrastructure are helping finance parts of Oracle’s enormous buildout, reducing the capital risk suggested by headline capex.
The concern: Oracle is exchanging some of the attractive economics of an asset-light software business for a much more capital-intensive infrastructure model. Customer funding reduces financing risk, but it doesn’t answer the bigger question: What margins and returns on invested capital will Oracle ultimately earn from this infrastructure?
Our revised SWOT: Strengths +18% to +28%, Weaknesses -10% to -18%, Opportunities +20% to +35%, and Threats -22% to -35%.
Our valuation: Using management’s FY2027 non-GAAP EPS guidance of $8.10, we estimate Bear/Base/Bull values of $121.50 / $162 / $202.50. With probabilities of 20%/50%/30%, our probability-weighted fair value is approximately $166 per share.
Bottom line: Oracle has increasingly proven the AI demand, and customer-funded infrastructure reduces the financing concern. What Oracle hasn’t yet proven is whether becoming an AI hyperscaler will generate returns comparable to the highly attractive software economics investors historically associated with Oracle.
Oracle’s Q1 FY2027 results make one thing increasingly difficult to dispute:
Oracle is becoming a genuine AI hyperscale infrastructure company.
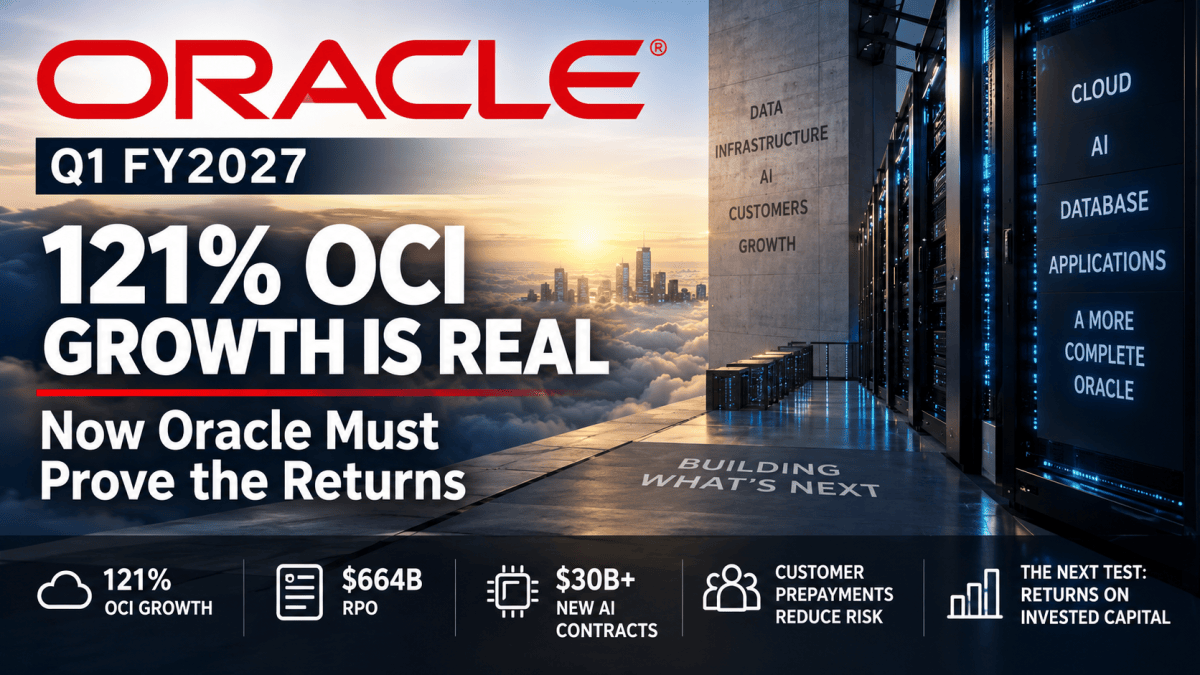
Oracle Cloud Infrastructure (OCI) revenue surged 121% year over year to $7.4 billion. Total cloud revenue reached $11.6 billion, up 62%, while Remaining Performance Obligations (RPO) climbed to $664 billion.
Oracle also booked more than $30 billion of additional AI cloud contracts during the quarter. Demand for AI training and inference continues to grow faster than available supply.
The company has delivered more than 300,000 GPUs since the end of Q4 and added approximately 850MW of data-center capacity during Q1.
The argument that Oracle’s cloud growth was merely the result of a small starting base or temporary overflow demand from other hyperscalers is becoming much harder to sustain.
But the investment question has changed.
A year ago, investors needed to determine whether Oracle could become a serious AI infrastructure provider.
Q1 provides increasingly convincing evidence that it can.
The more important question now is:
Can Oracle turn this enormous AI infrastructure business into attractive long-term returns for shareholders?
That distinction is critical because Oracle is transforming from a predominantly high-margin database and enterprise software company into something much more capital intensive.
Yet Q1 also revealed an important counterargument to the capital-risk thesis: Oracle’s customers are increasingly helping finance the infrastructure required to serve them.
That makes the Oracle story considerably more interesting.
Oracle Q1 FY2027: The Numbers That Matter
Oracle reported Q1 revenue of $19.3 billion, up 30% year over year.
Cloud revenue increased 62% to $11.6 billion.
Within cloud, however, Oracle is becoming a two-speed company.
OCI/IaaS revenue increased:
121% to $7.4 billion
Cloud Applications/SaaS increased:
10% to $4.2 billion
Meanwhile, software revenue declined 3% to approximately $5.5 billion.
Operating performance remained strong.
GAAP operating income increased 57% to approximately $6.7 billion, while non-GAAP operating income increased 31% to approximately $8.2 billion.
Non-GAAP EPS increased 30% to $1.92.
The most striking number, however, may be Oracle’s backlog.
RPO reached $664 billion, increasing by $209 billion year over year and another $26 billion since Q4.
Oracle also booked more than $30 billion of additional AI cloud contracts during Q1.
The company’s center of gravity is clearly shifting.
Oracle is no longer primarily a database and enterprise applications company that happens to operate a cloud infrastructure business.
It is increasingly becoming an AI hyperscale infrastructure company anchored by its database and enterprise applications franchise.
Oracle Is Becoming an AI Hyperscaler
Last year, there was a reasonable bearish explanation for Oracle’s rapid OCI growth.
AWS, Microsoft Azure and Google Cloud were struggling to satisfy extraordinary AI infrastructure demand. Oracle started from a much smaller infrastructure base.
Perhaps OCI was simply benefiting from capacity shortages elsewhere.
That hypothesis has weakened considerably.
OCI growth has accelerated from 55% in Q1 FY2026 to 121% in Q1 FY2027.
Oracle says demand for AI training and inference continues to grow faster than supply.
And Oracle isn’t merely signing contracts.
It is physically scaling the infrastructure necessary to deliver them.
Since Q4, Oracle has delivered more than 300,000 GPUs—nearly three times the capacity delivered during Q4 FY2026—and added approximately 850MW of data-center capacity during Q1.
This doesn’t mean Oracle will overtake AWS, Azure or Google Cloud.
It doesn’t need to.
If Oracle establishes itself as a durable fourth hyperscale infrastructure provider, the addressable opportunity could still be enormous.
Oracle’s Database and ERP Business May Be Its Biggest AI Advantage
Oracle’s transformation shouldn’t be interpreted as simply abandoning database and ERP software for infrastructure.
A more interesting strategy may be emerging:
Enterprise applications → proprietary enterprise data → AI models and agents → OCI infrastructure
Oracle already sits on one of the most valuable assets in enterprise computing: enormous quantities of mission-critical corporate data.
Its database and applications customers use Oracle systems for financial transactions, supply chains, human resources, customer information and other core business processes.
Oracle’s new AI Data Platform is intended to automatically create enterprise ontologies, allowing AI systems to understand relationships within customers’ private data and automate business processes.
This potentially connects several businesses that investors traditionally evaluated separately.
Oracle Database provides the data layer.
Fusion and NetSuite provide applications and workflows.
Oracle AI provides intelligence and agents.
OCI provides the computing infrastructure.
If Oracle can integrate these successfully, its traditional software installed base becomes a powerful distribution channel for OCI.
That would make Oracle considerably more difficult to compare with a generic GPU-hosting provider.
The $28.5 Billion Capex Number Doesn’t Tell the Whole Story
This is where the Q1 investment thesis becomes more nuanced.
Oracle generated approximately $23 billion of operating cash flow, up 184%.
Yet free cash flow remained approximately negative $5 billion because Oracle is investing extraordinary amounts of money into infrastructure.
That implies roughly $28.5 billion of gross capital expenditures during Q1.
At first glance, this appears alarming.
Oracle also completed a $20 billion common-stock ATM issuance during Q1 as part of its capital-investment program.
Looking only at those numbers could produce a straightforward conclusion:
Oracle is turning itself into a hyperscaler and putting enormous strain on its balance sheet to finance the transformation.
But that conclusion is incomplete.
A meaningful portion of Oracle’s infrastructure expansion is increasingly supported by customer prepayments, customer-provided hardware and other contractual structures.
Management has specifically explained that many of the large AI contracts added to RPO don’t require Oracle to fund the entire infrastructure requirement itself.
This changes the risk considerably.
There is a major economic difference between:
Oracle builds $20 billion of speculative AI capacity and hopes customers arrive
and:
Customers commit to long-term contracts, provide capital or hardware, and Oracle builds capacity against those commitments.
The infrastructure remains extremely capital intensive.
But Oracle’s financing burden may be substantially lower than the headline gross capex number implies.
Customer Prepayments Are More Than Financing
There is another implication.
Customer prepayments aren’t merely a financing mechanism.
They also provide additional evidence about the quality of AI demand.
Signing a long-term contract indicates customer interest.
Committing substantial capital toward the infrastructure necessary to fulfill that contract represents a considerably stronger commitment.
This strengthens the interpretation of Oracle’s enormous $664 billion RPO.
Oracle isn’t simply building infrastructure in anticipation of future AI demand.
Increasingly, it is building capacity against contracted demand.
That reduces one of the most important risks in our previous Oracle thesis.
Demand risk is falling.
Financing risk is also falling.
But another risk remains.
Financing Risk and Economic-Return Risk Are Not the Same Thing
This distinction may now be the most important part of the Oracle investment thesis.
Customer prepayments help answer:
Who pays to build the infrastructure?
They don’t necessarily answer:
What return will Oracle earn from operating it?
Oracle could successfully build enormous amounts of capacity, fulfill its $664 billion backlog and generate spectacular revenue growth.
But if AI compute becomes increasingly commoditized, infrastructure pricing falls or customers gain greater bargaining power, Oracle could still earn lower returns on its invested capital than investors expect.
This matters because the business Oracle is transforming from had unusually attractive economics.
Database software and support can produce substantial recurring cash flow with relatively modest incremental capital requirements.
Hyperscale infrastructure requires data centers, GPUs, networking equipment, power, cooling and continuous hardware replacement.
Oracle could therefore become a much larger and faster-growing company while simultaneously becoming a business with structurally lower returns on capital.
That is now the central investment risk.
Oracle SWOT Analysis After Q1 FY2027
Strengths: Estimated +18% to +28% Price Impact
Oracle has substantially strengthened its position as a credible AI infrastructure provider.
OCI revenue increased 121%, cloud revenue increased 62%, and RPO reached $664 billion.
Demand continues to exceed supply.
Customer prepayments and customer-provided infrastructure also strengthen Oracle’s ability to scale without financing every dollar of infrastructure itself.
Meanwhile, Oracle’s database and enterprise applications franchise provides a potential competitive advantage unavailable to pure infrastructure providers.
If Oracle successfully connects enterprise data, AI agents and OCI infrastructure, it could create considerable customer stickiness.
Weaknesses: Estimated -10% to -18% Price Impact
Oracle is still moving from relatively asset-light software economics toward much more capital-intensive infrastructure economics.
Q1 gross capex was approximately $28.5 billion, while free cash flow remained negative despite record operating cash flow.
Cloud Applications grew only 10%, while software revenue declined 3%.
The weakness, however, is less severe than the headline capex figure initially suggests.
Customer prepayments and other funding structures mean Oracle isn’t necessarily financing the entire AI buildout itself.
The weakness is therefore better characterized as:
Extreme gross capital intensity, partially mitigated by customer-funded infrastructure structures.
Opportunities: Estimated +20% to +35% Price Impact
Oracle’s opportunity has expanded substantially.
OCI growth accelerated rather than slowed.
Oracle could establish itself as a durable fourth hyperscale AI infrastructure provider without needing to displace AWS, Azure or Google Cloud.
More importantly, Oracle could combine infrastructure with its existing database and applications ecosystem.
If enterprise AI increasingly requires access to proprietary corporate data, Oracle’s enormous installed base could become a significant competitive advantage.
The AI Data Platform potentially strengthens this opportunity by connecting enterprise data, ontologies, AI agents and OCI compute.
Threats: Estimated -22% to -35% Price Impact
The biggest threat is increasingly return on invested capital rather than demand or financing.
AI compute could become commoditized.
Infrastructure prices could decline.
Customers could gain bargaining power.
Competition from AWS, Azure, Google Cloud and other infrastructure providers could pressure margins.
Oracle could therefore successfully fulfill enormous AI contracts while still producing lower economic returns than its historical software business.
There is also increasing concentration risk whenever very large infrastructure contracts represent significant portions of future revenue.
The $664 billion RPO is enormously valuable only if Oracle converts that backlog into profitable revenue at attractive returns on capital.
Oracle Valuation: Bull, Base and Bear Scenarios
Oracle expects FY2027 revenue of at least $90 billion and non-GAAP EPS of approximately $8.10.
Because current free cash flow is heavily distorted by the infrastructure construction cycle, FY2027 EPS provides a more useful near-term valuation anchor.
Bear Case — $121.50
Oracle’s AI demand remains strong, but infrastructure economics ultimately disappoint.
Applying 15x FY2027 EPS:
$8.10 × 15 = $121.50
Probability: 20%
Base Case — $162
Oracle converts its AI backlog successfully and establishes OCI as a durable hyperscale infrastructure platform, but capital intensity limits the valuation multiple.
Applying 20x FY2027 EPS:
$8.10 × 20 = $162
Probability: 50%
Bull Case — $202.50
Oracle demonstrates that hyperscale growth can coexist with attractive returns, while its database and applications ecosystem differentiates OCI from commodity compute.
Applying 25x FY2027 EPS:
$8.10 × 25 = $202.50
Probability: 30%
Revised Oracle Fair Value: Approximately $166
Probability weighting produces:
Bear: $121.50 × 20% = $24.30
Base: $162 × 50% = $81.00
Bull: $202.50 × 30% = $60.75
Probability-weighted fair value: approximately $166 per share.
The increase from our previous $162 estimate isn’t driven by higher OCI growth.
It reflects our revised assessment that customer-funded infrastructure reduces Oracle’s financing risk.
What Growth Investors Should Watch Next
Going forward, investors should focus less on whether Oracle can generate AI demand—it clearly can—and more on whether it can convert that demand into attractive economics.
The critical indicators are OCI growth, RPO conversion, free cash flow recovery and ultimately return on invested capital.
OCI growth tells us whether Oracle is delivering the infrastructure.
RPO tells us whether future demand remains strong.
Free cash flow tells us when today’s investment begins producing cash.
But ROIC ultimately tells us whether Oracle’s transformation is actually creating shareholder value.
Investment Takeaway
Oracle’s Q1 FY2027 results materially strengthen the AI investment thesis.
OCI growing 121%, RPO reaching $664 billion, demand exceeding supply and customers increasingly helping finance infrastructure make Oracle look increasingly like a genuine AI hyperscaler rather than a secondary beneficiary of temporary capacity shortages.
That changes the risk profile.
Demand risk has fallen.
Financing risk has fallen.
But economic-return risk remains.
Our probability-weighted fair value is approximately $166 per share.
Oracle has increasingly proven that it can become an AI hyperscaler.
Now it has to prove that becoming one is as attractive for shareholders as it is impressive for revenue growth.
Disclaimer
This article is for informational and educational purposes only and does not constitute investment advice, financial advice or a recommendation to buy or sell any security.
Valuation scenarios and estimated price impacts are analytical estimates based on assumptions and are inherently uncertain. Investors should conduct their own research and consider their objectives, financial circumstances and risk tolerance before making investment decisions.