
📌 TL;DR Summary
Wells Fargo and Bank of America both posted stronger-than-expected earnings in Q1 2025. While Wells impressed with EPS growth and aggressive buybacks, Bank of America showed strength in trading and is set to raise its dividend after stress test success. With Q2 reports around the corner, we break down the key takeaways—and what to watch next.
🧾 Q1 2025 Recap: Wells Fargo vs. Bank of America
As U.S. megabanks prepare to release Q2 2025 results, let’s look back at how Wells Fargo (WFC) and Bank of America (BAC) performed last quarter.
🏦 Wells Fargo (WFC)
- Earnings per share (EPS): $1.39 vs. $1.23 expected (+13%)
- Revenue: $20.15B vs. $20.82B expected (–3.3%)
- Net margin: 16.2%
- Return on equity (ROE): 12.1%
- Dividend: $0.40/share (≈1.94% annualized yield)
- Buybacks: Massive $40B repurchase program authorized
Despite missing slightly on revenue, Wells beat earnings expectations thanks to expense control and solid lending margins. The $40B buyback plan signals strong capital confidence.
🏛 Bank of America (BAC)
- EPS: $0.90 vs. $0.80 expected (+12.5%)
- Revenue: $27.37B vs. $26.83B expected (+2.0%)
- Net margin: 14.6%
- ROE: 10.25%
- Dividend: $0.26/share (≈2.1% annualized yield)
BAC benefited from strong trading revenue—marking its 13th straight quarter of growth—but faced headwinds in investment banking. Still, a favorable Fed stress test result has cleared the way for a Q3 dividend hike to $0.28/share.
📊 Side-by-Side Snapshot

🔭 Q2 2025 Earnings Preview
Wells Fargo
- Expected EPS: ~$1.41
- Expected Revenue: ~$20.83B
- Date: Tuesday, July 15, 2025, before market open
Watch for updates on loan growth, expense discipline, and the execution of the buyback plan.
Bank of America
- Expected EPS: ~$0.89–$0.90
- Expected Revenue: ~$26.8B
- Date: Monday, July 14, 2025, before market open
(Investor Q&A: Wednesday, July 16, 8:00 a.m. ET)
Keep an eye on the impact of trading momentum vs. falling investment banking fees. Dividend guidance and capital return will also be key.
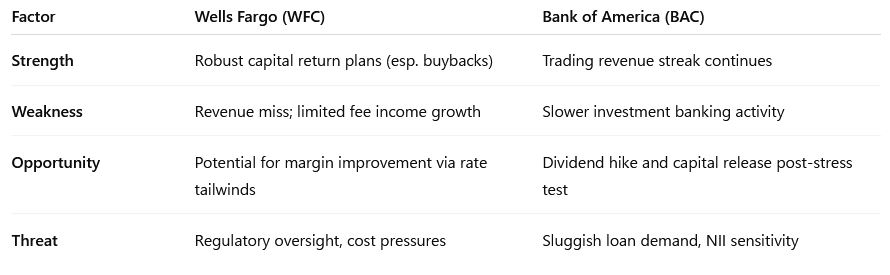
🔍 SWOT Highlights (Q1 2025)
🧠 Final Take
Both banks outperformed earnings expectations last quarter, but took different paths to get there. Wells is doubling down on capital returns, while Bank of America is leaning into its strength in markets. With the Fed’s rate trajectory still uncertain and loan growth slowing, Q2 may give clearer signals on how each bank is navigating the environment.
📅 Stay Tuned
- 📈 BAC Q2 earnings: July 16, 2025
- 📊 WFC Q2 earnings: July 15, 2025
We’ll cover each report in detail the moment they drop.
📣 Call to Action
🔔 Want the Q2 earnings breakdown the moment it’s out?
Subscribe or follow us on LinkedIn for real-time recaps and price impact commentary.
⚠️ Disclaimer
This post is for informational purposes only and does not constitute financial advice. Always do your own research or consult a licensed advisor before making investment decisions.


Leave a comment