Bank of America Q2 2026 Earnings Analysis: Strong Core Banking Franchise Supports Higher Fair Value

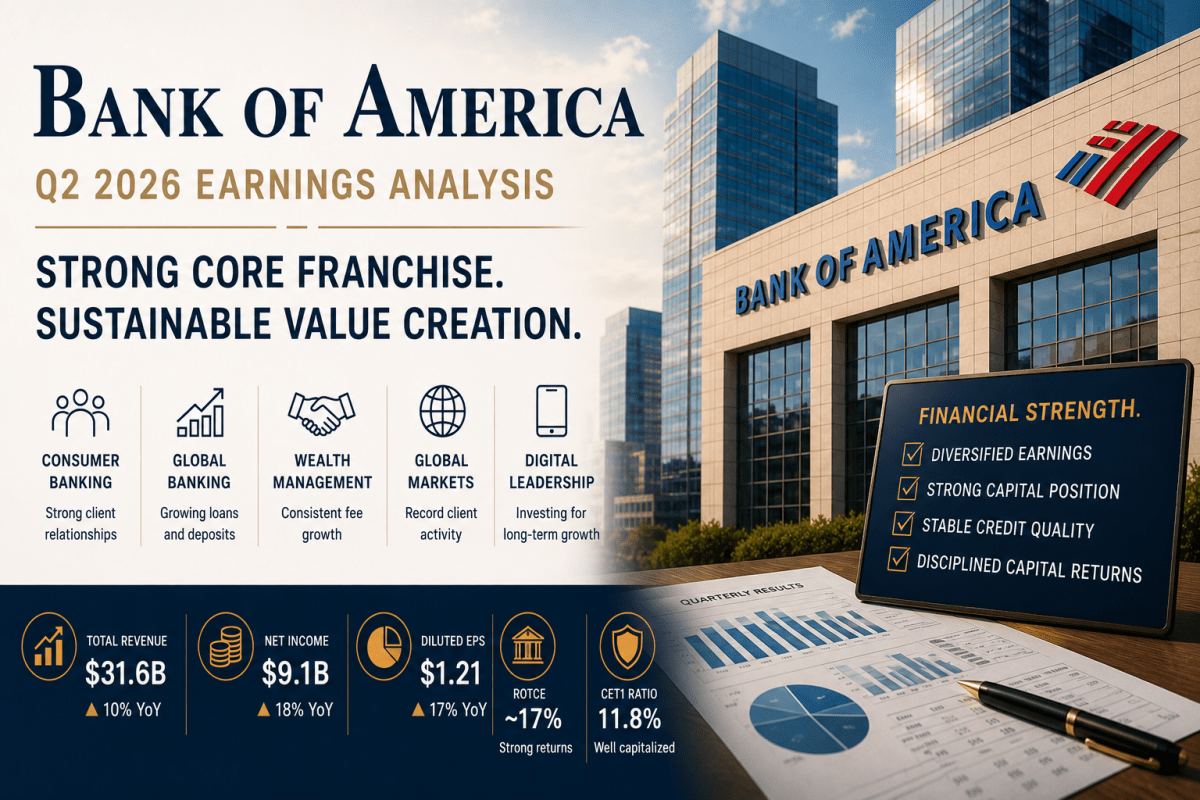
Bank of America reported a robust second quarter with revenues of $31.6 billion and net income of $9.1 billion, reflecting strong performance across its diverse business segments. Despite initial market caution, the company’s earnings stability and growth in net interest income suggest long-term resilience. The estimated fair value of shares is approximately $64.

TL;DR Summary

Bank of America (BAC:NYSE) delivered an impressive second quarter, reporting strong revenue and earnings growth driven by broad-based contributions across Consumer Banking, Wealth Management, Global Banking, and Global Markets. More importantly, the company’s core banking franchise continued to strengthen through growing net interest income, stable credit quality, and robust capital generation.

While the market initially reacted cautiously before the shares recovered during the trading session, our independent analysis suggests the quarter reinforced the long-term investment thesis rather than fundamentally changing it. We estimate a probability-weighted fair value of approximately $64 per share, indicating the stock is modestly undervalued but not yet a “fat pitch.”


Quarter Recap

Bank of America reported another strong quarter that highlighted the resilience of its diversified business model. Revenue reached $31.6 billion, while net income increased to $9.1 billion, resulting in diluted earnings per share of $1.21.

Unlike quarters where performance depends heavily on one business segment, Q2 demonstrated strength across multiple earnings engines. Consumer Banking continued to benefit from healthy client activity, Wealth Management generated steady fee income, Global Banking experienced improved commercial engagement, and Global Markets delivered strong client-driven trading results.

Perhaps more importantly for long-term investors, management reaffirmed confidence in net interest income growth and reported stable credit quality, suggesting that the company’s earnings strength extends beyond short-term market activity.


Key Highlights

  • Revenue increased to $31.6 billion.
  • Net income reached $9.1 billion.
  • Diluted EPS increased to $1.21.
  • Net interest income continued to grow, with management expecting full-year results toward the upper end of previous guidance.
  • ROTCE remained around 17%, demonstrating efficient capital utilization.
  • Consumer and commercial credit quality remained stable.
  • Capital ratios continued to support dividends, share repurchases, and future growth investments.

SWOT Analysis

Bank of America’s latest quarter reinforces the strength of one of the largest banking franchises in the United States. The company continues to benefit from a diversified earnings base, disciplined capital management, and a stable deposit franchise. However, banking remains inherently cyclical, and investors should continue monitoring interest rates, credit quality, and economic conditions.

Strengths

  • Diversified earnings franchise (+8% to +12%)
    • Strong contributions from Consumer Banking, Wealth Management, Global Banking, and Global Markets reduce dependence on any single business segment.
  • Growing core net interest income (+6% to +10%)
    • Continued NII growth reinforces the recurring earnings power of the core banking business.
  • Excellent profitability and capital efficiency (+5% to +8%)
    • ROTCE around 17% demonstrates strong returns on shareholder capital.
  • Strong capital position (+3% to +6%)
    • Healthy capital supports continued dividends, share repurchases, and resilience during economic downturns.
  • Stable credit quality (+2% to +5%)
    • No evidence of broad-based deterioration in the loan portfolio.

Weaknesses

  • Interest-rate sensitivity (-6% to -10%)
    • Future earnings remain influenced by changes in interest rates and deposit pricing.
  • Cyclical capital markets businesses (-4% to -8%)
    • Trading and investment banking revenues naturally fluctuate with market conditions.
  • Moderate long-term growth profile (-3% to -6%)
    • As a mature banking franchise, growth is expected to remain steady rather than rapid.

Opportunities

  • Continued investment banking recovery (+5% to +9%)
    • Improved corporate activity could further expand fee income.
  • Digital banking and AI productivity (+4% to +7%)
    • Ongoing technology investments should improve efficiency while strengthening customer relationships.
  • Higher shareholder returns (+3% to +6%)
    • Strong capital generation creates additional flexibility for dividends and share repurchases.

Threats

  • Economic slowdown and higher credit losses (-8% to -15%)
    • A recession would reduce loan demand while increasing credit costs.
  • Margin compression from lower interest rates (-6% to -10%)
    • Lower net interest income would reduce recurring earnings.
  • Regulatory changes (-3% to -7%)
    • Higher capital requirements could reduce future returns on equity.

Valuation Scenarios

Although Q2 demonstrated strong operating momentum, valuation should reflect both the quality of the franchise and the cyclical nature of banking. Rather than assuming today’s earnings represent either a permanent peak or a temporary anomaly, we evaluate three possible scenarios.

Bear Case — $52 (25%)

Assumes weaker net interest income, softer capital markets activity, modestly higher credit costs, and a lower valuation multiple.

Base Case — $64 (50%)

Assumes stable net interest income, healthy credit quality, continued profitability, and valuation multiples consistent with historical norms.

Bull Case — $74 (25%)

Assumes sustained earnings growth, continued strength across multiple business segments, accelerating shareholder returns, and modest valuation expansion.

Probability-Weighted Fair Value

Combining these scenarios produces a probability-weighted fair value of approximately $64 per share.


Verdict

Bank of America continues to demonstrate why it remains one of the highest-quality banking franchises in the United States. Its diversified earnings base, strong deposit franchise, disciplined capital allocation, and healthy balance sheet provide resilience across different economic environments.

Importantly, this conclusion is based primarily on the company’s official financial disclosures rather than market narratives or analyst opinions.

Following the earnings release, the market initially responded cautiously before the shares recovered later in the trading session. Our independent assessment suggests that investors ultimately recognized the quality of the quarter while continuing to evaluate the sustainability of future earnings.

At current prices, Bank of America appears modestly undervalued relative to our estimated intrinsic value of approximately $64 per share. While the valuation is attractive for long-term investors, it does not yet provide the wide margin of safety typically associated with a “fat pitch.”


Call to Action

Did you reach the same conclusion after reading Bank of America’s earnings report?

Do you believe the market is correctly valuing the company’s long-term earnings power, or is there still upside that investors have yet to recognize?

Share your thoughts in the comments, and follow SWOTstock for independent earnings analysis based on official company disclosures rather than market consensus.


Disclaimer

This article is intended for educational and informational purposes only and should not be considered financial advice or a recommendation to buy or sell any security. The analysis is based primarily on Bank of America’s official financial disclosures and management commentary, supplemented by independent valuation reasoning. Investors should conduct their own research and consider their individual financial circumstances before making investment decisions.
Citigroup Q1 2026 Earnings: The Turnaround Is Showing — But Is the Stock Already There?

TL;DR Summary

Citigroup (C:NYSE) delivered a strong quarter, with revenue up 14% and net income up 42%, showing real progress in its turnaround.

The stock responded positively — but at current levels, much of that improvement may already be priced in.

For value investors, Citi is no longer a deep discount. It’s now an execution story.


Quarter Recap

Citi’s Q1 2026 results were strong across the board, and importantly, not just in one area.

Revenue came in at $24.6 billion, up 14% year-over-year, while net income reached $5.8 billion. Earnings per share hit $3.06, supported by both improved operations and continued buybacks.

The strength was driven by Citi’s core institutional businesses. Services continued to deliver steady growth, while Markets saw a strong rebound, particularly in equities trading. These higher-quality businesses are increasingly shaping the bank’s earnings profile.

At the same time, weaker areas remain. U.S. Consumer Cards saw profits decline, and credit costs are beginning to normalize, which could become a headwind.


Market Reaction

The stock moved from around $126 before earnings to about $129.6 after, a gain of roughly 2.6%. It opened higher, traded up during the day, and held most of those gains into the close.

That kind of price action typically signals that investors not only reacted positively to the results, but also found them credible enough to hold positions rather than sell into strength.


Key Highlights

Citi’s strongest asset remains its Services business, which continues to generate stable growth and high returns.

Markets also delivered a strong quarter, showing Citi can still compete globally in trading, especially during periods of volatility.

Capital return is another key pillar. Citi repurchased $6.3 billion of stock in just one quarter, reinforcing the investment case.

On the other hand, consumer credit remains an area to watch, with declining profits in cards and rising signs of stress in credit metrics.


SWOT Analysis (with Price Impact Ranges)

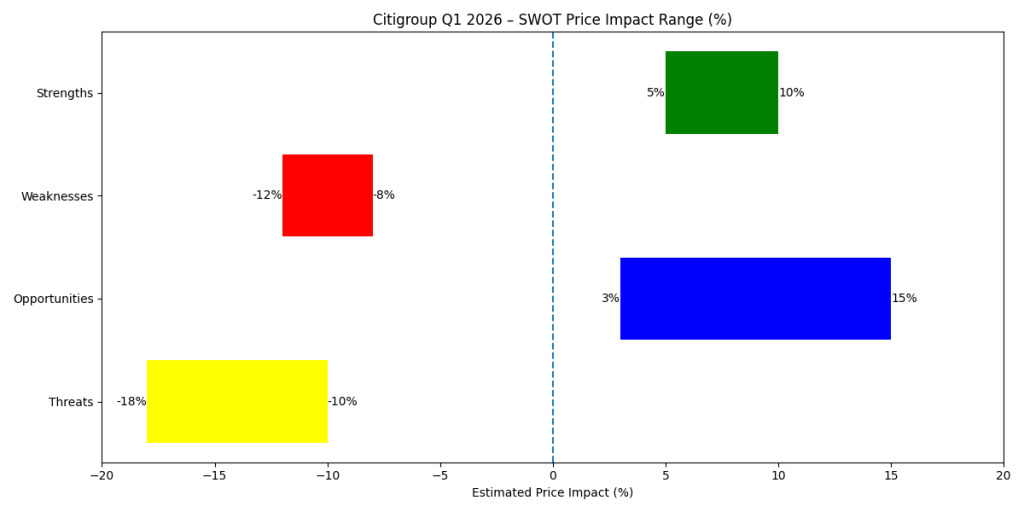
Citi today sits at an interesting point — the business is clearly improving, but the stock is increasingly reflecting that improvement. The following ranges show how each factor could influence valuation.


Strengths

Citi’s biggest strength is the growing contribution from its higher-quality businesses.

The Services franchise continues to deliver strong, stable returns, and as it becomes a larger part of the mix, it can lift overall profitability. At the same time, aggressive share buybacks are supporting earnings per share and helping anchor the stock. Markets also contributed meaningfully this quarter.

👉 Estimated upside impact: +5% to +10% (Services mix improvement)

👉 +4% to +8% (buybacks support)

👉 +3% to +6% (Markets strength, cyclical)


Weaknesses

Despite the progress, Citi still trails the best-performing banks in terms of overall profitability, which limits how much investors are willing to pay for the stock.

Costs remain elevated due to ongoing transformation efforts, and consumer banking — particularly credit cards — continues to face pressure as credit costs normalize.

👉 Estimated downside impact: -8% to -12% (profitability gap vs peers)

👉 -4% to -7% (cost inefficiency)

👉 -3% to -6% (consumer credit pressure)


Opportunities

The biggest opportunity lies in execution. Citi is nearing the end of its transformation program, and meaningful cost improvements could significantly boost returns.

If Citi can sustain higher returns on equity, the market may be willing to re-rate the stock closer to or above book value. Continued buybacks also provide an additional tailwind.

👉 Estimated upside impact: +10% to +18% (cost transformation)

👉 +8% to +15% (RoTCE expansion and re-rating)

👉 +3% to +6% (balance sheet growth)


Threats

The main risks are tied to the credit cycle and the sustainability of recent performance.

Credit quality is starting to show early signs of deterioration, and Markets revenue — while strong this quarter — can be volatile. There is also ongoing execution risk, as Citi still needs to prove that its turnaround is durable.

👉 Estimated downside impact: -10% to -18% (credit deterioration)

👉 -5% to -9% (Markets normalization)

👉 -6% to -10% (execution risk)

Citigroup Q1 2026 SWOT analysis chart showing estimated stock price impact ranges: strengths (+5% to +10%) and opportunities (+3% to +15%) on the positive side, and weaknesses (−12% to −8%) and threats (−18% to −10%) on the negative side, with a zero reference line.
Citigroup Q1 2026 SWOT analysis: Upside is driven by Services strength and ongoing transformation, while downside risks stem from credit deterioration and earnings volatility in Markets.

Valuation Scenarios

Citi’s valuation still anchors to its tangible book value of around $99 per share. The key variable is how much return the bank can generate on that capital.


Bear Case (30% probability)

In a downside scenario, credit costs rise and Markets normalize, pushing returns closer to ~10%.

In this case, Citi would likely trade below book value, around 0.9x TBV.

👉 Target Price: ~$90


Base Case (50% probability)

In a more balanced scenario, Citi continues to execute steadily, maintaining returns around 11–12% and delivering gradual efficiency improvements.

This would justify a valuation closer to 1.2x TBV.

👉 Target Price: ~$120


Bull Case (20% probability)

In a stronger execution scenario, Citi successfully improves efficiency and sustains higher returns (13–14%+), leading to a re-rating.

This could push valuation toward 1.5x TBV.

👉 Target Price: ~$150


Probability-Weighted Fair Value

Blending these scenarios results in a fair value of approximately:

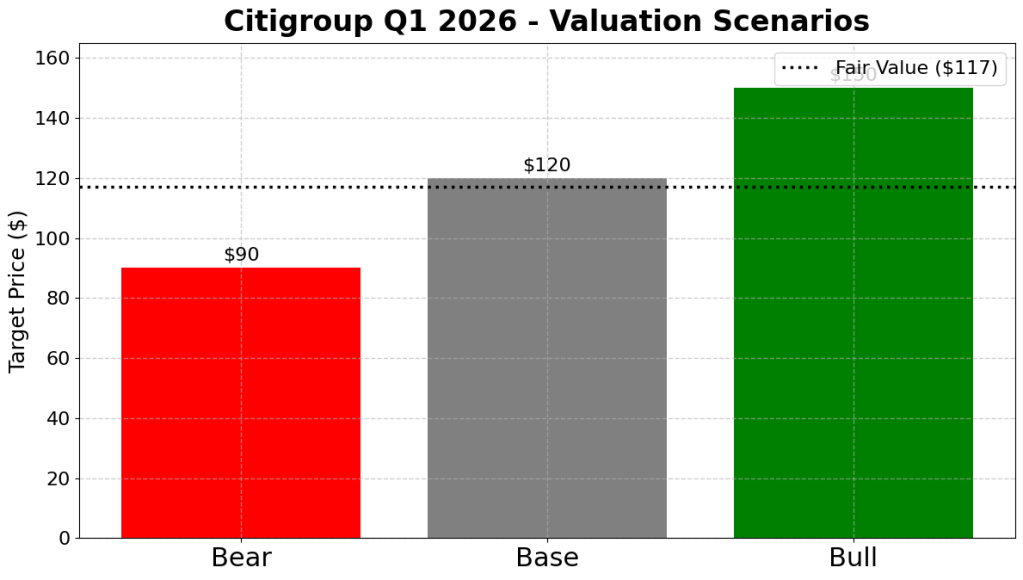
👉 ~$117 per share

Citigroup Q1 2026 valuation scenarios chart showing bear case at $90, base case at $120, and bull case at $150, with a probability-weighted fair value line at $117.
Citigroup valuation scenarios: The stock’s upside depends on sustained execution, with a base case of $120 and a fair value of $117, suggesting limited margin of safety at current levels.

Verdict

Citi is clearly making progress. The latest results show that the turnaround is real and gaining traction.

But the stock has already moved ahead of that improvement.

At around $130, Citi is trading above what a probability-weighted valuation would suggest. That means investors are no longer buying a discount — they are betting on continued execution.


Call to Action

For value investors, the key question is simple:

👉 Would you buy Citi today, knowing that the upside depends on continued strong execution?

Or would you wait for a pullback to get a better margin of safety?


Disclaimer

This article is for informational purposes only and does not constitute investment advice. All analysis is based on publicly available information from Citigroup’s official financial disclosures. Investors should conduct their own research before making any investment decisions.

JPMorgan Q1 2026 Earnings: A Near-Perfect Quarter… So Why Isn’t the Stock Breaking Out?

JPMorgan Chase had a strong Q1 2026, reporting $5.94 EPS and around $50B revenue, driven by record Markets performance and a rebound in investment banking. Despite the impressive results, stock movement was modest as investors focused on sustainability over performance. Fair value is estimated around $200, with mixed future outlooks.

TL;DR Summary

JPMorgan Chase (JPM:NYSE) just delivered a standout Q1 2026, with $5.94 EPS, ~$50B revenue, and record Markets performance. Investment banking is rebounding, credit remains under control, and the balance sheet is exceptionally strong. Yet the stock only moved modestly. That tells you everything: investors are no longer pricing performance — they’re pricing how sustainable this level of earnings is. Fair value now sits around $200.


Quarter Recap

JPMorgan’s Q1 2026 results were strong across nearly every line item. The bank reported $16.5 billion in net income and $5.94 in EPS, supported by $50.5 billion in managed revenue. This was not a narrow beat — it was broad-based strength across consumer banking, investment banking, and trading.

Markets delivered a record $11.6 billion in revenue, while investment banking fees surged 28%, signaling a real recovery in capital markets activity. At the same time, Net Interest Income reached $25.5 billion, still benefiting from the prior rate environment.

Despite the strong numbers, management — led by Jamie Dimon — maintained a balanced tone. The U.S. economy remains resilient, but the forward path depends on interest rates, credit conditions, and broader macro dynamics.


Key Highlights

  • EPS: $5.94 → near peak earnings level
  • Managed revenue: $50.5B → broad-based growth
  • Markets revenue: $11.6B (+20%) → record performance
  • Investment banking fees: +28% → recovery gaining traction
  • NII: $25.5B (+9% YoY), but +3% ex-Markets → growth slowing underneath
  • Credit costs: $2.5B → rising but still controlled
  • CET1 ratio: 14.3% → strong capital buffer

SWOT Analysis

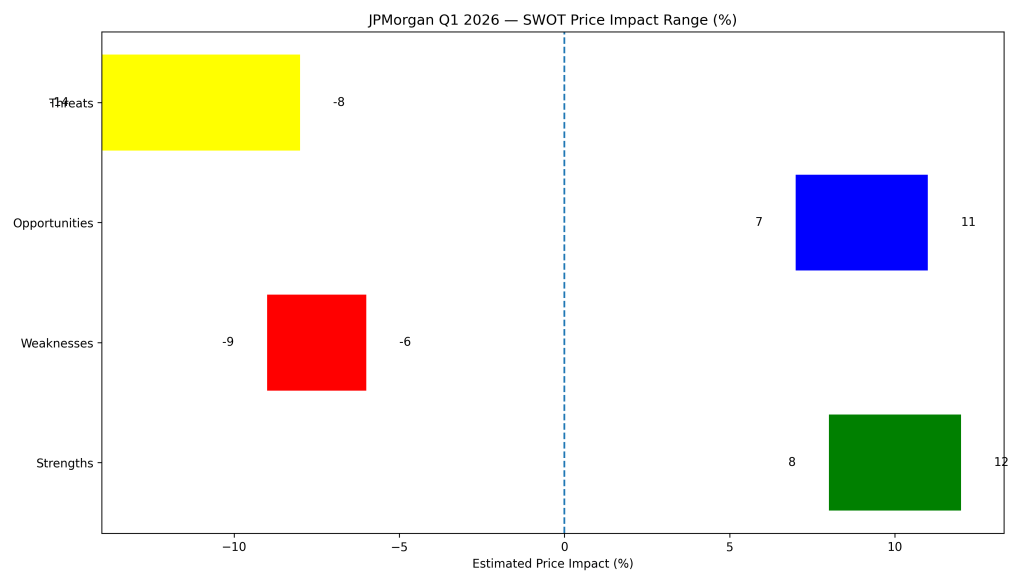
JPMorgan just delivered one of its strongest quarters — but that’s exactly why the bar is now higher. The debate has shifted from performance to durability.


Strengths

  • Record Markets revenue ($11.6B) confirms trading leadership→ Estimated impact: +8% to +12%
  • Broad-based growth across all major segments (CIB +19%, CCB +7%, AWM +11%)→ Estimated impact: +6% to +9%
  • Strong capital position (CET1 14.3%, $291B capital)→ Estimated impact: +5% to +8%

Weaknesses

  • NII growth slowing beneath the surface (+3% ex-Markets)→ Estimated impact: -6% to -9%
  • High cost base ($26.9B expenses) limits operating leverage→ Estimated impact: -3% to -5%
  • Continued sensitivity to interest rate direction→ Estimated impact: -4% to -7%

Opportunities

  • Investment banking recovery (+28% fees) could extend over multiple quarters→ Estimated impact: +7% to +11%
  • Strong client activity and capital markets momentum→ Estimated impact: +4% to +7%
  • Capital return (buybacks + dividends) supports valuation→ Estimated impact: +5% to +8%

Threats

  • Credit normalization ($2.5B credit costs, rising charge-offs)→ Estimated impact: -8% to -14%
  • Regulatory pressure on capital requirements→ Estimated impact: -4% to -7%
  • Earnings peak risk as cycle normalizes→ Estimated impact: -6% to -10%

Valuation Scenarios

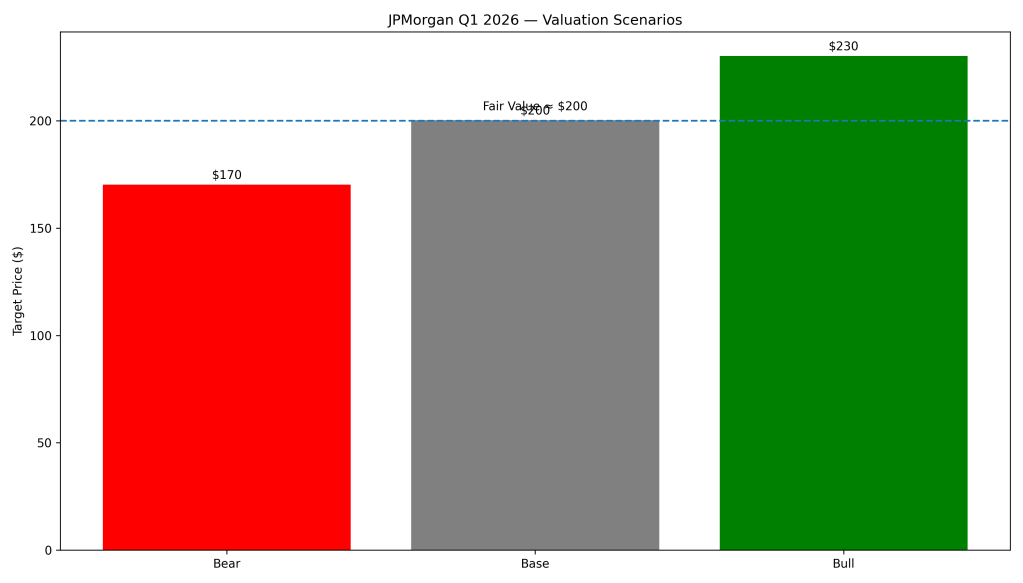
The key question is simple: is $5.94 EPS a new baseline — or a cyclical peak?


Bear Case — $170

  • NII declines as rates fall
  • Credit costs rise further
  • Markets revenue normalizes

Base Case — $200

  • NII softens but remains elevated
  • IB recovery offsets part of the decline
  • Credit increases gradually

Bull Case — $230

  • Markets stay strong longer
  • IB recovery accelerates
  • Credit remains benign

Fair Value

👉 Probability-weighted fair value: ~$200/share


Verdict

JPMorgan remains the highest-quality bank in the market — and this quarter proves it. But quality is no longer the question. Sustainability is.

At current levels, the stock looks fairly valued. The upside case requires near-perfect conditions to persist, while the downside emerges if credit costs rise and NII declines at the same time.

For value investors, this is not a chase — it’s a stock to accumulate on weakness.


Call to Action

Would you buy JPMorgan below $180 if credit risks start to rise?

Or do you believe its earnings power justifies holding through the cycle?

👉 Follow SWOTstock for grounded, data-driven earnings analysis.


Disclaimer

This article is for informational purposes only and does not constitute financial advice. Investors should conduct their own research and consider their risk tolerance before making investment decisions.