Berkshire Hathaway Q1 2025: Patience, Profit, and $189 Billion in Cash

In Q1 2025, Berkshire Hathaway reported a 7.9% decline in operating earnings to $8.48 billion and a substantial $11.2 billion in unrealized losses. However, with $189 billion in cash, the firm remains financially robust. Analysts suggest BRK.B is overvalued, trading around 21.3% above estimated fair value.

Q1 2025 Highlights: What Investors Need to Know

Berkshire Hathaway (NYSE: BRK-A, BRK-B)posted lower operating earnings and unrealized investment losses in Q1 2025, but its balance sheet has never been stronger. With $189 billion in cash and minimal debt, Buffett’s firm is in prime position for future moves—just not in a rush to make them. Despite short-term softness, long-term upside remains, and the stock may be modestly undervalued.


Quarter Recap

In the first quarter of 2025, Berkshire Hathaway reported operating earnings of $8.48 billion, a 7.9% decline year-over-year, reflecting mixed performance across its key segments. Insurance underwriting weakened, GEICO remained under pressure, and BNSF Railway delivered flat results. Meanwhile, investment income benefited from higher interest rates on Treasury holdings.

Buffett and his team remained firm in their philosophy: act only when the odds are overwhelmingly in their favor. Despite a sizable unrealized investment loss of $11.2 billion for the quarter, largely due to equity market fluctuations, they emphasized long-term discipline and capital strength.

One line captures the essence of the quarter: “Better to hold cash than chase risk.”


Key Highlights

  • Operating Earnings: $8.48B (–7.9% YoY)
  • Net Earnings: $(11.2)B (driven by unrealized investment losses)
  • Insurance Underwriting Profit: $1.16B (–19% YoY)
  • Cash and Treasury Holdings: $189B (record high)
  • BNSF Railway Earnings: Flat YoY
  • Interest Income from T-Bills: Estimated $7.5–8B annualized

SWOT Analysis

Let’s break it down using the simple SWOT framework—what’s going well, what’s not, where the upside is, and what risks could derail the story.

Strengths (Estimated Impact: +30 to +50 USD/share)

Berkshire Hathaway’s greatest strength this quarter lies in its unrivaled financial flexibility. With $189 billion in cash and Treasury holdings, minimal debt, and stable earnings from insurance, utilities, and BNSF Railway, the company maintains a defensive yet opportunistic posture. Its insurance float continues to be a low-cost source of funding, while interest income alone now contributes nearly $8 billion annually at minimal risk. This level of capital strength supports a premium valuation multiple and provides built-in downside protection. If investors continue rewarding this structural advantage, these strengths could add $30 to $50 per share to Berkshire’s valuation.

Weaknesses (Estimated Impact: –15 to –20 USD/share)

The downside in this quarter comes from persistent softness in GEICO underwriting, which remains below peer performance despite years of restructuring. Insurance profits fell 19% year-over-year, while BNSF’s earnings were flat due to freight volume stagnation and inflationary pressure. In addition, Berkshire’s manufacturing and retail units—exposed to consumer cyclicality—continue to underwhelm. These underperforming segments may weigh on consolidated earnings growth and investor sentiment, potentially reducing fair value by $15 to $20 per share if they fail to rebound over the next several quarters.

Opportunities (Estimated Impact: +35 to +45 USD/share)

The most compelling upside comes from Berkshire’s ability to deploy capital. With markets remaining volatile, Berkshire is uniquely positioned to act during dislocations. Even without a major acquisition, its Treasury yield is now a legitimate earnings driver, supporting operating income with near-zero risk. In addition, the orderly CEO succession to Greg Abel appears to be progressing well, boosting investor confidence in the post-Buffett era. If Berkshire begins putting even a fraction of its cash to work in high-return assets, and if market sentiment improves around capital efficiency, the stock could gain $35 to $45 per share in valuation upside.

Threats (Estimated Impact: –25 to –30 USD/share)

However, risks remain. Unrealized equity investment losses totaled $11.2 billion in Q1, raising concerns over market volatility and concentration in large holdings like Apple. Succession optics—while stable—still carry narrative risk if markets test Berkshire’s leadership. Moreover, macroeconomic headwinds such as a slowdown in U.S. freight or tighter regulation on insurance operations could strain profitability. If equity markets falter or earnings growth continues to slow, the downside from these threats could weigh $25 to $30 per share on the stock, particularly if investors shift toward faster-growth alternatives.

SWOT Summary


Valuation Scenarios (BRK.B)

Bull Case – $470/share (25% probability)

In the most optimistic scenario, Berkshire deploys a meaningful portion of its $189B cash into high-return investments, insurance underwriting improves across GEICO and reinsurance segments, and its equity portfolio—especially large tech holdings—rebounds strongly. Interest income continues contributing ~$8B annually, lifting operating earnings. If normalized earnings rise and the market awards a 17x multiple (reflecting premium safety and compounding potential), BRK.B could trade at $470. This assumes both smart capital allocation and a favorable macro backdrop, and we assign it a 25% probability.

Base Case – $420/share (60% probability)

The base case assumes Berkshire maintains steady performance: insurance earnings stabilize, BNSF and energy divisions grow modestly, and equity marks remain flat. Interest income boosts baseline earnings, but no major acquisitions occur in the near term. We estimate operating earnings around $35B, applying a conservative 15x multiple in line with historical norms. This results in a $420 valuation. Given Buffett’s cautious stance and consistent fundamentals, we assign this scenario the highest probability at 60%.

Bear Case – $360/share (15% probability)

In the downside scenario, insurance losses persist, equity markets underperform, and Berkshire delays deploying its excess capital, weighing on return on equity. If investment losses continue and operating income weakens due to economic headwinds, the stock could be re-rated at a 12x multiple. This implies a $360 valuation. While Berkshire’s balance sheet offers downside protection, market overreaction or leadership transition sentiment could push shares lower, justifying a 15% probability for this outcome.

Probability-Weighted Valuation

(420 × 0.6) + (470 × 0.25) + (360 × 0.15) = 252 + 117.5 + 54 = $423.50


Verdict: Is BRK.B Overvalued?

  • Current Price (May 9, 2025): $513.74
  • Estimated Fair Value: $423.50

Conclusion:
At ~21.3% above fair value, BRK.B appears overvalued based on company fundamentals and risk-weighted scenarios. The current price reflects investor confidence—but may leave little room for error or near-term upside.


Call to Action

Want simple stock breakdowns like this in your inbox?
Subscribe now and get the next big-name earnings decoded—before the headlines do.


Disclaimer

This post is based solely on Berkshire Hathaway’s official Q1 2025 financial report and shareholder meeting transcript. No third-party commentary or external data was used. This is not investment advice. Please do your own research before making investment decisions.



Leave a comment


Amazon Q1 2025 Financial Result : Is This the Breakout Year for the Tech Giant?

Amazon’s Q1 2025 earnings reveal strong momentum, with revenue at $143.3 billion, and operating income doubling to $18.4 billion, largely due to AWS’s growth. However, retail faces margin pressures and international uncertainty. Investing in AI and infrastructure may bolster future prospects, but global risks and competition remain significant concerns for investors.

Amazon Q1 2025: What Retail Investors Should Know

Amazon just released its Q1 2025 earnings, and the company is showing some serious momentum. But for everyday investors, the real question is: what do these numbers actually mean for the stock—and for your portfolio?

Let’s walk through the key takeaways using a simple SWOT analysis based only on Amazon’s official earnings report and call with investors.

Strengths: Profits Are Back in a Big Way

Amazon had a very strong quarter. Revenue came in at $143.3 billion, up 13% from last year. More importantly, operating income more than doubled to $18.4 billion. That’s a sign the business isn’t just growing—it’s becoming more efficient.

Amazon Web Services (AWS), its cloud business, is leading the charge. It grew 17% to $25 billion and is expected to hit $100 billion in annual revenue soon. The company is also making the most of its ad business, which brought in over $11 billion this quarter. These high-margin segments are helping Amazon shift from a low-margin retailer into a tech-driven profit machine.

Weaknesses: Retail Still Has Its Limits

Despite all the good news, Amazon’s core retail business is still facing margin pressure. It’s growing, but not as profitably as AWS or ads. International sales are particularly tricky. With a strong U.S. dollar and geopolitical tensions, overseas profits are being squeezed.

And while logistics improvements are helping with delivery speed, they’re also expensive. Rising fulfillment costs and higher wages continue to be a drag on retail profitability.

Opportunities: AI and Automation Are the Future

Amazon’s leadership made it clear: AI is at the center of everything. From Alexa to its internal logistics systems, Amazon is investing heavily in making its operations smarter. These investments aren’t just about shiny new products—they’re meant to cut costs, speed up delivery, and improve customer experience.

The company is also rolling out new data centers to support generative AI and high-performance computing. These infrastructure investments could position AWS to dominate the next wave of enterprise technology.

Threats: Global Risks and Policy Changes

On the risk side, there’s the possibility of rising U.S.–China tensions. If tariffs are reintroduced or expanded, Amazon could face higher costs—especially since many third-party sellers rely on goods from China.

The other major concern is consumer demand. While things are strong now, any slowdown in the U.S. economy or a dip in consumer spending could hit Amazon’s retail and ad businesses hard. On top of that, competition from Walmart, Shopify, and others isn’t letting up.

What Does This Mean for the Stock?

Amazon’s stock is currently trading around $190.20 (as of May 1, 2025). Based on different scenarios, that’s right around fair value. In a bullish case, where AI drives real operating leverage and AWS continues to grow faster than expected, the stock could rise to $205. In a steady, base-case scenario, we see it hovering closer to $195. But if macro risks materialize or cloud growth cools off, it could fall to around $180—or possibly lower if trade tensions worsen.

Overall, Amazon’s Q1 2025 report shows a company firing on multiple cylinders, especially in the high-margin parts of its business. For long-term investors, it remains one of the most dominant and innovative companies in the world. But it’s also important to keep an eye on rising costs and geopolitical uncertainty.

If you’re thinking about buying or holding Amazon shares, this may be a good moment to assess your confidence in its AI and cloud future—and your comfort with some short-term bumps along the way.


Disclaimer: This post is for informational purposes only and does not constitute investment advice. Always do your own research or speak with a financial advisor before making investment decisions.


One response to “Amazon Q1 2025 Financial Result : Is This the Breakout Year for the Tech Giant?”

  1. Uber Q1 2025 Earnings: Strong Profits, Bold Plans, But Is the Stock Price Getting Ahead of Itself? – SWOT Stock – Smart Investing Made Simple Avatar

    […] check out our recent breakdowns of Amazon Q1 2025, Meta Q1 2025, and Alphabet Q1 2025 for more actionable […]

    Like

Leave a comment

Meta Q1 2025 Earnings: AI Surge, Profit Growth—But Is META Stock Fully Priced In?

Meta’s Q1 2025 results highlight a 16% revenue increase to $42.31 billion and a 35% rise in net income, reaching $16.64 billion. User growth in Meta AI and Threads was substantial, with over 1 billion and 350 million users, respectively. Despite high capital expenditures and losses in Reality Labs, the stock seems fairly valued at $572.

TL;DR – Meta’s Growth Story Looks Real, But the AI Payoff Is What Matters Now

Meta (NASDAQ: META) reported a solid quarter with double-digit revenue and profit growth, driven by strong platform engagement and early momentum from its AI rollout. The company is investing heavily in infrastructure and innovation—but faces growing pressure to turn those investments into monetized outcomes. At current levels, the stock looks reasonably valued, with upside if AI and Threads translate into durable revenue streams.


Quarter Recap – A Strong Start to 2025, Anchored in AI and Efficiency

Meta kicked off 2025 with a confident earnings report, signaling both financial strength and strategic clarity. Total revenue rose 16% year-over-year to $42.31 billion, while net income surged 35% to $16.64 billion, reflecting higher operating efficiency. The company’s operating margin improved to 38%, up from 33% a year ago—an encouraging sign that Meta is scaling profitably even while reinvesting in growth.

The core theme from the earnings call was unmistakable: AI is no longer an R&D project—it’s central to Meta’s product strategy. CEO Mark Zuckerberg emphasized that Meta AI is now integrated across major platforms like Instagram, WhatsApp, and Messenger, reaching nearly 1 billion monthly active users. Meanwhile, Threads—Meta’s challenger to X—is building momentum with 350 million MAUs and a growing developer toolkit.

But the quarter wasn’t without friction. Capital expenditures were sharply revised upward, and losses in Reality Labs continue to weigh on sentiment. Still, the overall tone from management was forward-looking, emphasizing long-term platform value and leadership in AI infrastructure.


Meta Earnings: Key Financial Highlights

  • Revenue: $42.31B (+16% YoY)
  • Net income: $16.64B (+35% YoY)
  • Operating margin: 38%
  • Capital expenditures: $13.69B in Q1; FY forecast raised to $64–$72B
  • Meta AI monthly users: ~1 billion
  • Threads monthly active users: 350M+
  • Reality Labs operating loss: $4.2B
Line chart showing Meta Platforms' revenue, net income, and capital expenditures over five quarters through Q1 2025

Meta AI and Threads: User Growth Trends

Meta AI and Threads have shown strong user adoption over the past five quarters. Meta AI reached nearly 1 billion users, while Threads surpassed 350 million.

Meta AI and Threads user growth chart from Q1 2024 to Q1 2025 showing rising engagement across platforms

SWOT Analysis – Strong Execution, but Investors Want Monetization

Let’s step back and view Meta’s quarter through a SWOT lens to understand the moving pieces—from execution strengths to the potential tailwinds and risks that will shape the stock’s next leg.

Bar chart displaying estimated stock price impact of Meta’s strengths, weaknesses, opportunities, and threats

Strengths

Meta continues to deliver where it counts—profitable growth, improving margins, and user scale. The integration of Meta AI across its family of apps shows real traction, and early signals from Threads are stronger than many expected. The financial discipline underpinning the quarter suggests Meta can maintain performance even amid heavy reinvestment.

💰 Price impact estimate:
If current execution continues and AI traction sustains, this could support a +15 to +20 point uplift in the share price over the next few quarters.


Weaknesses

Despite the strong fundamentals, Meta’s CapEx trajectory is drawing scrutiny. The company is now forecasting $64B–$72B in 2025 capital spending, largely tied to AI infrastructure and custom silicon development. That’s a massive commitment—one that only pays off if monetization follows. Meanwhile, Reality Labs posted another $4.2B loss, with no clear commercial wins in sight. Lastly, advertising remains ~96% of total revenue, making the business model sensitive to economic cycles.

📉 Price impact estimate:
These structural weaknesses could cap near-term valuation expansion by –$5 to –$10 if they persist without clearer returns.

Opportunities

The biggest catalyst on the horizon is AI monetization. Meta has multiple vectors to pursue: consumer-facing AI assistants, developer APIs built on Llama 3, ad personalization powered by real-time inference, and an open-source AI ecosystem that could challenge OpenAI’s and Google’s closed models. Threads could also evolve into a standalone growth engine, particularly if Meta builds a differentiated ad product for it.

🚀 Upside potential:
If even part of this vision materializes, we could see +25 to +40 points added to fair value estimates.

Threats

As Meta’s influence in AI and digital infrastructure grows, so does regulatory attention. The EU’s Digital Markets Act and FTC scrutiny in the U.S. remain open fronts, and legal action could impact product features, data policy, or monetization timelines. At the same time, competition is intensifying—Google, OpenAI, Apple, and Microsoft are all doubling down on AI, each with unique strengths. Add in macro risk (a pullback in ad spend, for example), and Meta’s story becomes more fragile than the numbers might initially suggest.

⚠️ Risk estimate:
If multiple threats crystallize at once, the stock could decline by –$20 to –$30 per share from current levels.

SWOT summary table for Meta Q1 2025 earnings, showing strengths (+15 to +20 impact), weaknesses (–5 to –10), opportunities (+25 to +40), and threats (–20 to –30), with notes on AI scale, CapEx, monetization, and regulatory risks.

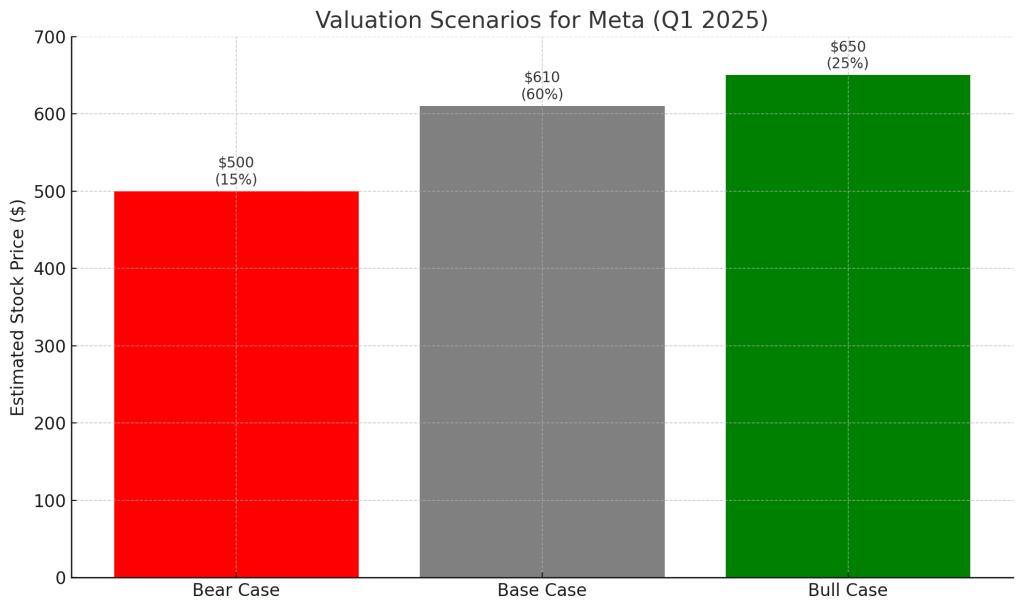
META Stock Valuation Forecast: Bull, Base, and Bear Cases

Based on Q1 data and forward guidance, here are potential outcomes for Meta’s stock price:

Bar graph showing Meta’s stock price forecast under base, bull, and bear case scenarios for Q1 2025

Base Case (60% Probability)

  • Continued margin strength, stable ad growth
  • Fair Value Estimate: $610

Bull Case (25% Probability)

  • AI monetization and Threads acceleration exceed expectations
  • Valuation: $650

Bear Case (15% Probability)

  • Weak AI ROI, regulatory pressure, margin compression
  • Valuation: $500

Weighted Average Valuation: (610 × 0.6) + (650 × 0.25) + (500 × 0.15) = $602.5


Is Meta Stock Fairly Valued After Q1 2025?

Meta’s Q1 2025 performance is robust, showing both operational strength and ambitious long-term vision. With strong engagement metrics and margin expansion, the stock appears fairly valued to slightly undervalued at $572. Risks remain, especially around spending and monetization, but Meta’s scale and pace of innovation provide a long growth runway.


Stay Informed: Subscribe for More Stock Insights

Want clear, data-driven stock insights with no fluff? Follow @SWOTstock and subscribe to our blog for simple breakdowns of every major earnings season.


Disclosure and Research Policy

This analysis is based solely on Meta’s Q1 2025 earnings report and official company call transcript. It is not financial advice. Please do your own research before making investment decisions.


2 responses to “Meta Q1 2025 Earnings: AI Surge, Profit Growth—But Is META Stock Fully Priced In?”

  1. NVIDIA Q1 FY2025: AI Boom Powers Revenue—but Is the Stock Already Fully Priced? – SWOT Stock – Smart Investing Made Simple Avatar

    […] check out our recent breakdowns of AMD Q1 2025, Palantir Q1 2025, Meta Q1 2025 and Alphabet Q1 2025 for more actionable […]

    Like

  2. Uber Q1 2025 Earnings: Strong Profits, Bold Plans, But Is the Stock Price Getting Ahead of Itself? – SWOT Stock – Smart Investing Made Simple Avatar

    […] check out our recent breakdowns of Amazon Q1 2025, Meta Q1 2025, and Alphabet Q1 2025 for more actionable […]

    Like

Leave a comment