

🚀 TL;DR – Earnings Solid, Outlook Raised, But Street Unconvinced
Salesforce (NYSE: CRM) delivered on many fronts in Q1 FY26: strong free cash flow, a raised full-year outlook, and impressive AI momentum with over $1B in annualized AI revenue. Yet the market reaction was subdued. Shares slipped ~3% post-earnings as investors weighed modest growth against growing acquisition dependency. For long-term investors focused on enterprise AI, the current pullback may offer an attractive re-entry point — but execution risk remains high.
📊 Quarter Recap – Cash-Rich, AI-Forward, But Investors Ask: What’s Next?
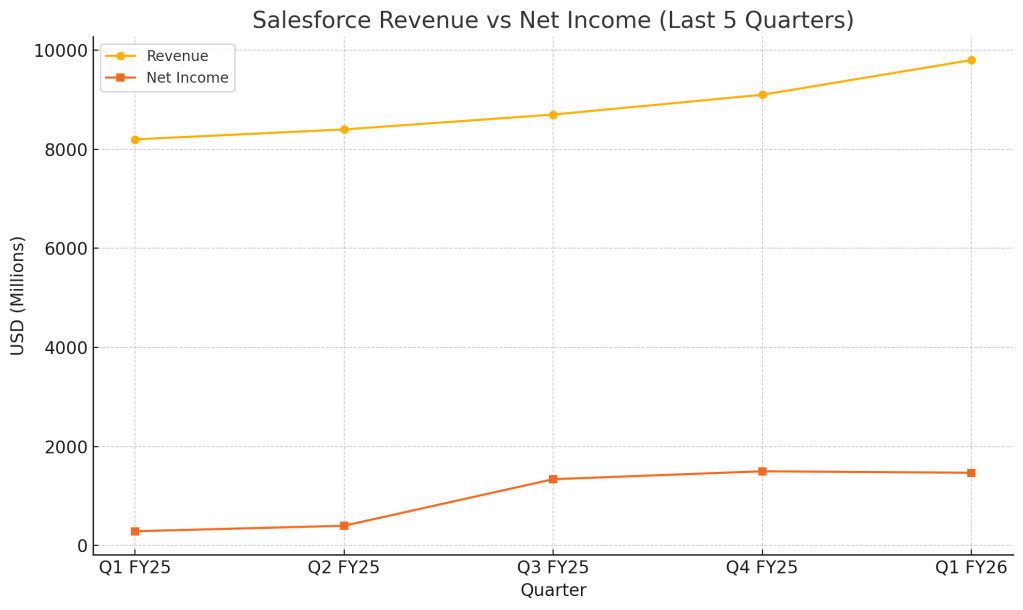
Salesforce reported Q1 FY26 revenue of $9.8 billion, reflecting 8% growth year-over-year. The company continues to demonstrate financial discipline, posting a 32.3% non-GAAP operating margin and generating $6.3 billion in free cash flow — a key metric that reinforces the strength of its subscription-based business model.
However, the earnings story wasn’t just about operational metrics. Management spent considerable time during the call highlighting Salesforce’s evolving identity as an AI-first enterprise software provider. The AI and Data Cloud segment reached a milestone of over $1 billion in annualized recurring revenue, up 120% from the prior year. Additionally, Agentforce — the company’s AI-powered sales assistant platform — closed over 8,000 deals, with 50% of them already monetized.
Despite these advancements, investor enthusiasm appeared tempered. Salesforce also unveiled its intention to acquire Informatica in a transaction valued at over $8 billion. While the strategic rationale centered on data integration and platform expansion, some investors viewed it as a sign that organic AI monetization remains in its early innings.
📌 Key Highlights
(📌 Visual Placeholder: Q1 FY26 Metrics Snapshot)
- Revenue: $9.8B (+8% YoY)
- Subscription & Support Revenue: $9.3B (+8% YoY)
- Non-GAAP Operating Margin: 32.3%
- Free Cash Flow: $6.3B (+4% YoY)
- AI & Data Cloud ARR: $1B+ (+120% YoY)
- Agentforce Deals: 8,000+ closed, 50% paid
- Shareholder Return: $3.1B (including $2.7B in buybacks)
- FY26 Guidance: Revenue raised to $41–41.3B, EPS to $11.27–11.33
🧠 SWOT Analysis – Is Salesforce Building Sustainable AI Moats?
(📊 Visual Placeholder: Horizontal Bar Chart – SWOT Price Impact Ranges)
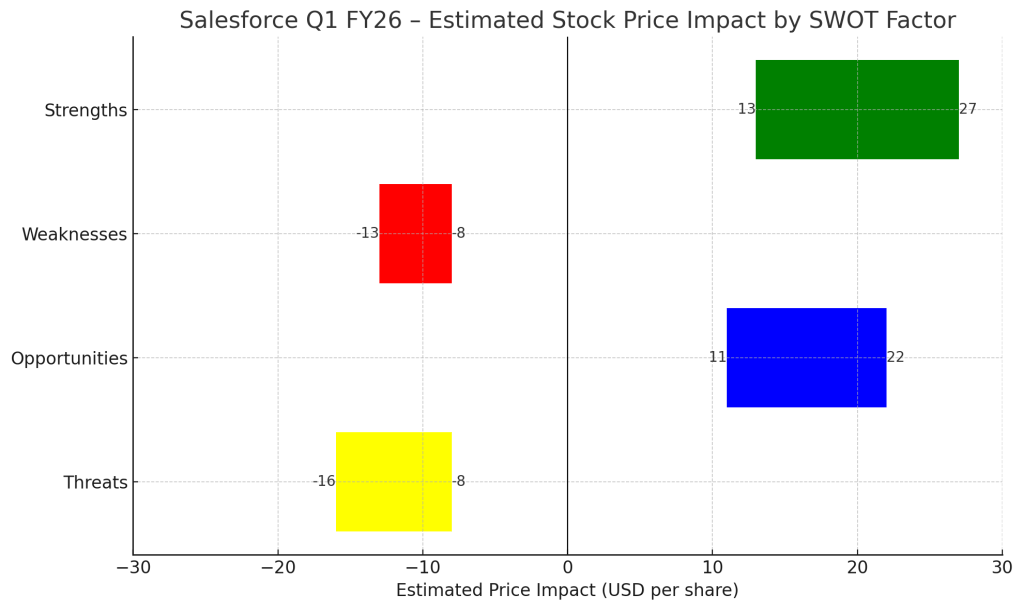
To evaluate Salesforce’s trajectory, we use a SWOT framework — layering qualitative insight with quantitative impact ranges to assess where the stock could go next.
✅ Strengths
Salesforce’s high-margin business continues to generate substantial cash, supporting both R&D and shareholder returns. With a 32.3% non-GAAP operating margin and $6.3B in quarterly free cash flow, the company remains financially resilient. Meanwhile, the $1B+ in AI annual recurring revenue — up 120% year-over-year — signals that the firm’s early bets on generative AI are beginning to materialize.
Estimated Price Impact: +5% to +10% ($13–27)
⚠️ Weaknesses
At 8% year-over-year growth, revenue is expanding — but not at a pace that excites growth-focused investors. Combined with an $8B acquisition of Informatica, some view the quarter as a reminder that Salesforce still leans heavily on M&A for platform expansion. This can dilute long-term returns if integration is poorly executed or if synergy realization takes longer than anticipated.
Estimated Price Impact: –3% to –5% ($8–13)
🌱 Opportunities
The most obvious upside lies in the scaling of Agentforce and global AI deployment. Management noted that over 8,000 Agentforce deals were signed, with paid conversion already at 50%. On top of that, international expansion — particularly in Japan, the UK, and Canada — could provide incremental growth via cross-product bundling and new verticals.
Estimated Price Impact: +4% to +8% ($11–22)
🧨 Threats
Salesforce is not immune to macroeconomic uncertainty. Should enterprise IT budgets tighten further, even AI-led offerings could face delayed adoption. Add to that the integration risk tied to Informatica, and the bear case begins to take shape. Investors have seen how difficult it can be to maintain focus and cost discipline amid large-scale acquisitions.
Estimated Price Impact: –3% to –6% ($8–16)
📋 SWOT Summary Table

📐 Valuation Scenarios – Realistic Upside, But No Easy Wins

🟢 Bull Case – Target: $320 (Probability: 30%)
A best-case scenario assumes Salesforce executes flawlessly: Agentforce expands rapidly, international AI rollouts outperform, and Informatica is integrated smoothly. In this case, margin expansion and top-line acceleration could support a price of $320.
⚫ Base Case – Target: $290 (Probability: 50%)
In a more measured scenario, AI and cloud revenue continue to build gradually while macro headwinds and integration friction create a modest drag. Here, the valuation rests on steady execution — not breakout success.
🔴 Bear Case – Target: $260 (Probability: 20%)
The bear case includes a slower-than-expected AI ramp, growing customer budget constraints, and post-acquisition inefficiencies. Margins may hold, but revenue growth could fall short.
Weighted Fair Value:
(0.3 × $320) + (0.5 × $290) + (0.2 × $260) = $293
🔍 Peer Comparison – Where Salesforce Stands in the AI-Enterprise Cloud Race

While Salesforce has made impressive strides in monetizing AI, investors are right to compare its positioning against other enterprise software giants. Let’s take a closer look at how Salesforce stacks up against Microsoft and ServiceNow — two of the most visible players in enterprise AI and workflow automation.
- Microsoft (MSFT) remains the dominant force in cloud infrastructure and productivity software, with its AI integration deeply embedded in products like Office 365, Azure OpenAI, and Dynamics. Although Microsoft has been less transparent about standalone AI ARR, its cross-product integration strategy has kept it at the forefront of enterprise adoption. Its advantage lies in seamless native integration — rather than monetizing AI as a separate revenue line, it’s baking it into everything.
- ServiceNow (NOW), on the other hand, is pursuing a focused strategy in workflow automation with GenAI capabilities tied to task orchestration, IT operations, and HR service delivery. While it doesn’t disclose AI revenue explicitly, estimates suggest significant uptake across modules, especially post its strategic partnerships with NVIDIA and Microsoft. Its modular SaaS structure allows for more agile, vertical-specific AI adoption.
- Salesforce (CRM) is unique in that it publicly discloses AI ARR, which recently crossed the $1B threshold (up 120% YoY). This offers greater transparency — a potential edge with analysts and investors — but also sets higher expectations. Salesforce’s AI strategy is tied closely to its Data Cloud and the Agentforce platform, but the question remains whether it can scale these innovations organically or will rely on acquisitions like Informatica to accelerate adoption.
Overall, Salesforce appears to be ahead in AI monetization transparency, but trails in seamlessness of integration (vs. Microsoft) and vertical execution (vs. ServiceNow). The coming quarters will be critical in demonstrating that these early AI wins are scalable — not just showcase projects.
🧭 Verdict – AI Execution Will Make or Break This Re-Rating
At ~$267, Salesforce is trading about 9% below its probability-weighted fair value of $293. That’s not a deep discount — but for investors willing to wait on Agentforce and international AI scaling, it may represent a reasonable opportunity.
Still, this is not a momentum trade. Salesforce must show it can deliver consistent AI-driven revenue growth without leaning too heavily on M&A to do it.
📩 Call to Action
Follow @SWOTstock and subscribe to get clear, no-spin earnings breakdowns.
⚠️ Disclaimer
This article is based solely on Salesforce’s official Q1 FY26 earnings report and management’s public comments. It is not investment advice.


Leave a comment