

TL;DR Summary
Citigroup posted a robust Q2 beat, with EPS up 29% YoY and trading revenue surging in volatile markets. Its RoTCE improved to 8.7%, but still trails its 2026 target. With a tangible book value of $94.16 and a fair value estimate of $90.87, the stock appears fairly priced — but global expansion and capital return plans could drive future upside.
Q2 2025 Earnings Recap
Citigroup reported net income of $4.0B and EPS of $1.96, exceeding consensus expectations. Revenue rose 8% YoY to $21.7B, driven by double-digit growth in Markets and US Personal Banking. Trading desks thrived amid tariff-related volatility, while the firm continued to pare down non-core operations and reinvest in digital.

Key Metrics:
- Revenue: $21.7B (+8% YoY)
- Net Interest Income: +12% YoY
- RoTCE: 8.7%
- Tangible Book Value (TBV): $94.16
- CET1 ratio: 13.5%
- Capital Returned: $3.1B via buybacks and dividends
Management Highlights & Macro Context
On the earnings call, management reiterated its goal to reach 10–11% RoTCE by 2026, noting that simplification and technology modernization are key levers. Management acknowledged macro uncertainties but emphasized a strong capital position and stable consumer credit trends.
Meanwhile, markets benefited from tariff-induced volatility, boosting trading revenue by 16% YoY — the highest since 2020. Consumer banking remained steady, and Citi’s global diversification shielded it from regional slowdowns.
Strategic Growth: Asia in Focus
Citigroup is doubling down on Asia. The firm increased its Japan investment banking headcount by 15%, and reported a 140% YoY rise in institutional banking fees from Japan alone. This aligns with its plan to boost international dealmaking and fee-based income amid soft domestic lending margins.
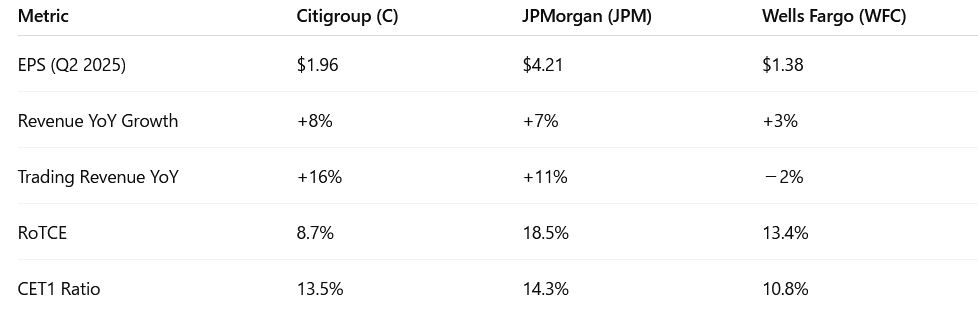
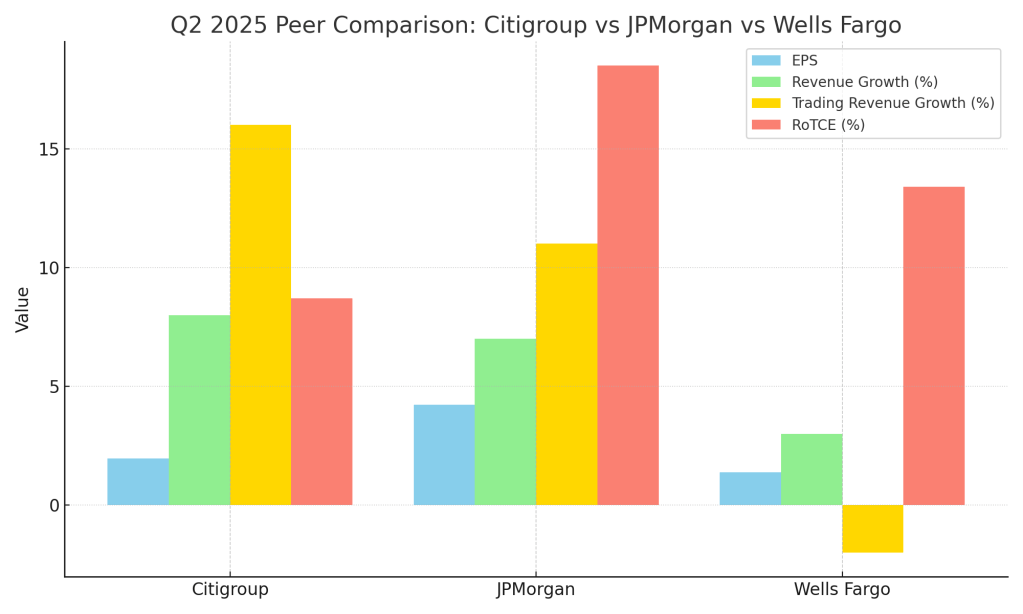
Peer Comparison: How Did Citi Stack Up?
Compared to JPMorgan and Wells Fargo, Citigroup still lags on profitability metrics like RoTCE (8.7% vs. JPM’s 18.5% and WFC’s 13.4%). However, Citi outperformed both in revenue growth (+8%) and trading revenue (+16%), indicating strength in capital markets and global diversification. Its CET1 ratio of 13.5% also reflects robust capital flexibility—positioning it well for continued buybacks and selective growth investments. The key gap remains consistent shareholder return and operational efficiency, which Citi is still working to close.
🧠 SWOT Analysis
Strengths
Resilient earnings growth and capital return.
Citigroup delivered strong YoY net income growth (+25%) and EPS of $1.96, with over $3B in capital returned via buybacks and dividends. Net interest income surged +12%, with double-digit revenue growth in key segments (Markets, Services, US Personal Banking). CET1 ratio at 13.5% gives capital flexibility.
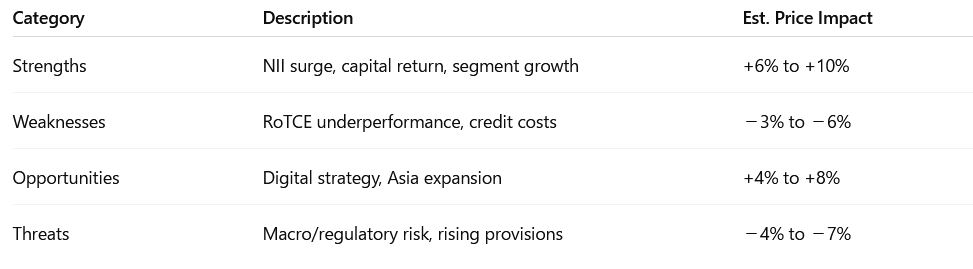
💰 Estimated Price Impact: +6 to +10%
If sustainable RoTCE > 9% is priced in with buybacks continuing, target valuation rises toward tangible book.
Weaknesses
Still below RoTCE target, cost pressure lingers.
At 8.7%, RoTCE is still short of management’s 10–11% 2026 target. Expenses rose 2% YoY (3% adj.), and cost of credit rose +16%. Execution risk remains on strategic transformation.
📉 Estimated Price Impact: −3 to −6%
Market may discount earnings quality or raise concerns about future margin compression.
Opportunities
Strategic repositioning + digital scale-up.
Management reiterated restructuring plans, exited non-core markets, and emphasized digital growth (incl. tokenized asset initiatives and credit cards). These efforts aim to lift RoTCE structurally.
🚀 Estimated Price Impact: +4 to +8%
If digital scale materializes and operating leverage improves, upward re-rating to 0.95–1.05x TBV is possible.
Threats
Macro risk + regulatory shifts.
Loan reserves were built up in response to macro uncertainty and higher charge-offs in cards. Also, potential regulatory capital rule changes (Basel Endgame) could pressure CET1 deployment.
⚠️ Estimated Price Impact: −4 to −7%
Any credit deterioration or CET1 squeeze could limit upside from capital return plans.
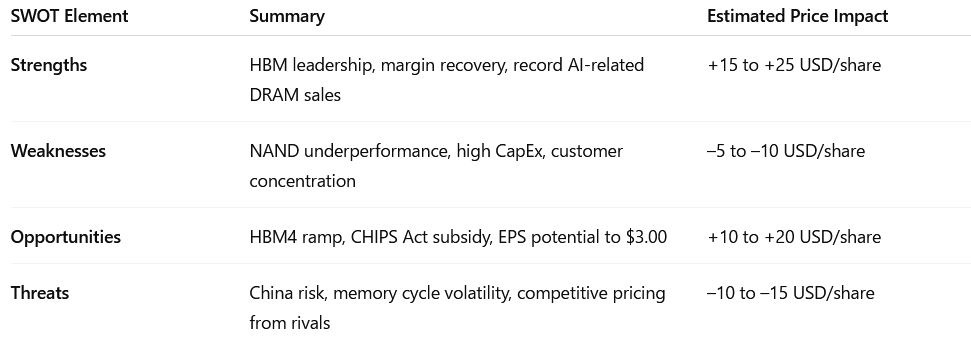
📊 Summary SWOT Table (Price Impact Ranges)

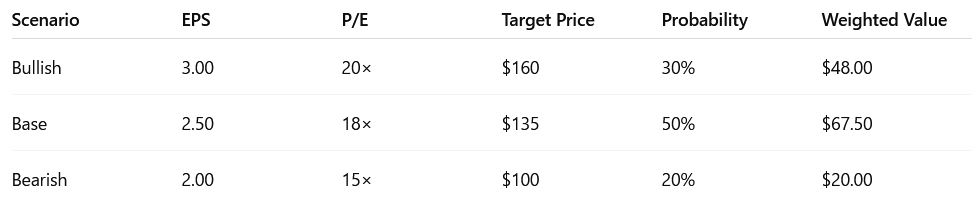
📈 Valuation Scenarios Based on SWOT
Assume current price = $90, Tangible Book Value (TBV) = $94.16, base-case P/TBV target = 0.95×–1.00×
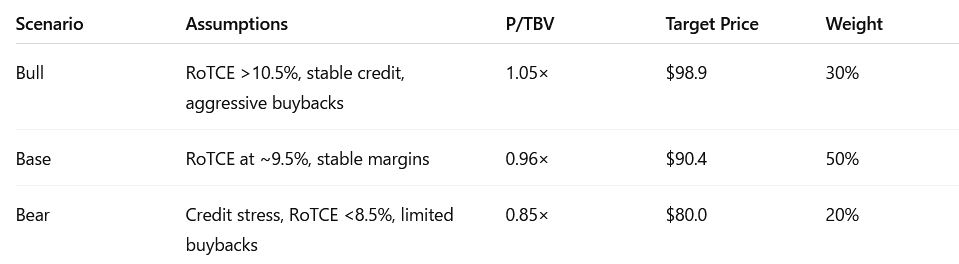
Fair Value=(98.9×0.3)+(90.4×0.5)+(80.0×0.2)=$90.87

Fair Value & Verdict
At $90, Citigroup trades near our fair value estimate of $90.87. The stock reflects Q2’s upside already, and future gains depend on the bank hitting its RoTCE goals and expanding fee-based revenues abroad.
Investor Verdict:
Neutral near-term outlook. Value investors should monitor credit trends and execution on transformation. Accumulate if price dips closer to TBV ($94.16) with upside potential from Asia growth and capital return.
📬 Call to Action
Want to compare Citi’s Q2 against JPMorgan and Wells Fargo?
Check out our SWOTstock posts on those banks and subscribe for updates after every major U.S. bank report.
⚠️ Disclaimer
This article is for informational purposes only and not investment advice. All analysis is based on Citigroup’s official Q2 2025 financial report and earnings call. No external analyst projections or third-party commentary were used.


Leave a comment