Amazon Q1 2026 Earnings: AI Growth Is Real — But So Is the Cost

Amazon’s Q1 2026 report highlights strong AWS growth (28% YoY) and improved operating income, solidifying its role in AI infrastructure. However, increased capital expenditures have compressed free cash flow, raising investor concerns. Stock valuation is near fair value, with future returns dependent on successful AI monetization. Caution remains essential.

TL;DR Summary

Amazon (AMZN:NASDAQ) delivered a strong Q1 2026 with accelerating AWS growth and expanding operating income, reinforcing its position as a core AI infrastructure player. However, massive AI-driven capex has compressed free cash flow, creating a key tension for investors. The stock is trading near fair value, with upside dependent on whether AI investments translate into durable returns.


Quarter Recap

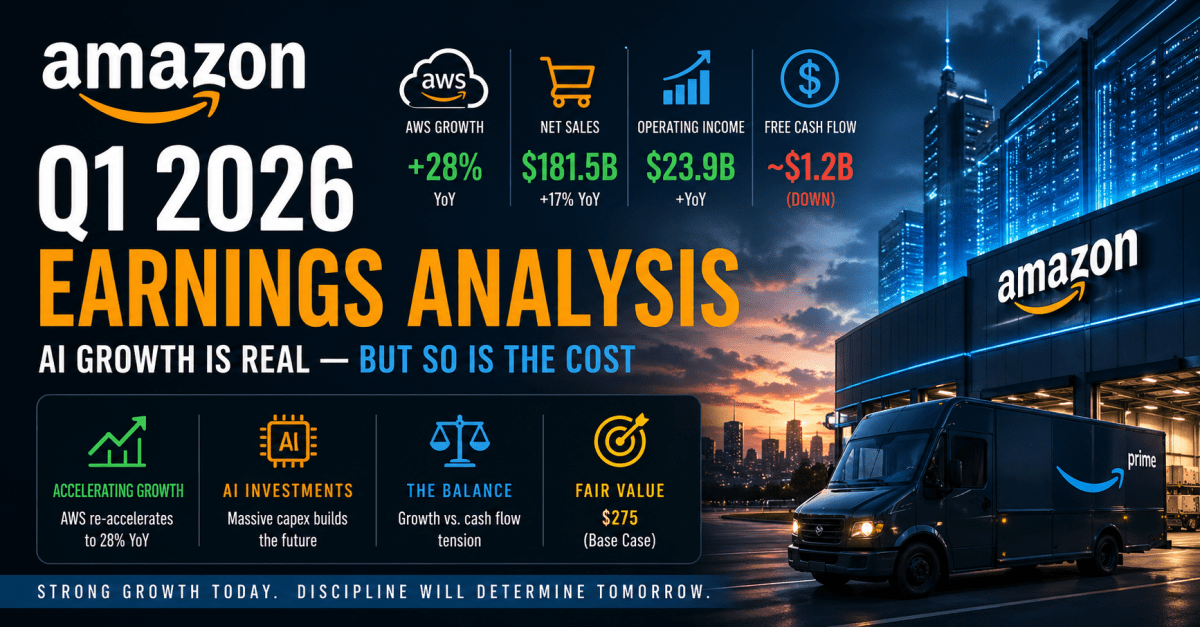
Amazon reported a solid Q1 2026, with revenue growing 17% year-over-year to $181.5 billion. The standout was AWS, which accelerated to 28% growth, marking a clear inflection after several quarters of slower expansion.

Operating income increased significantly, reflecting both stronger cloud profitability and continued efficiency improvements in the retail segment. However, net income was boosted by a large non-operating gain related to Amazon’s investment in Anthropic, which means headline earnings should be interpreted with caution.

At the same time, Amazon sharply increased capital expenditures, particularly in AI infrastructure, which led to free cash flow falling close to breakeven despite strong operating performance.


Key Highlights

Amazon’s quarter reinforces a structural shift in its business model. AWS and advertising continue to scale as high-margin engines, while retail is becoming more efficient and less of a drag on profitability.

The most important signal is AWS re-acceleration. A 28% growth rate suggests enterprise demand is returning, particularly driven by AI workloads. This positions Amazon firmly in the AI infrastructure race alongside its largest competitors.

However, the cost of that growth is rising. The surge in capital expenditure reflects an aggressive push to build out data centers, chips, and AI capacity. This creates a near-term tradeoff between growth and cash generation that investors cannot ignore.


SWOT Analysis

Amazon’s current positioning is defined by a simple dynamic: strong growth drivers are clearly visible, but the path to monetizing those drivers efficiently is still uncertain.
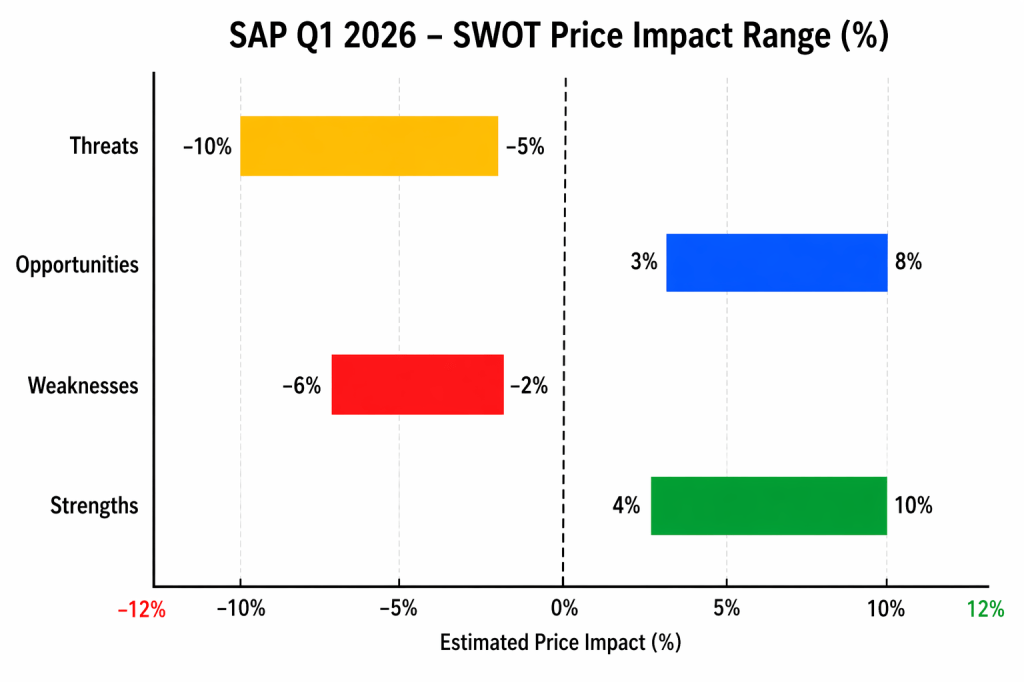
Strengths

  • AWS re-acceleration (28% YoY growth) confirms strong AI-driven demand
    Estimated price impact: +6% to +10%
  • High-margin businesses (AWS + Advertising) continue to scale, improving overall mix
    Estimated price impact: +4% to +7%
  • Operating income expansion shows improving efficiency across segments
    Estimated price impact: +3% to +5%

Weaknesses

  • Free cash flow is compressed due to heavy AI-related capital expenditure
    Estimated price impact: -5% to -8%
  • Earnings quality is partially distorted by non-operating investment gains
    Estimated price impact: -2% to -4%

Opportunities

  • AI monetization across AWS and enterprise services could unlock long-term pricing power
    Estimated price impact: +8% to +15%
  • Continued logistics and retail efficiency improvements can drive margin expansion
    Estimated price impact: +3% to +6%

Threats

  • AI infrastructure arms race could lead to overinvestment and margin pressure
    Estimated price impact: -6% to -10%
  • AWS growth remains exposed to enterprise spending cycles
    Estimated price impact: -3% to -6%
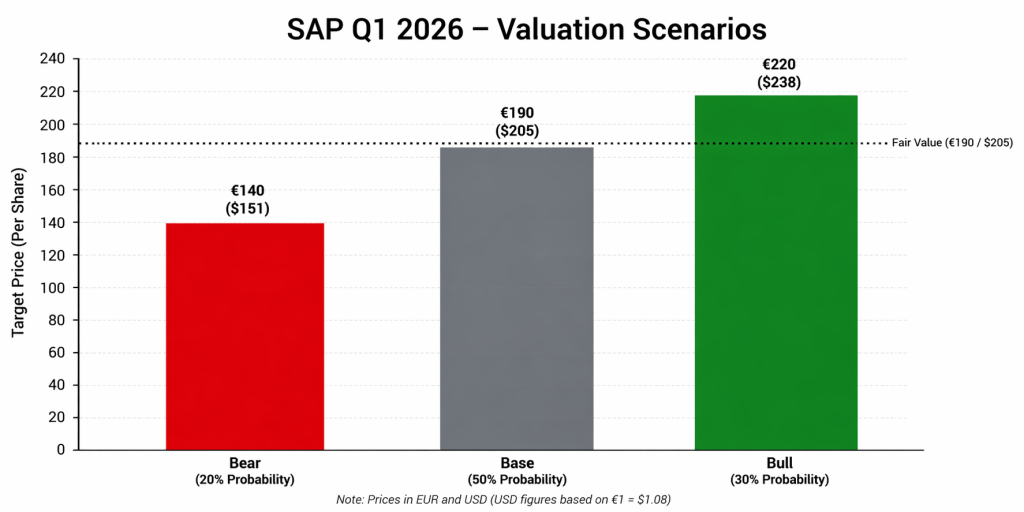
Valuation Scenarios

Amazon’s valuation now hinges on whether its aggressive AI investment cycle will translate into sustained earnings growth or prolonged margin pressure.

Bear Case

AWS growth slows and AI investments fail to generate near-term returns, while margins come under pressure from continued infrastructure spending.

Estimated price: $220–$240


Base Case

AWS maintains strong growth, AI investments begin to show early monetization, and margins expand gradually over time.

Estimated price: $260–$290


Bull Case

AI demand accelerates further, AWS growth strengthens, and Amazon achieves meaningful operating leverage from its high-margin segments.

Estimated price: $300–$340


Probability-Weighted Fair Value

Combining these scenarios, the estimated fair value is approximately $275, placing the current price near fair value with limited margin of safety.


Verdict

Amazon is no longer just an e-commerce and cloud company — it is now firmly positioned as an AI infrastructure platform. The growth story is real, but so is the cost of building that future.

At current levels, the stock reflects cautious optimism. Investors are willing to believe in the long-term AI opportunity, but they are waiting for clearer evidence that these investments will translate into sustainable cash flow.

This is not a deep value opportunity. It is a conviction-driven growth investment that requires confidence in management’s ability to convert scale into returns.


Call to Action

If you believe Amazon can successfully monetize its AI investments, the current valuation offers a reasonable entry point. If you are concerned about capital efficiency and cash flow, it may be worth waiting for clearer signs of return on investment.

Follow SWOTstock for more structured, investor-focused earnings analysis grounded in official company data.


Disclaimer

This analysis is for informational purposes only and does not constitute financial advice. Always conduct your own research and consult with a licensed financial advisor before making investment decisions.

SAP Q1 2026 Earnings: From Cloud Transition to Cash Flow Compounder?

SAP reported strong Q1 2026 results, showcasing accelerated cloud ERP growth, a significant backlog increase, and improved profitability. Although investors reacted positively, full-year guidance remains unchanged, raising concerns about future growth sustainability. As SAP transitions to a recognized compounder, investors must evaluate if its current premium valuation is warranted.

TL;DR

SAP (SAP:NYSE) delivered a strong Q1 2026 with accelerating cloud ERP growth, rising backlog visibility, and expanding margins. The stock’s ~+6% post-earnings reaction signals that investors are regaining confidence in SAP as a durable, high-quality enterprise software compounder.

However, the key debate has shifted: this is no longer about turnaround — it’s about whether SAP deserves a premium valuation.


Quarter Recap

SAP’s Q1 results confirmed that its multi-year cloud transition is not only intact but strengthening. Cloud backlog rose to €21.9B, growing 25% in constant currency, while cloud ERP suite revenue accelerated to 30% growth.

At the same time, profitability improved meaningfully, with operating profit rising 24% in constant currency. This combination — growth plus margin expansion — is exactly what long-term investors look for in a maturing software platform.

Yet, SAP did not raise full-year guidance. That detail matters more than it looks.


Key Highlights

SAP’s quarter can be summarized as follows:

  • Strong cloud backlog growth reinforcing revenue visibility
  • Continued dominance in cloud ERP, the company’s core moat
  • Clear operating leverage and margin expansion
  • Ongoing decline in legacy license and services revenue
  • Stable (not upgraded) FY2026 guidance

This creates a tension between strong execution today and uncertainty about the growth trajectory ahead.


SWOT Analysis (with Price Impact)

SAP’s current positioning reflects a transition into a quality compounder, but not without risks.

Strengths

SAP’s backlog growth provides strong forward visibility, reducing downside risk and supporting valuation stability. At the same time, its cloud ERP suite continues to expand rapidly, reinforcing its dominance in mission-critical enterprise systems. Combined with rising operating leverage, SAP is increasingly viewed as a cash flow engine rather than just a cloud transition story.

Weaknesses

The decline in legacy license and services revenue continues to weigh on overall growth perception. More importantly, the decision to maintain — rather than raise — full-year guidance introduces uncertainty about how sustainable the current growth momentum really is.

Opportunities

SAP is uniquely positioned to embed AI into existing ERP workflows, which could unlock incremental monetization. In parallel, continued margin expansion could justify a re-rating toward premium software multiples.

Threats

Growth normalization remains the biggest risk. SAP itself signaled that Q1 benefited from timing effects, with slower growth expected in Q2. In addition, macro and geopolitical assumptions embedded in guidance introduce external uncertainty uncommon for software firms.

CategoryDriverPrice Impact
StrengthBacklog visibility+6% to +10%
StrengthCloud ERP dominance+5% to +9%
StrengthMargin expansion+4% to +8%
WeaknessLegacy decline-3% to -6%
WeaknessNo guidance raise-2% to -5%
OpportunityAI monetization+3% to +8%
OpportunityMultiple expansion+4% to +7%
ThreatGrowth normalization-5% to -10%
ThreatMacro/geopolitical risk-3% to -7%
SAP Q1 2026 SWOT price impact range chart showing upside from backlog and ERP growth versus downside from normalization risks
SAP’s valuation is driven by strong ERP and backlog momentum, with downside risks centered on growth normalization

Valuation Scenarios (EUR & USD)

The ADR closing price after earnings released was ~USD175, up more than 7%

  • FX assumption: €1 ≈ $1.08

Bull Case (30% probability)

SAP successfully transitions into a premium compounder with sustained ERP growth and continued margin expansion.

  • EUR: €210 – €230
  • USD: $227 – $248

Base Case (50% probability)

Growth moderates but remains durable. SAP trades as a high-quality but mature enterprise software leader.

  • EUR: €184 – €196
  • USD: $199 – $212

Bear Case (20% probability)

Growth slows faster than expected, and Q1 proves to be a peak quarter.

  • EUR: €130 – €150
  • USD: $140 – $162

Probability-Weighted Outcome

  • Expected fair value range:
    → €187 – €193
    → $202 – $208

This implies moderate upside from current levels, but not a deep margin of safety.

SAP Q1 2026 valuation scenarios chart showing bear, base, and bull case price targets in euros and US dollars with probability weighting and fair value reference
SAP’s valuation suggests moderate upside under the base case, with potential re-rating if margin expansion continues, while downside risk remains if growth normalizes faster than expected

Verdict

SAP is no longer a turnaround story. It is evolving into a high-quality enterprise compounder with strong cash flow characteristics.

But that evolution comes with a new challenge:

The market is already starting to price it that way.

For investors, the opportunity is not in identifying whether SAP is improving — that is now clear. The real question is whether the current valuation fully reflects that improvement.


Call to Action

If you are a long-term investor, SAP remains a strong candidate for a core portfolio holding, especially if you believe in the durability of enterprise ERP systems.

However, this is no longer a stock to chase aggressively. Entry discipline matters more than ever.


Disclaimer

This analysis is for informational purposes only and does not constitute financial advice. Always conduct your own research and consider your risk tolerance before making investment decisions.


Bank of America Q1 2026 Earnings: Strong Quarter, But Is the Upside Already Priced In?

TL;DR Summary

Bank of America (BAC:NYSE) delivered a strong Q1 2026, with solid growth in net interest income, a rebound in investment banking, and stable credit quality. The market reacted positively, but not aggressively—because the key question hasn’t changed:

Is BAC a stable compounder deserving a higher multiple, or still a rate-sensitive cyclical bank?

Our probability-weighted valuation lands at ~$54, suggesting the stock is fairly valued today, with upside dependent on capital markets recovery and downside tied to credit normalization.


Quarter Recap

Bank of America opened 2026 with a quarter that looked stronger than many investors expected. Revenue reached $30.3 billion, up 7% year-over-year, while net income came in at $8.6 billion, translating into $1.11 EPS.

What stands out is not just the headline numbers, but the composition. Net interest income grew to $15.7 billion, signaling that the bank is still extracting value from its deposit base even in a maturing rate cycle. At the same time, capital markets activity showed clear signs of recovery, with investment banking fees and trading revenue both moving higher.

Underneath, credit quality remains controlled. Net charge-offs are still relatively low at 0.48% of loans, and capital remains strong with a CET1 ratio of 11.2%.

This is not a one-dimensional quarter—it’s a balanced earnings engine at work.


Key Highlights

The quarter tells a simple story: Bank of America is no longer relying on just one lever.

Net interest income continues to provide a stable base, while capital markets are beginning to add cyclical upside. Consumer banking and wealth management remain steady contributors, and the balance sheet continues to expand with loan growth holding firm.

At the same time, nothing in the quarter suggests excessive risk-taking. Credit remains benign, and capital levels leave room for continued shareholder returns.

That combination—growth without visible stress—is exactly what investors look for in a large-cap bank.


SWOT Analysis (with price impact ranges)

The real debate for Bank of America is not whether the business is performing—it clearly is. The question is how much of that performance is sustainable, and how the market should value it.

Strengths

Bank of America’s biggest strength today is the resilience of its earnings engine. Net interest income continues to grow despite concerns around peak rates, which suggests that its deposit franchise remains a structural advantage.

At the same time, the bank benefits from a highly diversified model. Consumer banking, wealth management, trading, and investment banking all contributed meaningfully in the quarter, reducing reliance on any single driver.

Finally, capital and credit remain solid. With a CET1 ratio above 11% and low charge-offs, the bank has both downside protection and flexibility to return capital.

Estimated price impact:
+3% to +10% across key strength drivers


Weaknesses

The core weakness is one that has always defined Bank of America: its sensitivity to interest rates. While that worked in its favor during rate hikes, it becomes a constraint if rates move lower more quickly than expected.

In addition, the bank’s scale creates structural inefficiencies. Large universal banks face higher fixed costs—technology, compliance, and operations—which limits operating leverage compared to smaller or more focused peers.

Estimated price impact:
-3% to -8%


Opportunities

The biggest opportunity lies in capital markets. The rebound in investment banking and trading activity in Q1 may be the early stages of a broader recovery cycle. If deal activity continues to improve, this could provide a meaningful boost to earnings beyond what is currently priced in.

At the same time, steady loan growth and a stable deposit base create a foundation for organic expansion without taking on excessive risk.

Estimated price impact:
+4% to +12%


Threats

The main risks are cyclical. Credit costs are currently low, but they are unlikely to stay there indefinitely. A normalization cycle could quickly pressure earnings if provisions rise faster than expected.

Macro uncertainty also remains a key factor. A combination of rate cuts and economic slowdown would hit both net interest income and loan growth at the same time.

Estimated price impact:
-5% to -12%

Bank of America Q1 2026 SWOT price impact chart showing strengths (+3% to +12%), weaknesses (-9% to -1%), opportunities (+1% to +10%), and threats (-8% to -2%) on a horizontal axis from -20% to +20%.
Bank of America’s valuation profile reflects balanced upside from capital markets and NII resilience, offset by downside risks from credit normalization and macro uncertainty.

Valuation Scenarios

The valuation comes down to how the market interprets this mix of strengths and risks.

Base Case (50%) — Stable but not re-rated

In the most likely scenario, Bank of America continues to deliver steady earnings with moderate growth. Net interest income stabilizes, capital markets gradually recover, and credit costs rise slightly but remain manageable.

Fair value: $52–$60


Bull Case (25%) — Earnings upgrades + multiple expansion

In a more optimistic scenario, capital markets rebound strongly and credit remains benign. The market begins to see Bank of America as a high-quality compounder rather than a cyclical bank, leading to both earnings upgrades and multiple expansion.

Fair value: $64–$75


Bear Case (25%) — Macro and credit pressure

In the downside scenario, rates fall faster than expected while credit costs rise. Earnings decline and the market applies a lower multiple, reflecting increased uncertainty.

Fair value: $32–$40


Probability-Weighted Valuation

Bringing these scenarios together results in a weighted fair value of approximately:

~$54 per share

At current levels, this suggests the stock is fairly valued, with limited margin of safety.

Bar chart showing Bank of America Q1 2026 valuation scenarios with bear case at $36, base case at $56, and bull case at $70, with a dotted fair value line at approximately $54.
Bank of America’s Q1 2026 valuation scenarios highlight a balanced risk-reward profile, with the current price near fair value, upside driven by capital markets recovery, and downside risk from credit normalization and macro uncertainty.

Verdict

Bank of America is executing well. The business is strong, diversified, and supported by solid capital and credit fundamentals.

But the stock is no longer cheap. The market is already pricing in a stable base case, leaving investors dependent on either a capital markets-driven upside surprise or exposed to a credit or macro-driven downside.

For value-oriented investors, this becomes a question of timing rather than conviction.


Call to Action

Would you buy Bank of America at $55, or wait for a better entry point closer to the downside scenario?

Let me know how you’re thinking about large-cap banks in this cycle.


Disclaimer

This analysis is for informational purposes only and does not constitute investment advice. All assumptions are based on Bank of America’s official earnings release and investor materials for Q1 2026. Investors should conduct their own research before making investment decisions.