NVIDIA Q1 FY2026: AI Revenue Soars, but China Risk Lingers

NVIDIA’s Q1 FY2026 earnings show record AI revenue and rising risks from China export bans. See full breakdown, SWOT, and valuation scenarios.

TL;DR Summary

NVIDIA (NASDAQ: NVDA) delivered record-breaking Q1 revenue powered by AI infrastructure demand, but a $4.5B China-related inventory charge exposed its vulnerability to export regulations. Strong outlook continues, but geopolitical risks cap near-term upside.

Quarter Recap

NVIDIA reported a stellar Q1 FY2026 with $44.06 billion in revenue, up 69% year-over-year, driven primarily by its Data Center segment which surged to $39.1 billion. The company’s full-stack AI platform, from Blackwell GPUs to CUDA software, continues to lead the industry.

However, a $4.5 billion inventory charge—triggered by U.S. export restrictions on H20 chips to China—cut into GAAP gross margin, bringing it down to 61.0%. Without this one-off, margins would have reached 71.3%.

CEO Jensen Huang maintained a confident tone, citing global momentum for AI compute and strong enterprise demand. Q2 guidance sits at $45 billion in revenue, despite an expected $8 billion China shortfall.

Line chart showing NVIDIA's revenue and net income growth from Q1 FY25 to Q1 FY26, highlighting consistent financial expansion.

What Changed Since Last Quarter

  • Revenue jumped 18% from Q4 FY2025’s $37.98B
  • China export losses increased and led to a $4.5B inventory charge
  • Blackwell ramp-up continued, now complemented by global AI partnerships
  • Margins would have improved sequentially if not for the export charge

Key Highlights

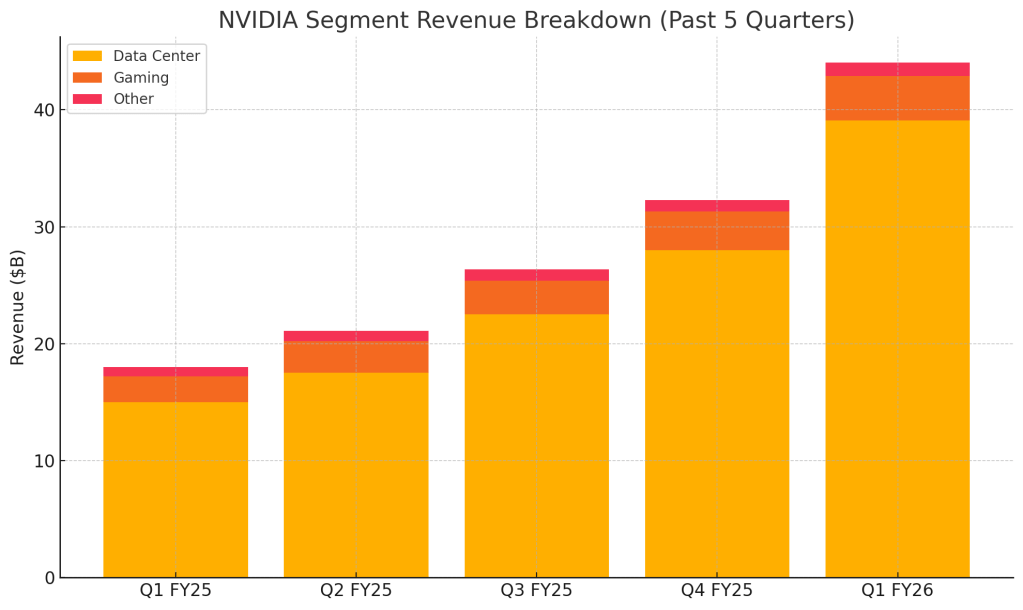
  • Revenue: $44.06B (+69% YoY, +18% QoQ)
  • Data Center Revenue: $39.1B (+73% YoY)
  • Gaming Revenue: $3.8B (+42% YoY)
  • Gross Margin (ex. H20 charge): 71.3%
  • Inventory Charge: $4.5B related to H20 China restrictions
  • Q2 Outlook: $45B revenue, ~$8B loss from China bans

Segment Revenue Breakdown

NVIDIA’s Q1 FY2026 results show that its Data Center business has become the overwhelming growth engine, with Gaming rebounding and smaller segments contributing steadily.

Stacked bar chart showing NVIDIA’s segment revenues, highlighting growth in Data Center and Gaming over 5 quarters.

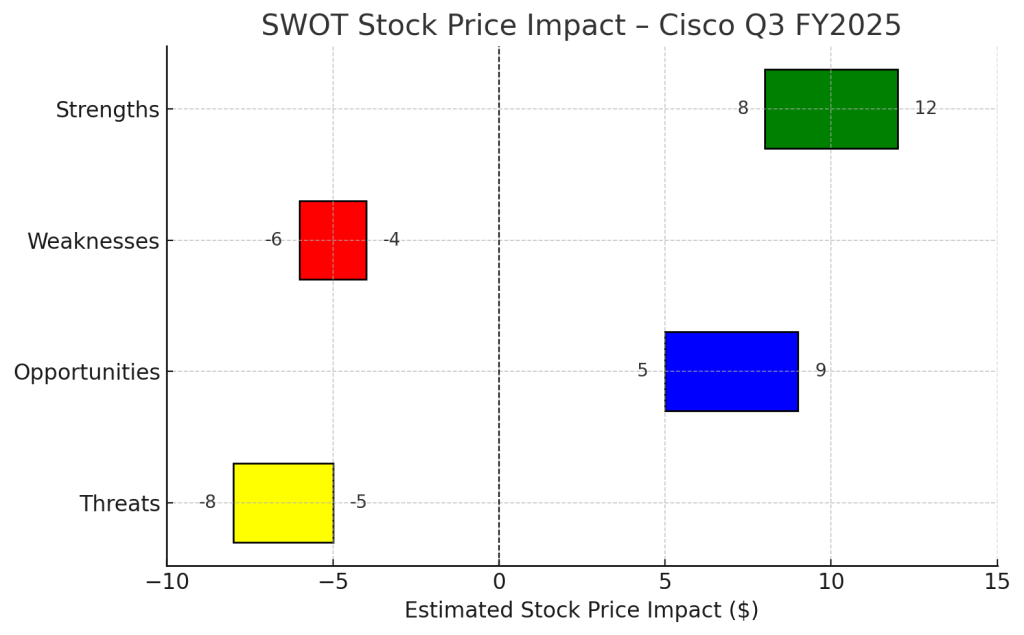
SWOT Analysis with Price Impact
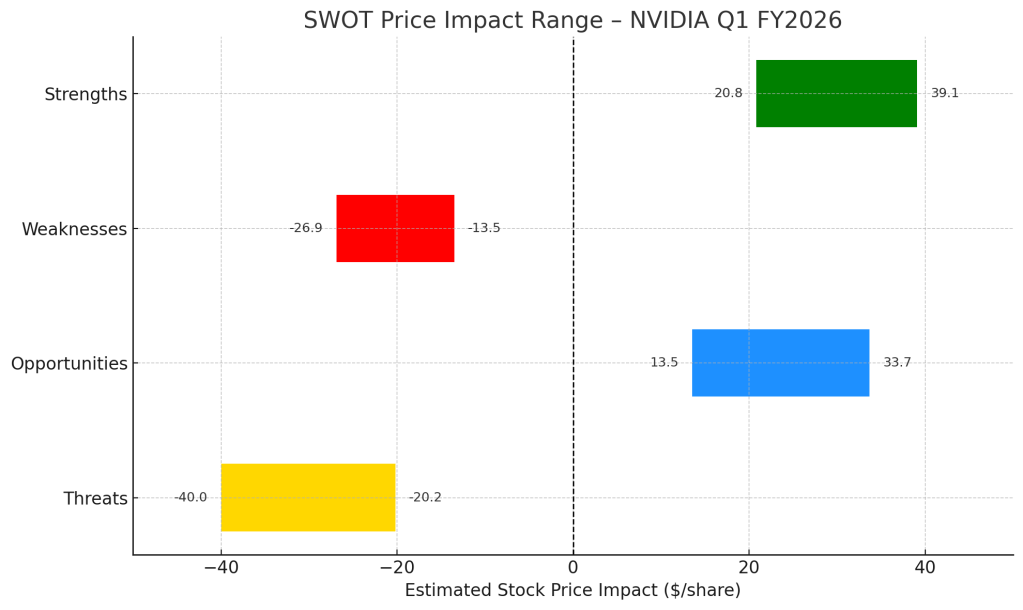
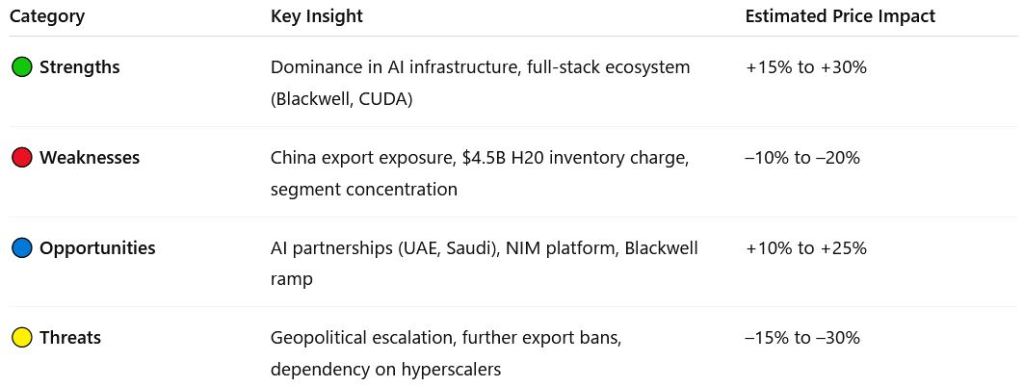
Horizontal bar chart showing estimated stock price impact for each SWOT factor, ranging from –$40 to +$40 per share.

Strengths

NVIDIA’s dominance in AI infrastructure remains unchallenged. Its platform—from Blackwell chips to CUDA and software libraries—continues to see record enterprise demand.
Price Impact: +15% to +30%

Weakness

The $4.5B write-down tied to H20 inventory for China highlights dependency on export-sensitive products.
Price Impact: –10% to –20%

Opportunities

New AI alliances with Saudi Arabia, UAE, and Taiwan, along with platform expansion via NIM (Inference Microservices), open large future markets.
Price Impact: +10% to +25%

Threats

China restrictions are set to cost $8B in Q2 revenue. Further geopolitical escalation may erode future sales or strain global operations.
Price Impact: –15% to –30%

SWOT Summary

Table summarizing NVIDIA’s Q1 FY2026 SWOT analysis with strengths in AI leadership, weaknesses in China exposure, opportunities in global AI expansion, and threats from geopolitical risks, each with estimated stock price impacts.

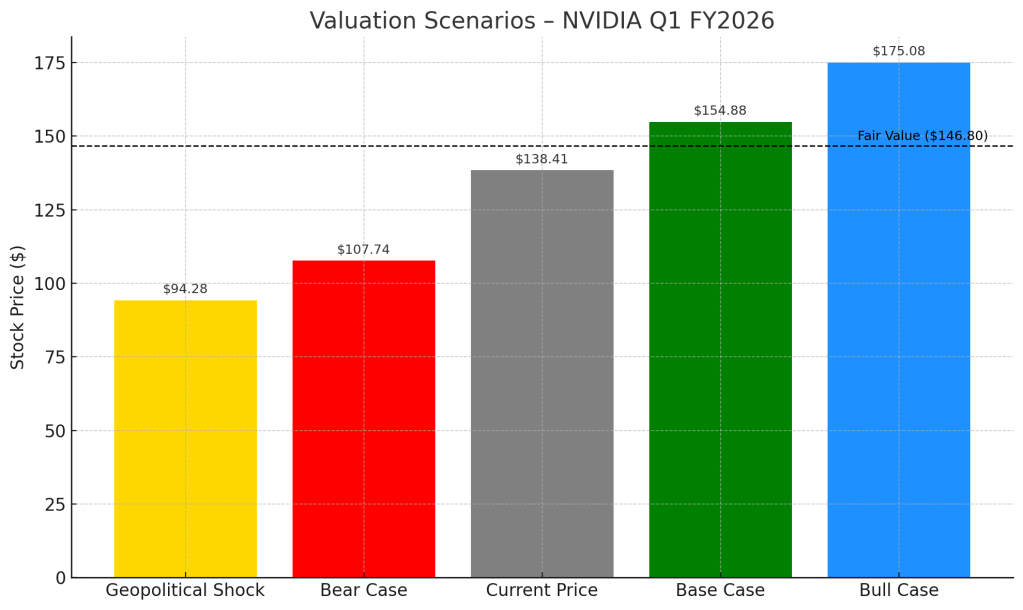
What’s NVIDIA Worth After Q1 FY2026?

To value NVIDIA after its blockbuster Q1 FY2026 earnings, we consider three realistic scenarios for its forward earnings power—each reflecting a different blend of AI infrastructure growth, export risks, and margin execution.

Bar chart showing valuation scenarios from worst case ($94.28) to bull case ($175.08) with fair value line at $146.80.

Bull Case – $412.50/share (25% probability)

In the most optimistic scenario, NVIDIA ramps Blackwell faster than expected and U.S. export restrictions ease, allowing China sales to partially recover. Enterprise demand for generative AI compute remains red-hot globally, lifting both volumes and pricing. If earnings rise to $7.50 per share and the market awards a 55x multiple (consistent with high-growth AI comps), the stock could reach $412.50. While aggressive, this case reflects NVIDIA’s AI platform expanding into global infrastructure—and we assign it a 25% probability.

Base Case – $307.20/share (60% probability)

The base case assumes NVIDIA continues executing well, with growth sustained in the U.S., Middle East, and Asia-Pacific (excluding China). Blackwell adoption progresses on schedule, but China restrictions persist. Margins remain strong, but headline volatility lingers. We estimate forward EPS at $6.40 and apply a P/E of 48x—slightly below peak valuation—yielding a $307.20 price target. This scenario reflects the most likely outcome given current guidance and market conditions.

Bear Case – $200.00/share (15% probability)

In a downside case, AI capex moderates, China-related risks escalate, and competitors gain share in inference or custom silicon. NVIDIA faces pricing pressure or slower enterprise uptake. If forward EPS falls to $5.00 and valuation compresses to 40x, the stock could be re-rated to $200. While less likely in the near term, we assign this outcome a 15% probability due to macro and geopolitical uncertainties.

Valuation Scenarios Summary

Table comparing NVIDIA’s bull, base, and bear case stock valuations for Q1 FY2026, including EPS estimates, P/E multiples, target prices, and probabilities.

Fair Value Estimate: $308.95

Weighted across all three outcomes, our fair value estimate for NVIDIA is $308.95 per share—more than double its current price of ~$133.59 (as of June 2025). That implies significant long-term upside, especially if export risks stabilize and Blackwell adoption broadens globally.


(0.25 × $412.50) + (0.60 × $307.20) + (0.15 × $200.00) = $308.95


What to Watch Next Quarter

  • Ramp-up of Blackwell shipments outside China
  • Progress on AI factory partnerships in UAE and Saudi Arabia
  • Margin recovery trends
  • Policy developments in U.S.-China tech export restrictions

Verdict

NVIDIA remains the cornerstone of AI infrastructure. Q1 FY2026 reaffirms its growth engine, but investors should watch for regulatory headwinds. For growth stock investors, it’s a strong hold and a potential buy on dips.


Call to Action

📬 Like this kind of breakdown?
Subscribe to SWOTstock for clear, official-report-based earnings breakdown.


Disclaimer

This article is based entirely on NVIDIA’s Q1 FY2026 financial report, earnings call transcript, and management statements. It does not constitute investment advice.


Leave a comment


Autodesk Q1 2026 Earnings: AI Tools Drive Growth—but Is the Upside Already Priced In?

Autodesk (ADSK) beats Q1 FY2026 estimates and raises guidance, but is the stock already priced for perfection? Dive into our AI-focused SWOT analysis, valuation breakdown, and investor verdict.

TL;DR – Solid Beat, Upgraded Guidance, But Market Unmoved

Autodesk (NASDAQ: ADSK) beat expectations in Q1 with 15% revenue growth, expanding margins, and strong free cash flow. Management raised full-year guidance and highlighted its AI platform roadmap. Still, the stock stayed flat—suggesting the optimism may be fully priced in.


Financial Overview – Growth That Converts to Cash

Autodesk reported:

  • Revenue: $1.63B (+15% YoY)
  • EPS (Non-GAAP): $2.29
  • Operating Margin: 37% (+300bps YoY)
  • Free Cash Flow: $556M (+14%)
  • Billings: $1.43B (+29%)
  • FY2026 guidance raised for revenue and EPS

What sets Autodesk apart isn’t just strong revenue—it’s the ability to consistently convert earnings into cash flow.

Line chart showing Autodesk’s free cash flow and net income over the last five quarters, highlighting consistent growth through Q1 2026.

Where the Growth Is Coming From

Revenue isn’t growing evenly across all business lines. Autodesk’s AEC (architecture, engineering, and construction) segment remains dominant, but Manufacturing and “Others” are catching up.

Bar chart comparing Autodesk’s revenue by segment—AEC, Manufacturing, and Others—between Q1 2025 and Q1 2026.

Also critical is the mix of recurring revenue. Subscription ARR is expanding steadily, which supports long-term valuation multiples.

Line chart showing Autodesk’s total revenue versus quarterly subscription ARR from Q1 2025 to Q1 2026, reflecting recurring revenue growth.

Management’s Outlook – Confidence Backed by Upward Revisions

Autodesk has shown a pattern of raising guidance, reinforcing investor confidence in leadership and execution.

Bar chart illustrating Autodesk’s EPS guidance revisions, showing increases from original to final guidance in FY2025 and FY2026.

SWOT Breakdown – What’s Working, What’s Not, and Where We Go Next

Let’s break it down using SWOT—strengths, weaknesses, opportunities, and threats—with estimated stock price impact for each:

Strengths

  • Revenue and FCF beat expectations
  • AI rollout begins across Revit and Fusion
  • Subscription model fuels predictable growth

Price Impact: +$15 to +$20


Weaknesses

  • Flat stock reaction post-earnings suggests limited short-term upside
  • High R&D spend during platform transition could compress near-term margins

Price Impact: –$5 to –$10


Opportunities

  • Generative design and predictive modeling features gain traction
  • Construction Ops platform and APAC expansion could drive new growth
  • Increased ARR could unlock multiple expansion

Price Impact: +$25 to +$40


Threats

  • Geopolitical and macro headwinds
  • Execution risk with AI and Cloud scale
  • Valuation already rich (~30.7x forward earnings)

Price Impact: –$20 to –$30

SWOT Summary Table

Type Key Points Price Impact
Strengths Revenue & margin beat, AI rollout started +$15 to +$20
Weaknesses Flat stock, platform costs –$5 to –$10
Opportunities Generative design AI, platform growth, APAC expansion +$25 to +$40
Threats Macro risk, AI execution gaps, valuation pressure –$20 to –$30
Horizontal bar chart showing Autodesk’s estimated stock price impact by SWOT element with both endpoints labeled.

Valuation Scenarios – Let’s Do the Math

Despite the strong report, Autodesk’s closing price after earning released ($295.35 as of May 23, 2025) implies a ~30.7x forward P/E. Here’s how that compares to valuation scenarios based on official EPS guidance and fair multiples:

Base Case – Fair Value: $132

  • EPS = $9.62 × P/E 13.7 → $132
  • Reflects steady execution and moderate optimism

Bull Case – Fair Value: $160

  • EPS = $9.73 × P/E 16.5 → $160
  • Assumes strong AI traction and margin expansion

Bear Case – Fair Value: $100

  • EPS = $9.50 × P/E 10.5 → $100
  • Macro pressure + execution delays = multiple compression

Weighted Average Estimate: $132.5

(132×0.6)+(160×0.25)+(100×0.15)=132.5

Bar chart showing Autodesk’s valuation scenarios with weighted average, compared to current stock price.

So Why Is the Market Paying $295?

That’s nearly double our base case. Investors are pricing in:

  • Premium for platform dominance and design ecosystem
  • Long-term AI monetization potential
  • Confidence in 3–5 year growth, not just FY2026

Let’s check historical valuation to see if this premium is new.

Dual-axis chart showing Autodesk’s stock price and trailing P/E ratio over the last five years.

Verdict – Fully Valued. Wait for Dip.

Autodesk’s vision is impressive. The stock is too.
But at current prices, the upside may already be realized—at least in the short term. Long-term investors may want to hold. Opportunists should consider waiting for a pullback below $250 to improve margin of safety.


Call to Action

Want no-hype, investor-friendly breakdowns like this?
Subscribe to SWOTstock to stay ahead of the curve—no fluff, just fundamentals.


Disclaimer

This post is based solely on Autodesk’s official financial report and earnings call transcript. It does not constitute investment advice. Please do your own research.


Leave a comment


Cisco Q3 FY2025: Dividend Still Solid, Value Emerging — But Is the Splunk Deal a Risk or Reward?

Cisco reported strong Q3 FY2025 results with revenue of $14.15 billion and an EPS of $0.96, beating expectations. The Splunk acquisition offers growth opportunities despite integration risks. The stock is fairly valued at ~$61, providing a 2.6% dividend yield, making it appealing for long-term investors, despite macroeconomic and competitive threats.

Key Takeaways for Income & Value Investors

Cisco (NASDAQ: CSCO) delivered a strong Q3 FY2025, beating expectations and reaffirming its role as a dividend staple. The completed Splunk acquisition adds risk—but also opportunity in cybersecurity and observability. At ~$61, the stock appears fairly valued, with solid yield, modest upside, and limited downside—making it attractive for long-term dividend investors.


Cisco Q3 2025 Earnings Summary

  • Revenue: $14.15 billion (+11% YoY)
  • Non-GAAP EPS: $0.96 (vs. $0.92 guidance)
  • GAAP EPS: $0.62
  • Operating cash flow: $5.2 billion
  • Dividend paid: $1.6 billion
  • Share repurchases: $1.5 billion
  • Free cash flow payout ratio: ~61%
  • Forward dividend yield: ~2.6%
  • Free cash flow yield: ~6.8% (on trailing FCF of ~$15B)
ine chart showing Cisco’s revenue growth and non-GAAP EPS trends over the last five quarters, highlighting consistent financial performance through Q3 FY2025.

Key Highlights This Quarter

  • AI Orders Surge: $600M+ in Q3, exceeding $1B fiscal YTD
  • Capital Return: $3.1B to shareholders (buybacks + dividends)
  • Splunk Acquisition: $28B deal now closed, expanding security + analytics
  • FY2025 Guidance Raised: Modest bump in revenue and earnings outlook
  • CFO Change: Mark Patterson to succeed Scott Herren in July

SWOT Analysis (Based on Cisco’s Official Earnings Report & Call)

Strengths

Cisco remains a cash flow powerhouse with predictable returns. It beat guidance, raised full-year forecasts, and maintained a consistent capital return policy. AI orders and secure networking sales accelerated.

Estimated Stock Price Impact: +$8 to +$12

Weaknesses

The security portfolio underperformed, and the integration of Splunk introduces both cultural and execution risks. These could delay synergy realization or weigh on margins short-term.

Estimated Stock Price Impact: –$4 to –$6

Opportunities

Cisco’s software transition, fueled by Splunk, gives it greater recurring revenue potential. Emerging bets like quantum computing and AI-integrated infrastructure add long-term optionality.

Estimated Stock Price Impact: +$5 to +9

Threats

Enterprise IT spending remains vulnerable to macro pressures. Cisco also faces intense competition from hyperscalers and specialized security firms. The CFO transition may cause short-term strategic jitters.

Estimated Stock Price Impact: –$5 to –$8


SWOT Summary Table

SWOT CategoryKey DriverEst. Stock Price Impact
StrengthsEarnings beat, AI orders, dividend reliability+8 to +12
OpportunitiesSoftware shift, Splunk synergy, R&D expansion+5 to +9
WeaknessesSecurity miss, integration risk–4 to –6
ThreatsMacro exposure, competition, leadership change–5 to –8

Horizontal bar chart illustrating Cisco’s estimated stock price impact by SWOT category—Strengths, Weaknesses, Opportunities, and Threats—with clearly labeled ranges.

Cisco Stock Valuation Scenarios Based on FY2025 Guidance

ScenarioEPS (FY25E)P/E MultiplePrice TargetProbabilityWeighted Value
Base Case$3.7816x$60.4860%$36.29
Bull Case$3.9018x$70.2025%$17.55
Bear Case$3.6014x$50.4015%$7.56

Probability-Weighted Fair Value: ≈ $61.40
Current Price: $61.29


Dividend & Value Snapshot

FactorSWOTstock Assessment
Dividend Yield~2.6%, well-covered by FCF
Free Cash Flow TrendStrong ($5.2B this quarter)
Dividend Growth HistoryConsistent increases since 2011
Valuation vs. PeersCompetitive vs. IBM, Juniper, and Broadcom
Short-Term UpsideModerate if Splunk execution improves
Downside RiskLimited barring macro deterioration

Peer Comparison Snapshot

CompanyYieldP/E (fwd)Dividend GrowthBalance Sheet Strength
Cisco2.6%~16xConsistentVery Strong
IBM3.4%~15xModestModerate
Juniper2.9%~14xFlatModerate

Entry Strategy – Optional Price Zones

  • Buy Below $58: More favorable value with >3% yield
  • Hold Near $61: Fair value supported by FCF and guidance
  • Trim Above $65: Price may run ahead of fundamentals without improved security results

Verdict

At $61.29, Cisco is fairly valued. It offers:

  • A sustainable 2.6% dividend backed by robust FCF
  • Upside potential tied to AI, Splunk, and enterprise cloud adoption
  • Low downside risk for investors seeking capital preservation and steady income

This isn’t a deep value pick—but it’s a solid hold or add-on-dips candidate for dividend-focused portfolios.


Subscribe for No-Jargon, Real-Earnings Analysis

Get breakdowns tailored to real investors—no jargon, no hype.
Follow @SWOTstock or subscribe to our blog for structured, honest takes on earnings.


Disclaimer

This is not investment advice. All analysis is based solely on Cisco’s official financial report and earnings call transcript. Always do your own due diligence.


Leave a comment

Leave a comment