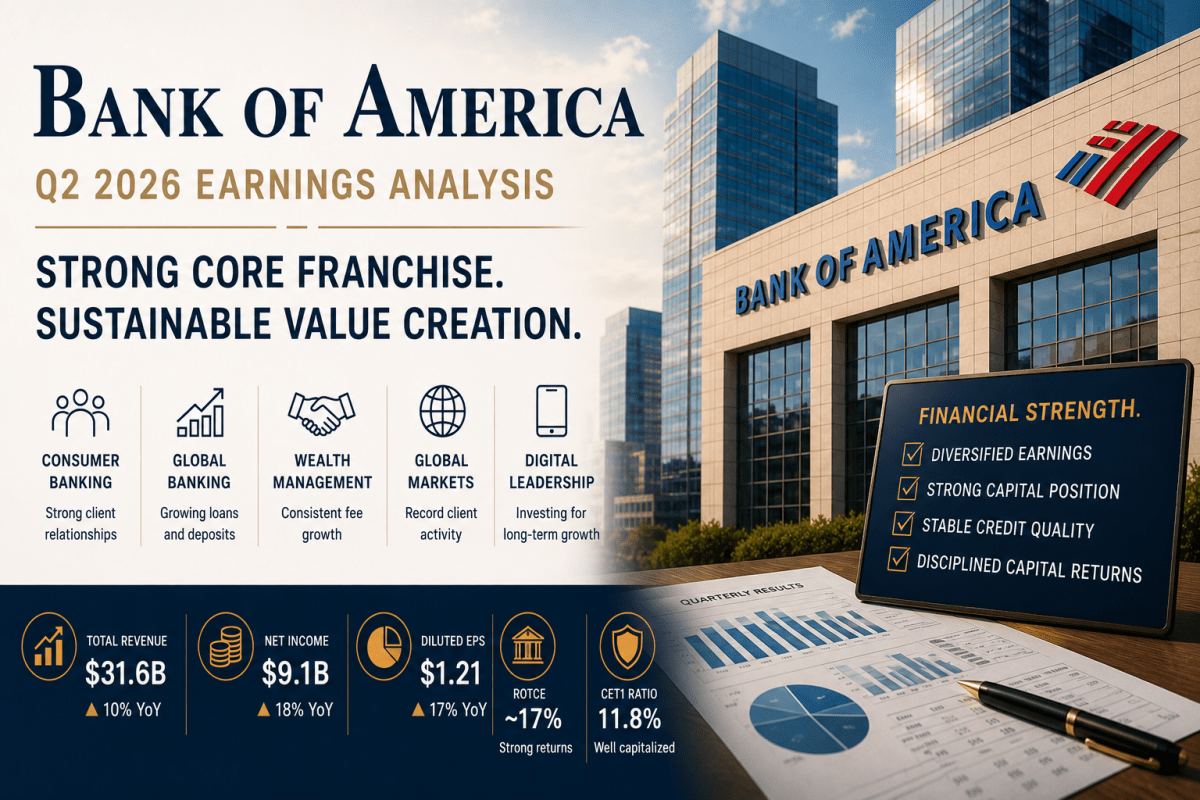
Bank of America Q2 2026 Earnings Analysis: Strong Core Banking Franchise Supports Higher Fair Value

Bank of America reported a robust second quarter with revenues of $31.6 billion and net income of $9.1 billion, reflecting strong performance across its diverse business segments. Despite initial market caution, the company’s earnings stability and growth in net interest income suggest long-term resilience. The estimated fair value of shares is approximately $64.

TL;DR Summary

Bank of America (BAC:NYSE) delivered an impressive second quarter, reporting strong revenue and earnings growth driven by broad-based contributions across Consumer Banking, Wealth Management, Global Banking, and Global Markets. More importantly, the company’s core banking franchise continued to strengthen through growing net interest income, stable credit quality, and robust capital generation.

While the market initially reacted cautiously before the shares recovered during the trading session, our independent analysis suggests the quarter reinforced the long-term investment thesis rather than fundamentally changing it. We estimate a probability-weighted fair value of approximately $64 per share, indicating the stock is modestly undervalued but not yet a “fat pitch.”


Quarter Recap

Bank of America reported another strong quarter that highlighted the resilience of its diversified business model. Revenue reached $31.6 billion, while net income increased to $9.1 billion, resulting in diluted earnings per share of $1.21.

Unlike quarters where performance depends heavily on one business segment, Q2 demonstrated strength across multiple earnings engines. Consumer Banking continued to benefit from healthy client activity, Wealth Management generated steady fee income, Global Banking experienced improved commercial engagement, and Global Markets delivered strong client-driven trading results.

Perhaps more importantly for long-term investors, management reaffirmed confidence in net interest income growth and reported stable credit quality, suggesting that the company’s earnings strength extends beyond short-term market activity.


Key Highlights

  • Revenue increased to $31.6 billion.
  • Net income reached $9.1 billion.
  • Diluted EPS increased to $1.21.
  • Net interest income continued to grow, with management expecting full-year results toward the upper end of previous guidance.
  • ROTCE remained around 17%, demonstrating efficient capital utilization.
  • Consumer and commercial credit quality remained stable.
  • Capital ratios continued to support dividends, share repurchases, and future growth investments.

SWOT Analysis

Bank of America’s latest quarter reinforces the strength of one of the largest banking franchises in the United States. The company continues to benefit from a diversified earnings base, disciplined capital management, and a stable deposit franchise. However, banking remains inherently cyclical, and investors should continue monitoring interest rates, credit quality, and economic conditions.

Strengths

  • Diversified earnings franchise (+8% to +12%)
    • Strong contributions from Consumer Banking, Wealth Management, Global Banking, and Global Markets reduce dependence on any single business segment.
  • Growing core net interest income (+6% to +10%)
    • Continued NII growth reinforces the recurring earnings power of the core banking business.
  • Excellent profitability and capital efficiency (+5% to +8%)
    • ROTCE around 17% demonstrates strong returns on shareholder capital.
  • Strong capital position (+3% to +6%)
    • Healthy capital supports continued dividends, share repurchases, and resilience during economic downturns.
  • Stable credit quality (+2% to +5%)
    • No evidence of broad-based deterioration in the loan portfolio.

Weaknesses

  • Interest-rate sensitivity (-6% to -10%)
    • Future earnings remain influenced by changes in interest rates and deposit pricing.
  • Cyclical capital markets businesses (-4% to -8%)
    • Trading and investment banking revenues naturally fluctuate with market conditions.
  • Moderate long-term growth profile (-3% to -6%)
    • As a mature banking franchise, growth is expected to remain steady rather than rapid.

Opportunities

  • Continued investment banking recovery (+5% to +9%)
    • Improved corporate activity could further expand fee income.
  • Digital banking and AI productivity (+4% to +7%)
    • Ongoing technology investments should improve efficiency while strengthening customer relationships.
  • Higher shareholder returns (+3% to +6%)
    • Strong capital generation creates additional flexibility for dividends and share repurchases.

Threats

  • Economic slowdown and higher credit losses (-8% to -15%)
    • A recession would reduce loan demand while increasing credit costs.
  • Margin compression from lower interest rates (-6% to -10%)
    • Lower net interest income would reduce recurring earnings.
  • Regulatory changes (-3% to -7%)
    • Higher capital requirements could reduce future returns on equity.

Valuation Scenarios

Although Q2 demonstrated strong operating momentum, valuation should reflect both the quality of the franchise and the cyclical nature of banking. Rather than assuming today’s earnings represent either a permanent peak or a temporary anomaly, we evaluate three possible scenarios.

Bear Case — $52 (25%)

Assumes weaker net interest income, softer capital markets activity, modestly higher credit costs, and a lower valuation multiple.

Base Case — $64 (50%)

Assumes stable net interest income, healthy credit quality, continued profitability, and valuation multiples consistent with historical norms.

Bull Case — $74 (25%)

Assumes sustained earnings growth, continued strength across multiple business segments, accelerating shareholder returns, and modest valuation expansion.

Probability-Weighted Fair Value

Combining these scenarios produces a probability-weighted fair value of approximately $64 per share.


Verdict

Bank of America continues to demonstrate why it remains one of the highest-quality banking franchises in the United States. Its diversified earnings base, strong deposit franchise, disciplined capital allocation, and healthy balance sheet provide resilience across different economic environments.

Importantly, this conclusion is based primarily on the company’s official financial disclosures rather than market narratives or analyst opinions.

Following the earnings release, the market initially responded cautiously before the shares recovered later in the trading session. Our independent assessment suggests that investors ultimately recognized the quality of the quarter while continuing to evaluate the sustainability of future earnings.

At current prices, Bank of America appears modestly undervalued relative to our estimated intrinsic value of approximately $64 per share. While the valuation is attractive for long-term investors, it does not yet provide the wide margin of safety typically associated with a “fat pitch.”


Call to Action

Did you reach the same conclusion after reading Bank of America’s earnings report?

Do you believe the market is correctly valuing the company’s long-term earnings power, or is there still upside that investors have yet to recognize?

Share your thoughts in the comments, and follow SWOTstock for independent earnings analysis based on official company disclosures rather than market consensus.


Disclaimer

This article is intended for educational and informational purposes only and should not be considered financial advice or a recommendation to buy or sell any security. The analysis is based primarily on Bank of America’s official financial disclosures and management commentary, supplemented by independent valuation reasoning. Investors should conduct their own research and consider their individual financial circumstances before making investment decisions.


💼 JPMorgan Q3 2025 Earnings — The Fortress Bank Tightens Its Grip on Stability

JPMorgan Chase’s Q3 2025 results showcase strong performance with EPS of $5.07 and a net income of $13.7 billion. Investment banking surged 25%, and AI efficiencies are enhancing operations. The stock, currently at $308, appears undervalued with a fair value of $328, making it a solid choice for long-term investors.

TL;DR Summary

JPMorgan Chase (JPM:NYSE) once again proved why it’s considered Wall Street’s fortress.
Third-quarter earnings beat expectations, investment banking is rebounding, and AI-driven efficiency is quietly reshaping operations.
At around $308 per share, the stock looks slightly undervalued with a fair value near $328 — steady upside for long-term value investors.


Quarter Recap

On October 14, 2025, JPMorgan reported EPS $5.07 on $46.4 billion in revenue, up about 9 percent year over year.
Net income reached $13.7 billion, with ROTCE 24 percent and ROE 20 percent, both exceptional for a global bank.
The company raised its full-year net interest income guidance to roughly $93 billion (excluding Markets), signaling confidence in margin stability.

CEO Jamie Dimon described the U.S. economy as “resilient but still pressured,” while emphasizing that AI adoption is already driving measurable productivity gains across fraud detection, operations, and client service.


Key Highlights

  • Investment banking surged 25 percent year over year, led by stronger M&A and equity underwriting.
  • Net interest income continued to climb, supported by robust consumer deposits.
  • Wealth and asset management hit record levels: $4.7 trillion AUM with $80 billion in net inflows.
  • Capital strength: CET1 ratio rose to 14.3 percent; management plans ≈ $30 billion in dividends and buybacks.
  • Credit quality: Card loss rates normalized to ~2.6 percent — still well below pre-pandemic levels.

Market response was positive: the stock climbed roughly 3 percent to $310 following the release, as investors rewarded its steady execution.


SWOT Analysis (12-Month Price-Impact View)

Strengths (+ $15 to + $25)

  • Industry-leading ROE (20 %) and ROTCE (24 %) sustain premium valuation.
  • Fortress capital position (CET1 14.3 %) supports $30 B capital return program.
  • AI and automation enhance efficiency and risk controls.
  • Diversified revenue mix limits cyclicality across business lines.

Weaknesses (– $10 to – $18)

  • Deposit costs rising faster than loan yields — NII growth plateau ahead.
  • Consumer credit losses slowly normalizing.
  • Technology and compliance investments pressure short-term margins.

Opportunities (+ $8 to + $20)

  • Revival in deal-making and capital markets fees.
  • Continued wealth inflows boost recurring revenues.
  • Efficiency gains from AI could add ~3 % EPS growth through 2026.

Threats (– $12 to – $20)

  • Potential U.S. slowdown reducing loan demand.
  • Basel III Endgame rules may tighten capital buffers.
  • Global market volatility could curb trading income.
A bar graph illustrating the SWOT analysis for JPMorgan Chase's Q3 2025 price impact range, featuring four colored bars representing strengths, weaknesses, opportunities, and threats, with corresponding estimated price impact values.
SWOT analysis of JPMorgan’s price impact range for Q3 2025, highlighting strengths, weaknesses, opportunities, and threats.

Valuation Scenarios

  • Bull (+ 20 %) → $370
    • Net interest income stays high, AI efficiency adds ~3 % to EPS, and P/B expands to 1.9×.
  • Base (+ 5 %) → $325
    • Stable credit costs and moderate growth support 1.7× P/B multiple.
  • Bear (– 10 %) → $277
    • Economic soft landing turns shaky; credit loss > 3 %, multiple compresses to 1.5×.

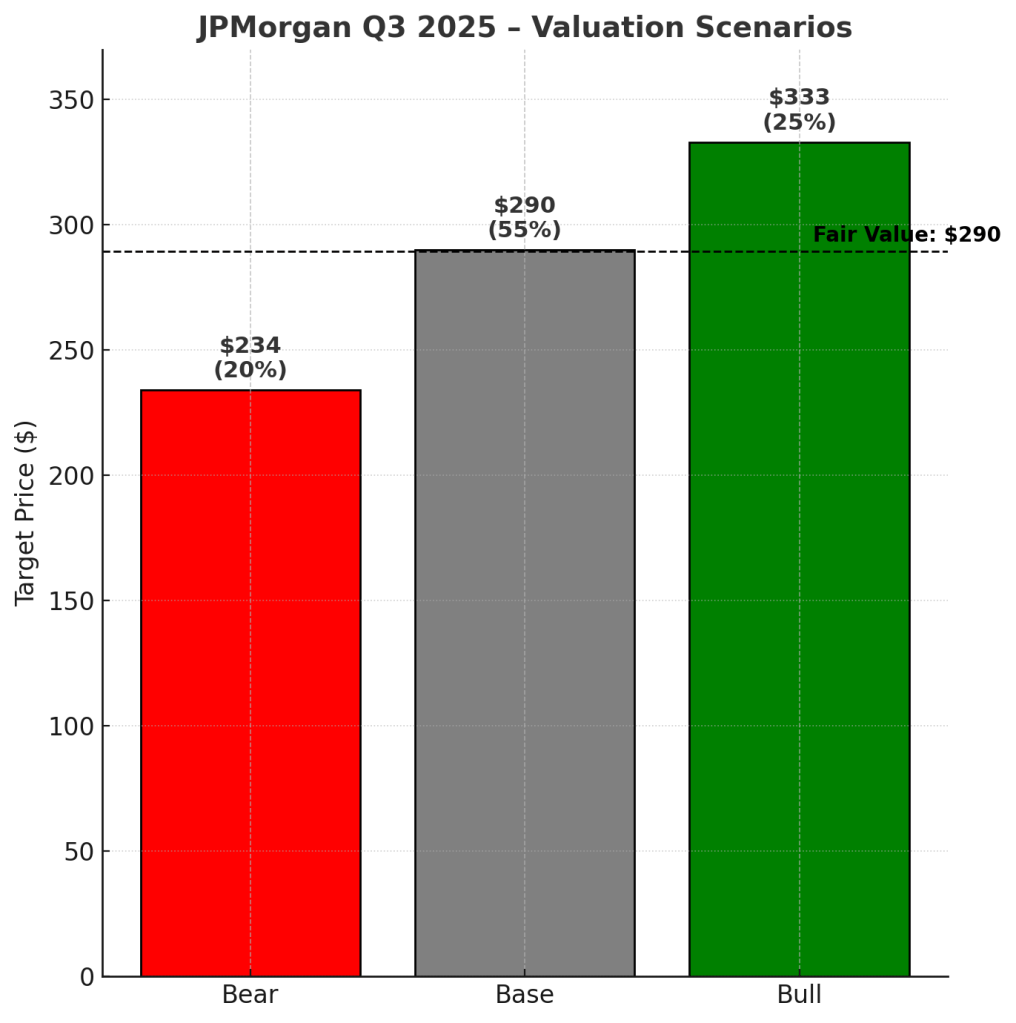
Probability-weighted fair value: ≈ $328 per share, implying a 6–7 % upside from the current $308.

Bar chart illustrating valuation scenarios for JPMorgan in Q3 2025, with target prices for Bear ($234), Base ($290), and Bull ($333), highlighting the fair value at $290.
JPMorgan Q3 2025 Valuation Scenarios: Bear, Base, and Bull target prices with fair value highlighted.

Fair Price Assessment

The valuation rests on JPMorgan’s own fundamentals — not sentiment.
At 24 percent ROTCE and 1.7× book value, shares reflect fortress-level returns with room for modest re-rating.
AI efficiency and buybacks should sustain mid-single-digit EPS growth, keeping the fair price range between $315 and $340.


Verdict

JPMorgan is the definition of a fortress value stock — disciplined, diversified, and resilient.
It won’t outpace Silicon Valley, but its consistency and capital strength make it a cornerstone holding for long-term DIY value investors.
If you’re seeking steady dividends and defensive growth in an uncertain rate environment, this remains one of the best-managed banks in the world.


Call to Action

Track how AI efficiency unfolds across JPMorgan’s business lines in the coming quarters.
If those gains compound like its interest income, the “fortress bank” might quietly build its next growth engine.


Disclaimer

This analysis is for informational purposes only and is based solely on JPMorgan Chase’s official Q3 2025 financial report and earnings call transcript.
It does not constitute investment advice or a recommendation to buy or sell securities.


JPMorgan vs. Citigroup: How Q1 Set the Tone for a Pivotal Q2 2025

Featured image displaying JPMorgan and Citi logos side by side on a blue background with “vs.” between them, representing a comparison of their Q1 2025 earnings performance.

TL;DR:
JPMorgan Chase (NYSE: JPM) and Citigroup (NYSE: C) kicked off 2025 with strong Q1 earnings, bolstered by solid trading performance and robust net interest income. But as Q2 earnings approach, both banks face persistent macroeconomic uncertainty, cautious client sentiment, and a potentially slower investment banking environment. Here’s how Q1 played out—and what investors should be watching this July.


Q1 Recap: Momentum With a Hint of Caution

U.S. megabanks are heading into Q2 earnings season on the back of a strong start to 2025. JPMorgan Chase and Citigroup delivered better-than-expected first-quarter results, supported by healthy interest income, strong trading activity, and improved cost discipline. Yet, under the surface, both management teams signaled caution—highlighting inflation, geopolitical risk, and client conservatism as emerging themes.

Let’s break down how each bank performed and what might lie ahead.


JPMorgan: Trading Desk Strength and Rate Tailwinds

JPMorgan reported Q1 net revenue of $46 billion, up 8% year-over-year, and net income of $14.6 billion, with earnings per share at $5.07, beating expectations. The strength came from two key engines:

  • Net interest income, which jumped to $23.4 billion thanks to favorable rate conditions and sustained loan growth.
  • Trading revenues, which surged 21% to $9.7 billion—fueled by a 48% jump in equities trading, a record quarter for that unit.

Investment banking fees rose 12%, signaling resilience in select M&A and debt market deals. However, credit provisions increased to $3.3 billion, suggesting a more conservative stance heading into a potentially rockier second half.

CEO Jamie Dimon struck a familiar note of pragmatism, warning about “considerable turbulence” from inflation, fiscal deficits, and geopolitical instability—even as those same forces have benefited JPM’s market-facing businesses.

Q2 Watchlist for JPM:

  • Can trading continue to outperform amid summer market activity?
  • Will loan growth in consumer and commercial lending remain resilient?
  • Are credit provisions hinting at broader credit concerns?

Citigroup: Cost Discipline and Trading Surprise

Citigroup also posted a solid Q1, with net income of $4.1 billion, up 21% from a year ago, and revenue of $21.6 billion. Earnings per share came in at $1.96, topping consensus. What stood out was the mix of trading performance and improved cost controls.

  • Markets revenue rose 12%, with equities trading jumping 23%.
  • Operating expenses declined 5%, aided by lower FDIC assessments and progress on Citi’s restructuring efforts.
  • RoTCE reached 9.1%, and the bank’s CET1 capital ratio stood at a strong 13.4%.

Still, Citi added $2.7 billion in credit provisions, increasing total reserves to $22.8 billion—a sign that management is not letting its guard down. CEO Jane Fraser struck a constructive tone, citing the U.S. economy’s relative resilience but emphasizing the need to remain cautious amid global uncertainty.

Q2 Watchlist for Citi:

  • Are cost control and digital investments delivering lasting operating leverage?
  • Will interest margins hold up if rates remain steady?
  • Can investment banking recover in a choppy macro environment?

JPMorgan vs. Citi: Diverging Strengths, Common Risks

While both banks had strong first quarters, they are navigating Q2 with different levers of strength.

Table comparing JPMorgan and Citigroup Q1 2025 performance across trading revenue, cost discipline, investment banking activity, and risk management. Highlights JPMorgan’s strength in equities trading and diversified earnings versus Citigroup’s progress in cost control and capital efficiency.

JPMorgan’s scale and diversified earnings base give it an edge in uncertain times, while Citigroup is gaining ground through cost cuts and capital efficiency. But both are facing the same headwinds: tighter client budgets, regulatory pressure, and slowing deal activity.


What to Expect in Q2 2025

Q2 earnings will likely test whether Q1 momentum is sustainable. Trading may stay strong if market volatility persists, but credit costs and weak investment banking pipelines could put pressure on profits.

Key themes to monitor:

  • Credit quality: Are rising reserves signaling trouble ahead?
  • Capital deployment: Will management remain cautious with buybacks and dividends?
  • Tech and efficiency: Are digital investments translating into real operating leverage?

Don’t overlook the earnings call commentary from Jamie Dimon and Jane Fraser—their tone will offer key signals about how megabanks view the second half of the year.


Verdict

JPMorgan remains the more defensive play, with a proven trading engine and diversified model. Citigroup is a potential turnaround story, showing credible progress on efficiency. Both face macro uncertainty, but also opportunity—especially if rate conditions stay supportive and markets remain active.

Retail investors should stay focused on margin resilience, capital trends, and credit provisioning as the next round of earnings unfolds.


Follow SWOTstock for JPMorgan and Citigroup Q2 earnings detail SWOT analysis and valuation scenarios.


Leave a comment