Goldman Sachs Q1 2026 Earnings: Strong Quarter, But Is the Market Already Pricing Peak Conditions?

Goldman Sachs reported a strong Q1 2026, achieving nearly 20% ROE and record equities trading, positioning it as a leading investment bank. However, stock prices reflect already priced-in performance, indicating a fair valuation with limited safety if earnings normalize. The overall investment perspective suggests a cautious hold rather than aggressive buying.

TL;DR Summary

Goldman Sachs (GS:NYSE)delivered a powerful Q1 2026 with nearly 20% ROE and record equities trading, reinforcing its position as a top-tier investment bank. However, the stock’s muted reaction suggests that much of this strength was already priced in. At current levels, Goldman looks fairly valued — but without a clear margin of safety if earnings normalize.


Quarter Recap

Goldman Sachs reported a strong start to 2026, with performance driven primarily by its institutional businesses.

Revenue came in at $17.23 billion, with net earnings of $5.63 billion and EPS of $17.55. The firm delivered an impressive 19.8% ROE, signaling highly efficient capital deployment during the quarter.

The standout was Global Banking & Markets, particularly equities trading, which reached record levels. Investment banking also showed signs of recovery, suggesting that deal activity is gradually returning after a slower period.

At the same time, Asset & Wealth Management continued to grow steadily, with assets under supervision reaching $3.65 trillion, providing a more stable earnings base over time.


Key Highlights

  • Record equities trading revenue, reinforcing Goldman’s leadership in institutional markets
  • Investment banking recovery underway, supporting future earnings visibility
  • ROE near 20%, significantly above historical mid-cycle levels
  • Continued capital return through buybacks and dividends
  • FICC trading declined YoY, showing uneven performance across segments
  • Asset & Wealth Management scaling with consistent net inflows

SWOT Analysis

Goldman Sachs is currently operating at a high level of profitability, but the key question for investors is whether this represents a new structural baseline or a cyclical peak.
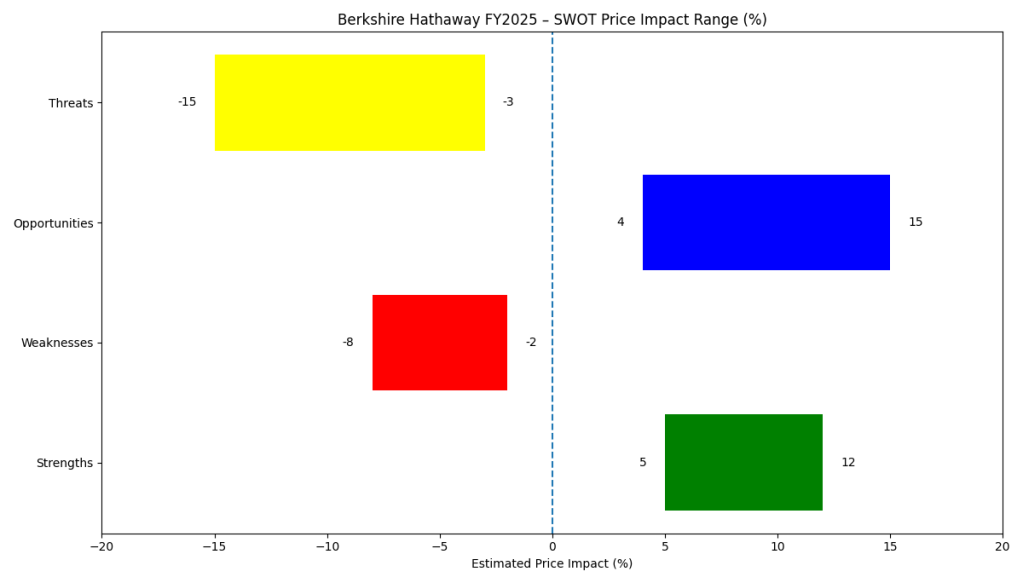
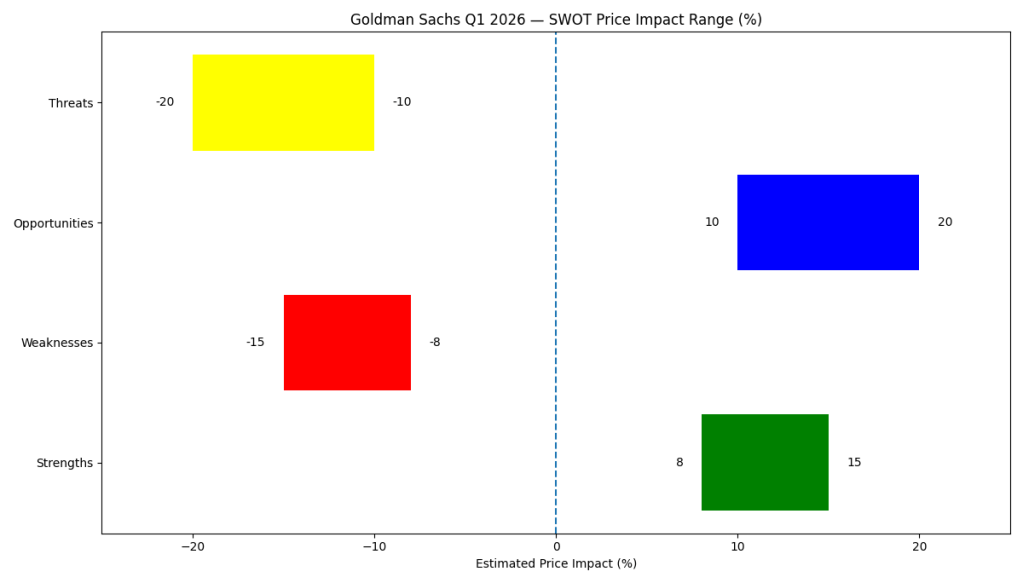
Strengths

  • Exceptional profitability with ROE near 20%, supporting premium valuation potential (+8% to +15%)
  • Dominant equities trading franchise with record revenues (+6% to +12%)
  • Investment banking showing recovery, providing cyclical upside (+4% to +8%)
  • Strong capital return through buybacks and dividends (+5% to +10%)

Weaknesses

  • Earnings remain highly dependent on market conditions (-8% to -15%)
  • Weakness in FICC trading highlights uneven revenue mix (-4% to -8%)
  • Limited recurring revenue compared to peers with stronger fee-based models (-5% to -10%)
  • Cost structure still relatively elevated for a cyclical business (-3% to -6%)

Opportunities

  • Growth in Asset & Wealth Management can stabilize earnings over time (+6% to +12%)
  • Continued recovery in capital markets (M&A, IPOs) (+5% to +10%)
  • Strategic shift toward more durable institutional and wealth revenue (+4% to +8%)
  • Operating leverage in strong markets can drive margin expansion (+5% to +10%)

Threats

  • Macro and geopolitical volatility impacting capital markets (-10% to -20%)
  • Risk of trading normalization after record equities performance (-8% to -15%)
  • Regulatory pressures limiting capital return (-4% to -8%)
  • Market already pricing strong performance, limiting upside (-5% to -10%)
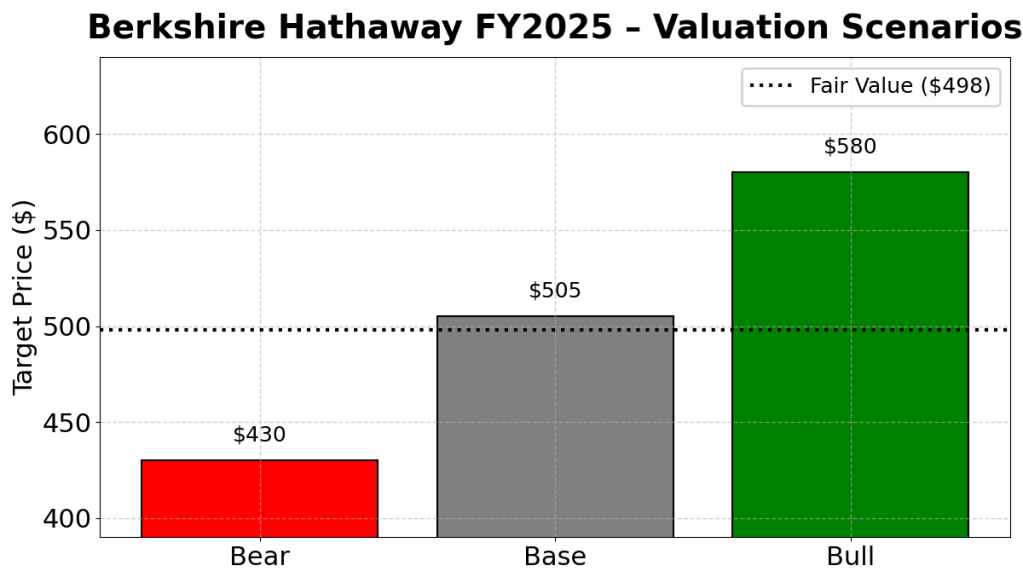
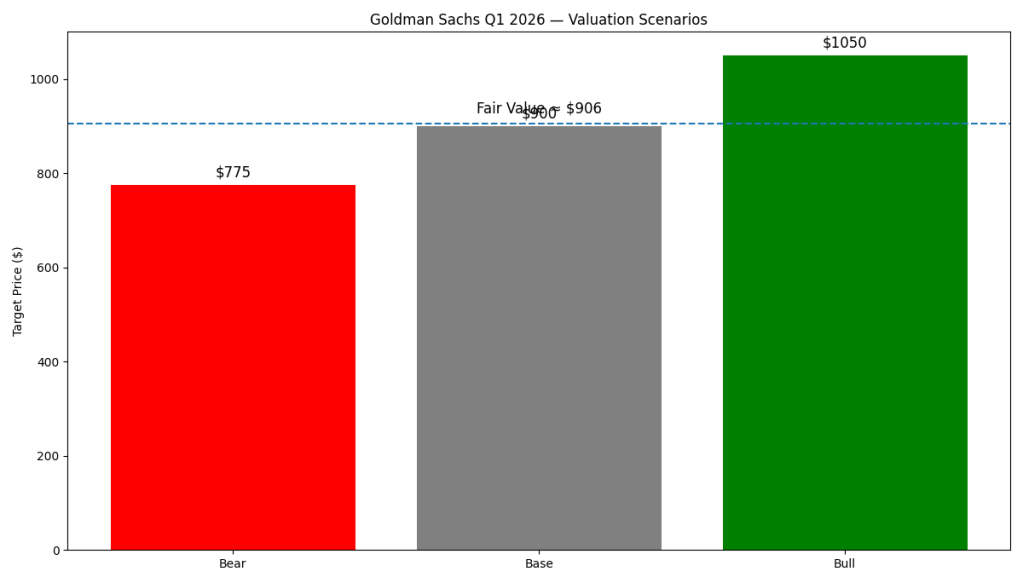
Goldman Sachs Q1 2026 SWOT chart showing estimated stock price impact ranges: strengths +8% to +15%, opportunities +10% to +20%, weaknesses -8% to -15%, and threats -10% to -20%, with a central zero baseline.
SWOT price impact analysis for Goldman Sachs following Q1 2026 earnings, highlighting strong upside from equities trading and capital markets recovery, balanced against cyclical risks and macro uncertainty.

Valuation Scenarios

The valuation hinges on whether current earnings represent sustainable performance or cyclical strength.

Bear Case (~$750–$800)

If trading normalizes and investment banking recovery slows, ROE could fall back to the mid-teens. In this case, Goldman would trade closer to historical valuation ranges.

Base Case (~$880–$920)

If current earnings are largely sustainable with moderate growth, the stock remains around current levels, supported by steady capital return.

Bull Case (~$1,000–$1,100)

If capital markets remain strong and Goldman sustains near-20% ROE, the stock could justify a premium multiple and move higher.

👉 Probability-weighted fair value: ~$900

Goldman Sachs Q1 2026 valuation scenarios chart showing Bear case at $775, Base case at $900, and Bull case at $1,050, with a probability-weighted fair value line at approximately $906.
Valuation scenarios for Goldman Sachs following Q1 2026 earnings, illustrating downside risk if trading normalizes, balanced against upside potential from sustained capital markets strength and high ROE.

Verdict

Goldman Sachs is executing extremely well, but the investment case now depends less on performance and more on sustainability.

At current levels, the stock reflects:

  • Strong earnings momentum
  • High expectations
  • Limited margin of safety

For value investors, this is a hold rather than an aggressive buy.


Call to Action

If you’re tracking financial stocks, the key question is:

👉 Do you believe Goldman’s current earnings are sustainable — or cyclical?

Follow SWOTstock for more earnings breakdowns that cut through the noise and focus on what actually drives stock prices.


Disclaimer

This analysis is for informational purposes only and does not constitute financial advice. Investors should conduct their own research and consult with a qualified financial advisor before making investment decisions.


Berkshire Hathaway FY2025: Still a Compounding Machine — But Is There Enough Margin of Safety?

Berkshire Hathaway’s FY2025 results showed a slight decline in operating earnings and increased insurance volatility, yet the company holds a record cash position of over $370B. With disciplined capital allocation under CEO Greg Abel, the stock trades near its intrinsic value at around $500 per share, offering limited margin of safety for value investors.

TL;DR Summary

Berkshire Hathaway’s FY2025 results showed softer operating earnings and insurance volatility, yet the balance sheet has never been stronger. With over $370B in cash and disciplined capital allocation under Greg Abel, the long-term compounding story remains intact. However, at around $500 per BRK.B share, the stock appears close to fair value. For DIY value investors, the key question is no longer quality — it’s margin of safety.


Quarter Recap

Berkshire Hathaway reported FY2025 results in late February 2026. Operating earnings declined modestly year-over-year, reflecting weaker insurance underwriting and investment writedowns. GAAP net income was more volatile due to mark-to-market adjustments in the equity portfolio.

Despite softer earnings, Berkshire ended the year with a record cash position exceeding $370B. Share repurchases remained limited, and the company was a net seller of equities during much of the year.

This was also the first full annual report under CEO Greg Abel, marking a formal transition from the Buffett era while maintaining the same capital allocation philosophy.


Key Highlights

• Operating earnings declined modestly year-over-year

• Insurance underwriting results weakened in Q4

• Cash & equivalents reached record levels (~$370B+)

• No major acquisition deployed despite large liquidity

• Leadership transition to Greg Abel formally underway

• Equity portfolio remains concentrated in high-quality holdings


SWOT Analysis

Berkshire is not an earnings-momentum stock. It is a capital allocator built for long-term compounding. FY2025 did not break the story — but it did test investor patience. For value investors, durability matters more than quarterly growth.


Strengths

• Massive cash position providing downside protection and acquisition optionality

Estimated Price Impact: +5% to +12%

• Diversified operating businesses (insurance, rail, energy, manufacturing)

Estimated Price Impact: +4% to +8%

• Long-standing capital allocation discipline now reinforced under Abel

Estimated Price Impact: +3% to +7%

• High-quality equity portfolio generating dividends and embedded gains

Estimated Price Impact: +4% to +10%


Weaknesses

• Insurance earnings volatility and catastrophe exposure

Estimated Price Impact: -3% to -8%

• Slower organic growth relative to high-growth market leaders

Estimated Price Impact: -2% to -6%

• Leadership transition uncertainty in post-Buffett era

Estimated Price Impact: -3% to -7%


Opportunities

• Large-scale acquisition during market downturn

Estimated Price Impact: +8% to +15%

• Improvement in insurance pricing cycle

Estimated Price Impact: +4% to +9%

• Opportunistic share buybacks below intrinsic value

Estimated Price Impact: +5% to +10%


Threats

• Major insurance catastrophe event

Estimated Price Impact: -6% to -15%

• Significant equity portfolio drawdown

Estimated Price Impact: -5% to -12%

• Prolonged inability to deploy excess cash effectively

Estimated Price Impact: -3% to -8%

Horizontal SWOT price impact bar chart for Berkshire Hathaway FY2025 showing full percentage ranges: Strengths (+5% to +12%), Opportunities (+4% to +15%), Weaknesses (-8% to -2%), and Threats (-15% to -3%), with a vertical dashed zero line.
Berkshire Hathaway FY2025 SWOT price impact ranges highlight asymmetric downside risk from insurance volatility (-15%) versus upside potential from capital deployment and earnings normalization (+15%).

Valuation Scenarios (based on BRK.B)

Berkshire should be valued on normalized operating earnings rather than GAAP net income due to mark-to-market volatility. Using conservative assumptions aligned with Buffett-style valuation discipline:


Bear Case

Flat or declining operating earnings

14× earnings multiple

No major capital deployment

Implied Price Target: $430

Probability: 30%


Base Case

4–6% operating earnings growth

16× earnings multiple

Gradual capital deployment

Implied Price Target: $505

Probability: 50%


Bull Case

8–10% earnings growth

Successful large acquisition

18× earnings multiple

Implied Price Target: $580

Probability: 20%


Probability-Weighted Fair Value:

≈ $498

Vertical valuation scenarios bar chart for Berkshire Hathaway FY2025 showing Bear case at $430 (red), Base case at $505 (gray), and Bull case at $580 (green), with a dotted fair value line at $498.
Berkshire Hathaway FY2025 valuation scenarios range from $430 in a bear case to $580 in a bull case, with a probability-weighted fair value estimate of approximately $498 per share.

Verdict

Berkshire Hathaway remains one of the highest-quality capital allocators in the world. The balance sheet strength is extraordinary, and the business model remains durable.

However, at roughly $500 per BRK.B share, the stock trades close to intrinsic value under conservative assumptions. There is limited margin of safety unless earnings growth accelerates or a large acquisition creates incremental intrinsic value.

For DIY value investors, Berkshire is still a core compounding vehicle — but not a deep bargain today.


Call to Action

If you are building a long-term value portfolio, ask yourself:

Are you buying Berkshire for safety, or for upside?

Follow SWOTstock for structured, investor-focused earnings analysis grounded in intrinsic value logic — not headlines.


Disclaimer

This article is for informational purposes only and does not constitute investment advice. Investors should conduct their own research and consider their financial circumstances before making investment decisions.


Coca-Cola (KO) Q4 2025 Earnings: Steady Compounder or Fully Priced Defensive?

Coca-Cola reported stable Q4 and full-year 2025 results, with modest revenue growth and solid EPS. Guidance for 2026 points to mid-single-digit revenue growth and high-single-digit EPS growth. Valuation remains crucial, with fair value estimated between $60–$64. Investors must weigh the stock’s durability against its premium pricing.

TL;DR Summary

Coca-Cola delivered stable Q4 and full-year 2025 results, but nothing that changes the long-term thesis. Revenue slightly missed expectations, EPS was solid, and 2026 guidance points to mid-single-digit organic growth and high-single-digit EPS growth.

For DIY value investors, this remains a quality compounder — but valuation discipline matters. My fair value estimate sits around $60–$64, suggesting limited upside unless growth accelerates.


Quarter Recap

The Coca-Cola Company reported Q4 and full-year 2025 earnings on February 10, 2026.

Key takeaways from the quarter:

  • Q4 revenue grew modestly year-over-year but slightly missed consensus expectations
  • Global unit case volume increased ~1%
  • Net income rose modestly, reflecting stable margins
  • Full-year organic revenue growth was around ~5%
  • 2026 guidance calls for ~4–5% organic revenue growth and ~7–8% adjusted EPS growth

Nothing broke. Nothing accelerated dramatically either.

This is exactly what Coca-Cola has become: a steady, predictable, cash-flow-driven business.


Key Highlights

  • Volume resilience: Global volumes still growing despite mature markets
  • Pricing power intact: Revenue growth supported by pricing and mix
  • Margin stability: Operating discipline preserved profitability
  • Defensive profile maintained: Cash flow strength supports dividends and capital returns
  • Guidance steady, not exciting: Mid-single-digit organic growth outlook

The market reaction was mildly negative — largely due to the revenue miss and lack of upside surprise.


SWOT Analysis

Coca-Cola remains one of the most durable consumer franchises globally. However, valuation is the key variable. For a Type 2 value investor, the debate is not about survival — it is about growth durability versus multiple compression.

Strengths

  • Global brand dominance and pricing powerEstimated price impact: +5% to +10%
  • Strong free cash flow and dividend profileEstimated price impact: +4% to +8%
  • Stable operating marginsEstimated price impact: +3% to +6%

Weaknesses

  • Low organic volume growth (~1%)Estimated price impact: -3% to -6%
  • Premium valuation relative to growth rateEstimated price impact: -5% to -10%
  • Currency exposure from global footprintEstimated price impact: -2% to -5%

Opportunities

  • Expansion of zero-sugar and premium offeringsEstimated price impact: +4% to +9%
  • Emerging market per-capita consumption growthEstimated price impact: +5% to +12%
  • Operational acceleration under new leadershipEstimated price impact: +2% to +6%

Threats

  • Sugar taxes and regulatory pressuresEstimated price impact: -4% to -8%
  • Consumer trade-down in weaker macroEstimated price impact: -3% to -7%
  • Commodity cost volatilityEstimated price impact: -2% to -6%
SWOT price impact range chart for Coca-Cola (KO) Q4 2025 earnings showing estimated stock price impact ranges: Strengths +3% to +10%, Weaknesses -10% to -2%, Opportunities +2% to +12%, and Threats -8% to -2%, with X-axis starting at -15%.
Coca-Cola (KO) Q4 2025 SWOT price impact analysis. Strengths and Opportunities provide upside support of up to +10–12%, while valuation risk and growth limitations create downside exposure of -8% to -10%. Estimated fair value remains near current trading levels, suggesting limited multiple expansion without growth acceleration.

Valuation Scenarios

Coca-Cola is not a high-growth stock. It is a defensive compounder. That means valuation depends primarily on earnings durability and acceptable multiple range.

Assumptions:

  • 2025 adjusted EPS ≈ $2.60
  • 2026 expected EPS ≈ $2.80 (midpoint growth assumption)
  • Historical defensive P/E range: 20x–26x

Bear Case

  • Growth slows to ~3%
  • Multiple compresses to ~20x
  • Target price ≈ $52
  • Probability: 30%

Base Case

  • Organic growth ~4–5%
  • Multiple stabilizes around ~23x
  • Target price ≈ $60
  • Probability: 50%

Bull Case

  • EPS growth accelerates to ~9–10%
  • Multiple expands to ~25x
  • Target price ≈ $65
  • Probability: 20%

Probability-Weighted Fair Value

Estimated fair value: ~$58–$62

Valuation scenarios chart for Coca-Cola (KO) Q4 2025 showing Bear case target price of $52, Base case $60, and Bull case $65, with a dotted fair value line at $59.
Coca-Cola (KO) Q4 2025 valuation scenarios. The Bear case assumes multiple compression and slower growth ($52), the Base case reflects steady compounding ($60), and the Bull case assumes modest acceleration and premium valuation ($65). Probability-weighted fair value is approximately $59, indicating limited upside without growth acceleration.

Verdict

Coca-Cola remains one of the safest consumer franchises globally. But at today’s valuation, investors are paying for stability, not acceleration.

For value investors:

  • Below $58 → Attractive entry
  • Around $60 → Fair value
  • Above $65 → Fully priced defensive

This is no longer a turnaround story. It is a disciplined compounding story.


Call to Action

If you are a DIY value investor, the key question is simple:

Are you buying durability at a reasonable price — or paying a premium for safety?

Follow SWOTstock for structured, valuation-driven analysis on quality businesses.


Disclaimer

This analysis is for informational and educational purposes only and does not constitute investment advice. Always conduct your own research and consult a financial professional before making investment decisions.