TL;DR Summary
Bank of America (BAC:NYSE) delivered a strong Q1 2026, with solid growth in net interest income, a rebound in investment banking, and stable credit quality. The market reacted positively, but not aggressively—because the key question hasn’t changed:
Is BAC a stable compounder deserving a higher multiple, or still a rate-sensitive cyclical bank?
Our probability-weighted valuation lands at ~$54, suggesting the stock is fairly valued today, with upside dependent on capital markets recovery and downside tied to credit normalization.
Quarter Recap
Bank of America opened 2026 with a quarter that looked stronger than many investors expected. Revenue reached $30.3 billion, up 7% year-over-year, while net income came in at $8.6 billion, translating into $1.11 EPS.
What stands out is not just the headline numbers, but the composition. Net interest income grew to $15.7 billion, signaling that the bank is still extracting value from its deposit base even in a maturing rate cycle. At the same time, capital markets activity showed clear signs of recovery, with investment banking fees and trading revenue both moving higher.
Underneath, credit quality remains controlled. Net charge-offs are still relatively low at 0.48% of loans, and capital remains strong with a CET1 ratio of 11.2%.
This is not a one-dimensional quarter—it’s a balanced earnings engine at work.
Key Highlights
The quarter tells a simple story: Bank of America is no longer relying on just one lever.
Net interest income continues to provide a stable base, while capital markets are beginning to add cyclical upside. Consumer banking and wealth management remain steady contributors, and the balance sheet continues to expand with loan growth holding firm.
At the same time, nothing in the quarter suggests excessive risk-taking. Credit remains benign, and capital levels leave room for continued shareholder returns.
That combination—growth without visible stress—is exactly what investors look for in a large-cap bank.
SWOT Analysis (with price impact ranges)
The real debate for Bank of America is not whether the business is performing—it clearly is. The question is how much of that performance is sustainable, and how the market should value it.
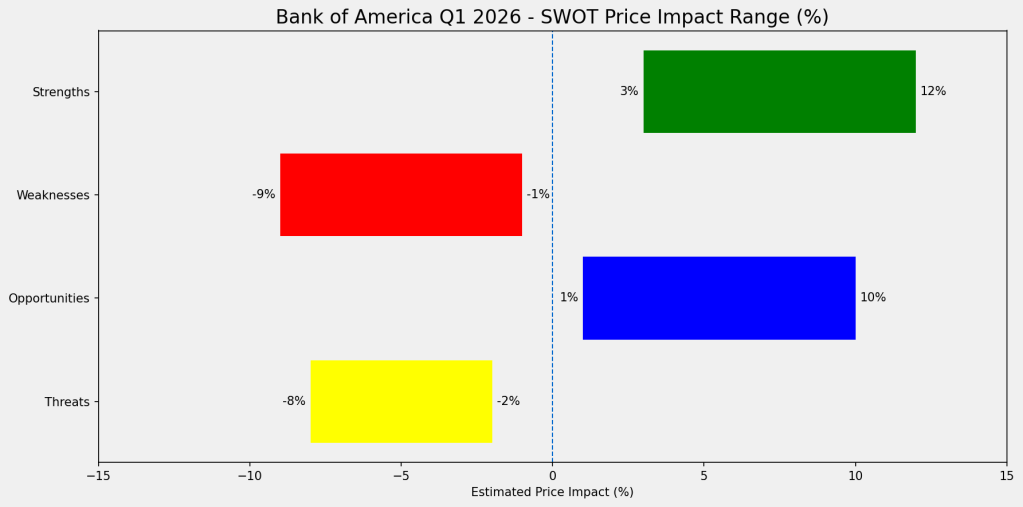
Strengths
Bank of America’s biggest strength today is the resilience of its earnings engine. Net interest income continues to grow despite concerns around peak rates, which suggests that its deposit franchise remains a structural advantage.
At the same time, the bank benefits from a highly diversified model. Consumer banking, wealth management, trading, and investment banking all contributed meaningfully in the quarter, reducing reliance on any single driver.
Finally, capital and credit remain solid. With a CET1 ratio above 11% and low charge-offs, the bank has both downside protection and flexibility to return capital.
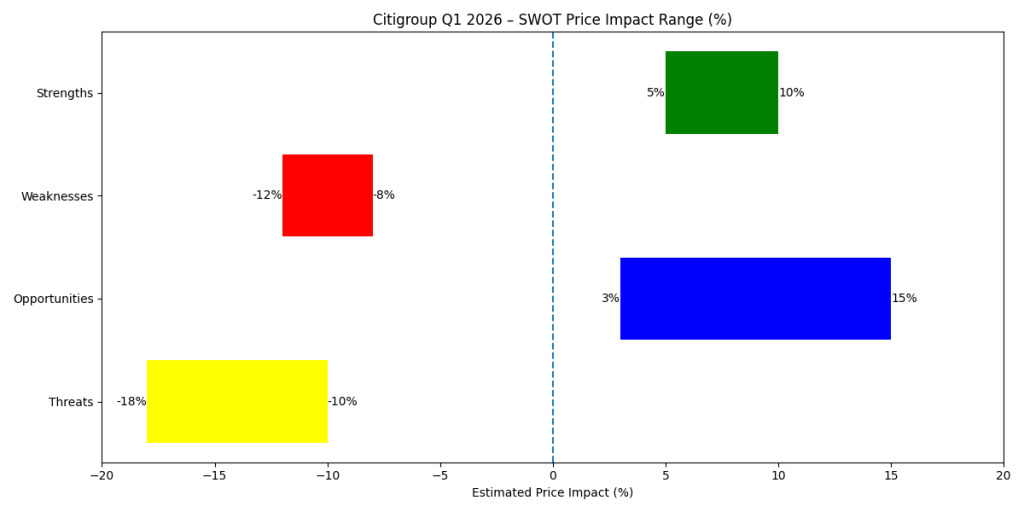
Estimated price impact:
+3% to +10% across key strength drivers
Weaknesses
The core weakness is one that has always defined Bank of America: its sensitivity to interest rates. While that worked in its favor during rate hikes, it becomes a constraint if rates move lower more quickly than expected.
In addition, the bank’s scale creates structural inefficiencies. Large universal banks face higher fixed costs—technology, compliance, and operations—which limits operating leverage compared to smaller or more focused peers.
Estimated price impact:
-3% to -8%
Opportunities
The biggest opportunity lies in capital markets. The rebound in investment banking and trading activity in Q1 may be the early stages of a broader recovery cycle. If deal activity continues to improve, this could provide a meaningful boost to earnings beyond what is currently priced in.
At the same time, steady loan growth and a stable deposit base create a foundation for organic expansion without taking on excessive risk.
Estimated price impact:
+4% to +12%
Threats
The main risks are cyclical. Credit costs are currently low, but they are unlikely to stay there indefinitely. A normalization cycle could quickly pressure earnings if provisions rise faster than expected.
Macro uncertainty also remains a key factor. A combination of rate cuts and economic slowdown would hit both net interest income and loan growth at the same time.
Estimated price impact:
-5% to -12%
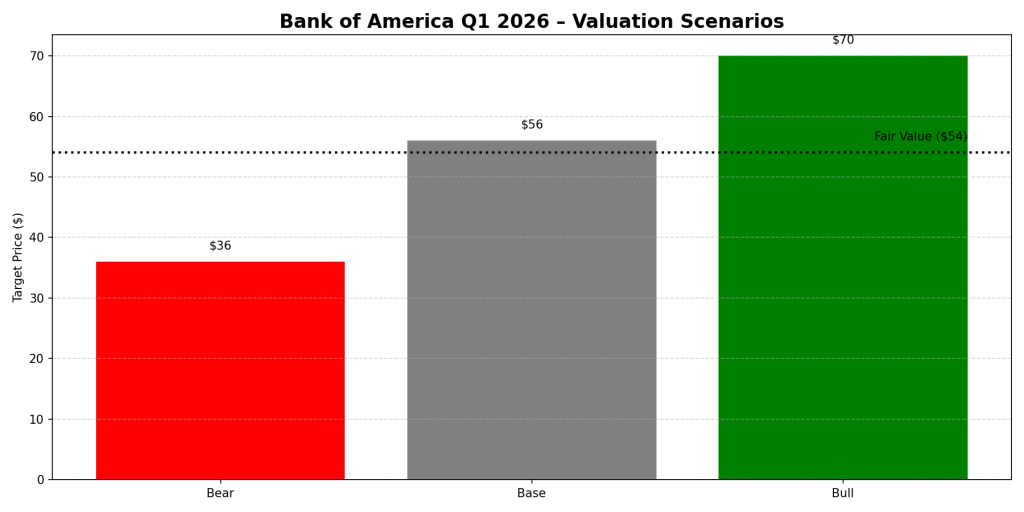
Valuation Scenarios
The valuation comes down to how the market interprets this mix of strengths and risks.
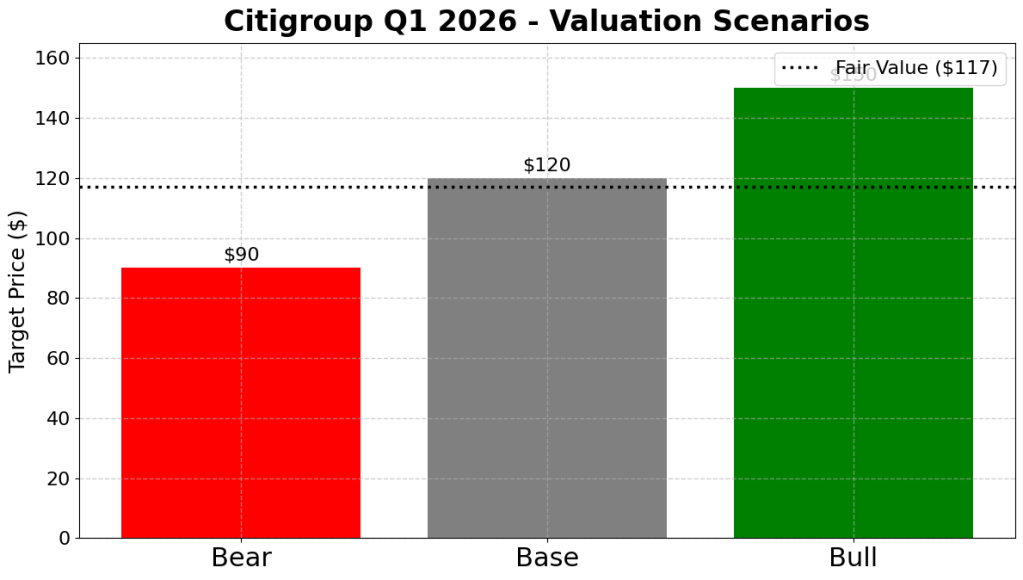
Base Case (50%) — Stable but not re-rated
In the most likely scenario, Bank of America continues to deliver steady earnings with moderate growth. Net interest income stabilizes, capital markets gradually recover, and credit costs rise slightly but remain manageable.
Fair value: $52–$60
Bull Case (25%) — Earnings upgrades + multiple expansion
In a more optimistic scenario, capital markets rebound strongly and credit remains benign. The market begins to see Bank of America as a high-quality compounder rather than a cyclical bank, leading to both earnings upgrades and multiple expansion.
Fair value: $64–$75
Bear Case (25%) — Macro and credit pressure
In the downside scenario, rates fall faster than expected while credit costs rise. Earnings decline and the market applies a lower multiple, reflecting increased uncertainty.
Fair value: $32–$40
Probability-Weighted Valuation
Bringing these scenarios together results in a weighted fair value of approximately:
~$54 per share
At current levels, this suggests the stock is fairly valued, with limited margin of safety.
Verdict
Bank of America is executing well. The business is strong, diversified, and supported by solid capital and credit fundamentals.
But the stock is no longer cheap. The market is already pricing in a stable base case, leaving investors dependent on either a capital markets-driven upside surprise or exposed to a credit or macro-driven downside.
For value-oriented investors, this becomes a question of timing rather than conviction.
Call to Action
Would you buy Bank of America at $55, or wait for a better entry point closer to the downside scenario?
Let me know how you’re thinking about large-cap banks in this cycle.
Disclaimer
This analysis is for informational purposes only and does not constitute investment advice. All assumptions are based on Bank of America’s official earnings release and investor materials for Q1 2026. Investors should conduct their own research before making investment decisions.