TL;DR
Goldman Sachs (GS:NYSE) Q3 results provide further evidence that financing and asset management are strengthening its earnings base. Equities financing revenue increased 96% year over year, management and other fees rose 22%, and long-term asset inflows reached $97 billion. These businesses give Goldman more ways to earn beyond advisory and underwriting transactions.
The SWOT picture remains mixed. Growing fees and financing support the franchise, but trading remains a major earnings driver. The investment-banking backlog declined, wholesale-loan impairments increased credit provisions, and capital ratios faced pressure as the balance sheet expanded.
Annualized ROE was 18.7%, or approximately 19.8% after adding back the disclosed charitable-contribution effect. The central question is whether Goldman can sustain strong profitability through less favorable markets.
Our assessment is that Goldman’s earnings base is improving, while cyclicality remains material. The valuation scenarios translate that business assessment into an estimated fair value of approximately $845.
Quarter Recap
Goldman Sachs reported $18.68 billion of net revenue and $5.29 billion of net earnings for the quarter ended September 30, 2026. Revenue increased 23% and net earnings increased 29% from a year earlier. Diluted EPS rose 39% to $17.01.
The sequential comparison was less favorable. Revenue declined 8%, net earnings declined 20%, and EPS fell from $20.98 in Q2. Annualized ROE declined from 23.5% to 18.7%, while the efficiency ratio increased from 57.4% to 60.5%.
One disclosed expense deserves attention: charitable contributions reduced Q3 EPS by approximately $1.00 and annualized ROE by 1.1 percentage points. Adding that back would put quarterly ROE at approximately 19.8%. This helps explain part of the sequential decline, although a contribution-adjusted quarter still does not establish sustainable earning power.
For the first nine months, Goldman generated $56.24 billion of revenue, $17.55 billion of net earnings and $55.56 in diluted EPS. Annualized ROE was 20.7%. Goldman separately disclosed that employee share-based award tax benefits increased nine-month EPS by approximately $3.20 and ROE by 1.1 percentage points. The quarterly contribution adjustment and nine-month tax benefit cover different periods and should not be combined mechanically.
Market Reaction
Goldman released its results before the U.S. market opened on October 13. Shares had closed at $893.95 on October 12, then opened at $923.00—a 3.25% increase.
The opening rally did not hold. The stock traded between $891.01 and $931.00 and closed at $891.91, down 0.23% from the previous close and 3.37% from the opening price. The close was just $0.90 above the session low. Reported volume was approximately 4.94 million shares.
That price structure shows an initial positive response followed by a reversal. It does not establish why traders changed course or which financial disclosure influenced them most. We therefore do not attribute the reversal to analyst expectations, a particular earnings item or a macroeconomic narrative.
The relevant valuation change is clearer: the October 13 price was approximately 23% below the $1,152.07 July reference price used in our Q2 article. Investors are now paying substantially less for each dollar of Goldman’s book value.
Key Highlights
Global Banking & Markets generated $13.46 billion of revenue, up 32% year over year but down 13% from Q2. Investment-banking fees increased 21% year over year to $3.22 billion, including $1.65 billion of advisory revenue. However, the investment-banking fees backlog decreased from Q2, primarily in advisory, and was slightly below year-end 2025.
Equities revenue reached $6.44 billion, up 72% year over year. Within that total, financing revenue increased 96% to $3.37 billion and rose 3% sequentially. FICC revenue was $3.47 billion, down 1% year over year and 24% from Q2.
Asset & Wealth Management revenue increased 14% year over year to $5.05 billion. Management and other fees reached $3.59 billion, up 22%, while incentive fees were $587 million. Assets under supervision reached $4.097 trillion, with $97 billion of long-term net inflows. Alternative-investment assets reached $491 billion, and quarterly gross third-party alternatives fundraising was $37 billion.
Credit-loss provisions increased to $368 million from $102 million in Q2, primarily reflecting wholesale-loan impairments. The standardized CET1 ratio declined from 12.9% to 12.4%. Goldman returned $4.49 billion to common shareholders, including $3 billion in repurchases, while book value increased to $372.64 per share and tangible book value reached $341.43.
SWOT Analysis
Goldman’s financing and management-fee businesses provide support for sustainable profitability. Its exposure to market activity, expenses, credit costs and regulatory capital still makes that profitability variable. The investment question is how these factors affect normalized returns and the valuation investors can reasonably attach to them.
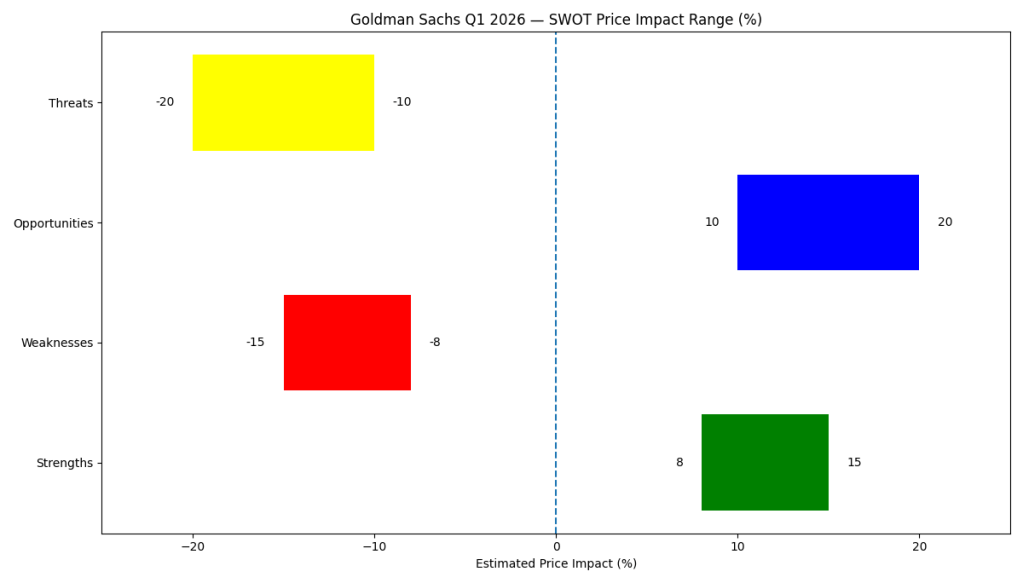
The price-impact ranges below are illustrative one-year sensitivities against $891.91. They overlap and must not be added. [SENS] identifies a model-derived sensitivity; [HEUR] identifies an outcome requiring additional judgment. None is company guidance or a statistically estimated forecast.
For transparency, the earnings sensitivities use book value of $372.64, a 10% required return and 4% long-term book-value growth. Under that model, one percentage point of sustainable ROE changes value by approximately $62 per share. An additional $1 billion of annual pre-tax profit corresponds to roughly a 5% price sensitivity, using reported average common equity and an assumed 20% tax rate.
Strengths
- Equities financing franchise — [SENS] +3% to +8%. Financing revenue of $3.37 billion, up 96% year over year, demonstrates the scale of the franchise. If it supports $0.6–$1.6 billion more annual pre-tax profit than an assumed normalized baseline, higher sustainable ROE translates into the indicated valuation effect.
- Growing management-fee base — [SENS] +2% to +6%. Management and other fees increased 22%, supported by a larger asset base and continued inflows. An additional $0.4–$1.2 billion of annual pre-tax profit from retained assets and fees would support this sensitivity.
- Advisory and underwriting capacity — [SENS] +2% to +5%. Investment-banking fees increased 21% year over year. Additional annual pre-tax profit of $0.4–$1.0 billion relative to normalized activity would raise sustainable ROE and modeled value.
Weaknesses
- Variable markets revenue — [SENS] −4% to −11%. Equities and FICC revenue declined sequentially, alongside lower firmwide ROE. A further 0.6–1.6 percentage-point reduction in sustainable ROE would produce this valuation sensitivity.
- Higher cost base — [SENS] −3% to −8%. Operating expenses increased 20% year over year. If the expense run rate leaves $0.6–$1.6 billion less annual pre-tax profit after revenue normalizes, sustainable returns and modeled value would decline.
- Platform Solutions losses — [SENS] −1% to −3%. The segment reported a $95 million quarterly pre-tax loss. Continued annual losses of $0.2–$0.6 billion, compared with a break-even assumption, would reduce earnings and valuation.
Opportunities
- Rebuilding the banking backlog — [HEUR] +3% to +8%. The backlog declined, but replenishment followed by transaction completion could add revenue. The range assumes $0.6–$1.6 billion of additional annual pre-tax profit; Goldman has not disclosed a backlog dollar amount from which to derive that outcome.
- Alternative-investment fee growth — [HEUR] +3% to +8%. Alternative assets reached $491 billion, with related management fees up 43% year over year. Continued fundraising and fee conversion could support an assumed $0.6–$1.6 billion of additional annual pre-tax profit. This overlaps the management-fee strength.
- Improved operating efficiency — [HEUR] +3% to +8%. Revenue holding up while expenses grow more slowly could improve the 60.5% efficiency ratio. The range assumes $0.6–$1.6 billion of annual pre-tax improvement and overlaps the revenue and expense factors above.
Threats
- Capital-markets slowdown — [SENS] −5% to −15%. Equities alone generated about a third of quarterly revenue. A $1–$3 billion reduction in annual pre-tax profit across trading, underwriting and advisory would reduce sustainable ROE and modeled value.
- Higher credit costs — [SENS] −3% to −10%. Provisions increased while total loans rose to $276 billion. An additional $0.5–$2 billion of annual provisions in a weaker credit environment would produce this earnings sensitivity.
- Higher required shareholder return — [SENS] −8% to −14%. Holding illustrative ROE at 18.7% and growth at 4%, increasing the required return from 10% to 10.5%–11% reduces justified price-to-book by approximately this amount. This is a valuation stress assumption, not a claim about an observed rate change.
- Less capital flexibility — [HEUR] −3% to −8%. Standardized CET1 declined as risk-weighted assets increased. If capital constraints materially restrict distributions or profitable activity, a lower valuation multiple could follow. The reported ratio change alone does not establish the assumed price effect.
Valuation Scenarios
We value Goldman through the relationship between sustainable ROE, book value and the required shareholder return. The model uses reported book value of $372.64 and the formula P/B = (ROE − g) ÷ (r − g), where g represents sustainable book-value growth after distributions and r is the required return.
This is a steady-state intrinsic-value model. It assumes a durable return and growth relationship, making the result sensitive to those assumptions. The ROE estimates, growth rates, required returns and probabilities are our judgments.
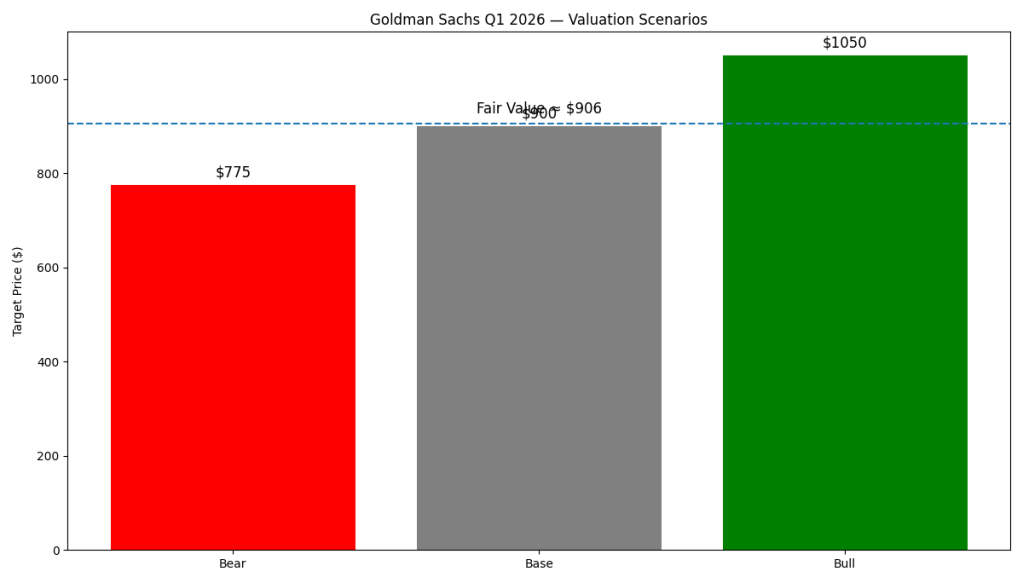
Bear Case — Approximately $510
The bear case assumes weaker capital-markets activity, slow backlog replenishment, higher credit costs and only partial offsets from fee growth.
We use 14% sustainable ROE, 3% long-term growth and an 11% required return. That produces a justified price-to-book ratio of 1.375 times and an unrounded value of $512.38.
With a 25% scenario probability, this case implies approximately 43% downside from $891.91.
Base Case — Approximately $870
The base case assumes financing and management fees remain strong, trading normalizes, investment banking continues generating revenue and credit costs remain manageable.
We use 18% sustainable ROE, 4% growth and a 10% required return. The resulting 2.33-times book valuation produces an unrounded value of $869.49.
With a 55% probability, this case is approximately 3% below the reference price. An 18% sustainable ROE already gives Goldman meaningful credit for franchise quality and improved profitability.
Bull Case — Approximately $1,190
The bull case assumes Equities financing retains much of its growth, the banking pipeline rebuilds, alternative fees expand and efficiency improves.
We use 21% sustainable ROE, 5% growth and a 10% required return. That produces a 3.20-times book valuation and an unrounded value of $1,192.45.
With a 20% probability, this case implies approximately 34% upside. It requires Goldman to maintain returns close to its recent nine-month performance through less favorable conditions.
Probability-Weighted Fair Value
Weighting the unrounded values produces $844.81, rounded to approximately $845 per share.
That is about 8% below our previous $920 estimate. The base-case value actually increases slightly because book value grew while the base assumptions remained unchanged. The central estimate falls because we assign a higher bear probability, a lower bull probability and a less generous bull-case profitability and required-return combination.
These are changes in our assessment of durability and uncertainty, rather than company forecasts.
Verdict
Goldman’s strong Q3 results and lower share price have materially improved the valuation picture since July. The firm continues generating substantial financing, advisory and management-fee revenue, although declining backlog, higher credit provisions and reduced capital flexibility warrant attention.
At $891.91, the shares trade at approximately 2.39 times book value and 2.61 times tangible book value. Using a 10% required return and 4% growth, that price implies sustainable ROE of approximately 18.4%. The July reference price implied returns close to 23% under the same assumptions.
The valuation hurdle is therefore more achievable today. Nevertheless, our probability-weighted fair value is approximately $845, making the reference price about 5.6% above that estimate.
For a DIY value investor, Goldman is close to the base-case value but still offers little margin of safety. A mechanical 20% discount to the $845 fair value would imply approximately $676; a 25% discount would imply approximately $634. Those levels are illustrative purchase disciplines, not predictions that the stock will fall there.
Call to Action
Is an implied sustainable ROE of roughly 18.4% a reasonable price to pay for Goldman’s franchise—or should a cyclical financial business offer a larger cushion?
The next reports should help test whether the banking backlog rebuilds, financing revenue remains durable, management fees continue expanding and capital keeps pace with balance-sheet growth.
Follow SWOTstock for earnings analysis and independent valuation scenarios as that evidence develops.
Disclaimer
This article is for informational and educational purposes only and does not constitute investment advice or a recommendation to buy or sell securities. Valuation scenarios and sensitivity ranges depend on assumptions and may differ materially from actual outcomes. Investors should assess their own objectives, risk tolerance and financial circumstances.