Bank of America Q4 2025 Earnings — Waiting for the Rate Cycle, Not the Franchise

Bank of America reported strong Q4 results, with earnings and revenue exceeding expectations despite pressures on net interest income. The bank’s capital ratios remain healthy, and credit costs are controlled. However, future performance hinges on interest rate normalization and capital return timing. Current stock valuation suggests a hold or accumulate strategy for investors.

TL;DR Summary

Bank of America (BAC: NYSE) delivered a solid Q4, reinforcing the durability of its core franchise even as net interest income continued to soften. Earnings exceeded expectations, credit remained well-behaved, and capital levels stayed comfortably above regulatory requirements. At around $53 per share, the stock appears fairly valued to modestly undervalued, but the upside case remains dependent on rate normalization and capital return timing, not quarterly momentum. BAC is no longer under stress — but it is still in a waiting phase.


Quarter Recap

Bank of America reported Q4 2025 results that confirmed earnings resilience amid an unfavorable interest-rate backdrop. Revenue and EPS came in ahead of expectations, supported by strong trading performance and diversified fee income, which partially offset continued pressure on net interest income.

While credit costs remained within management’s guidance, the quarter also made clear that NII has not yet bottomed, delaying the point at which operating leverage can meaningfully re-emerge. Management reiterated confidence in the underlying strength of the U.S. consumer and emphasized balance-sheet flexibility, while acknowledging that the pace and shape of rate cuts will be the dominant driver of earnings normalization into 2026.


Key Highlights

  • Revenue of approximately $28.4B and EPS of $0.98 exceeded consensus expectations
  • Net interest income continued to decline, with no clear trough yet visible
  • Trading and markets revenues provided meaningful offset to rate-driven pressure
  • Credit costs remained controlled and within guided ranges
  • Capital ratios stayed comfortably above regulatory minimums, preserving long-term buyback optionality

SWOT Analysis

Bank of America’s Q4 results reinforce a familiar conclusion: this is a high-quality, systemically important bank whose valuation is now driven less by execution risk and more by macro timing and capital deployment.
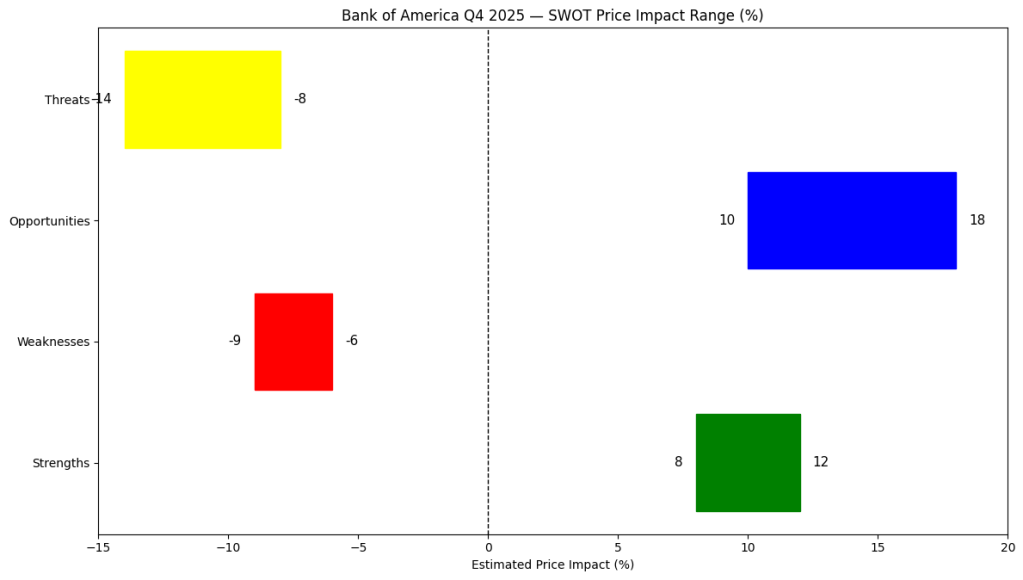
Strengths

Bank of America’s scale, deposit franchise, and balance-sheet strength continue to provide earnings durability across cycles. Despite ongoing NII pressure, the bank generated mid-teens returns on tangible equity, underscoring the resilience of its core business. Diversified revenue streams — particularly in markets and fee-based businesses — further reduce earnings volatility and reinforce franchise quality.

Estimated price impact: +$5 to +$8

Weaknesses

Net interest income remains under pressure as asset yields reset faster than deposit costs can adjust. In addition, the bank’s structurally high cost base limits operating leverage in a slow-growth environment, delaying the inflection point investors are waiting for.

Estimated price impact: −$4 to −$7

Opportunities

A gradual rate normalization cycle would allow NII to stabilize and support a re-rating toward historical mid-cycle valuation multiples. In parallel, the eventual re-acceleration of share buybacks could materially enhance EPS growth even in a modest revenue environment, providing a powerful lever for shareholder value creation.

Estimated price impact: +$6 to +$10

Threats

The primary downside risk remains macro-driven. Faster-than-expected rate cuts would extend margin pressure, while any material deterioration in consumer or commercial credit would quickly overwhelm incremental operating improvements. Regulatory intervention also remains a persistent, though less immediate, structural risk.

Estimated price impact: −$6 to −$12

Horizontal SWOT price-impact chart for Bank of America Q4 2025 showing estimated percentage ranges: strengths and opportunities on the positive side, weaknesses and threats on the negative side, with a dashed zero reference line.
Bank of America Q4 2025 — Estimated SWOT price-impact ranges based on earnings results and macro assumptions. Early-stage view, not a final valuation

Valuation Scenarios

Bank of America should be valued using a normalized return-on-tangible-equity framework, rather than quarter-to-quarter earnings volatility. The scenarios below reflect how changes in rates, credit, and capital returns would shape valuation outcomes.
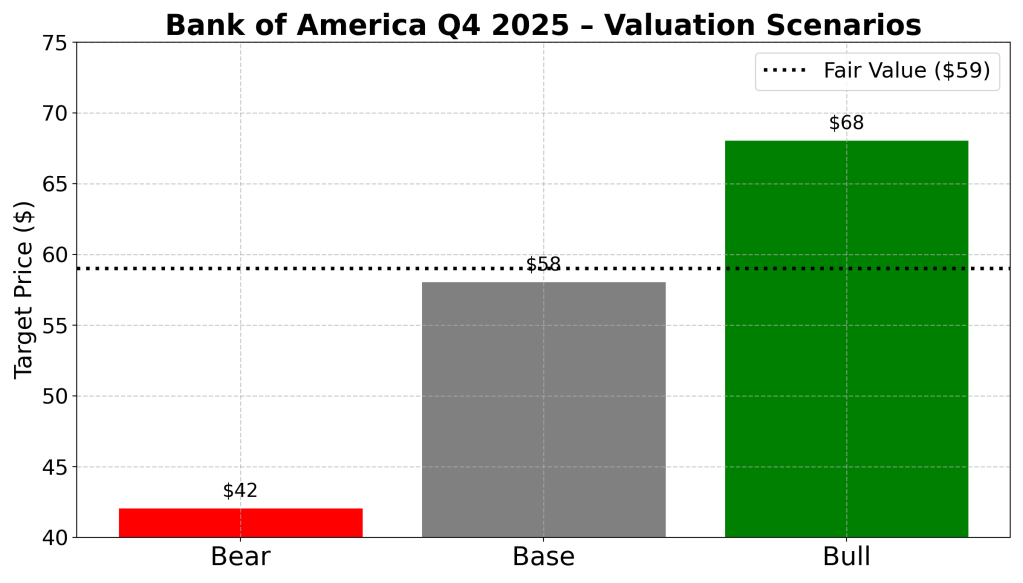
Bear Scenario

This scenario assumes prolonged NII pressure combined with rising credit costs, forcing valuation toward the lower end of historical P/TBV ranges.

  • Assumptions: NII continues to decline into 2026; credit losses rise above guidance; buybacks remain constrained
  • Implied value: ~$40–43

Base Scenario

This reflects the current market view: NII bottoms over the next several quarters, credit normalizes, and modest capital returns resume.

  • Assumptions: Mid-teens ROTCE; stable credit; gradual buyback recovery
  • Implied value: ~$55–60

Bull Scenario

This scenario assumes a supportive rate environment, stable credit, and an accelerated buyback cycle that lifts EPS growth.

  • Assumptions: NII stabilization; strong capital return; valuation re-rates toward mid-cycle multiples
  • Implied value: ~$65–70

Probability-Weighted Fair Value

Taking these scenarios together, Bank of America’s fair value clusters around:

~$57–60 per share

Valuation scenarios bar chart for Bank of America Q4 2025 showing bear, base, and bull target prices, with a dotted horizontal line indicating the probability-weighted fair value estimate.
Bank of America Q4 2025 — Bear, base, and bull valuation scenarios with probability-weighted fair value based on normalized earnings and capital return assumptions

Verdict

Bank of America has moved decisively out of the “stress discount” phase, but it has not yet entered a clear re-rating regime. Q4 confirmed franchise strength and earnings durability, yet the stock remains anchored by uncertainty around rates and the timing of capital return acceleration.

At current levels, BAC is best viewed as a hold or accumulate-on-weakness position for DIY value investors. The upside case exists, but it is macro-dependent, not execution-driven. Patience — rather than optimism — remains the dominant investment requirement.


Call to Action

If you own Bank of America, the key question is no longer balance-sheet safety — that has been reaffirmed. The real question is whether the rate cycle will cooperate in unlocking earnings normalization and capital returns. For investors building resilient, valuation-aware portfolios, BAC remains a credible component — but not yet a high-conviction opportunity.


Disclaimer

This analysis is for informational purposes only and does not constitute investment advice. Always conduct your own research and consider your financial situation before making investment decisions.


Citigroup Q4 2025: Execution Is Improving, But the Valuation Still Depends on Delivery

Citigroup’s Q4 2025 results indicate improvement in core businesses despite profitability challenges due to restructuring costs. While investment banking fees rebounded and net interest income rose, returns on tangible equity remain below targets. The stock, anchored to tangible book value, offers potential upside if management executes consistently, appealing to patient value investors.

TL;DR Summary

Citigroup’s (NYSE: C) Q4 2025 results show real progress in core businesses like Services and Banking, but reported returns are still weighed down by restructuring costs and one-time items. The stock remains anchored to tangible book value, making this a classic execution-driven value story. Upside exists if management delivers on its 10–11% RoTCE target, but patience is required.


Quarter Recap

Citigroup reported Q4 2025 earnings that reflect a bank still in transition. Reported profitability declined year over year due largely to a Russia-related exit charge, but underlying operating trends were more constructive. Revenue held up across key businesses, investment banking activity rebounded sharply, and management emphasized that major geopolitical overhangs are now largely behind the company.


Key Highlights

  • Net income of approximately $2.47 billion, impacted by a sizable one-time Russia exit loss
  • Reported EPS of $1.19, with underlying performance stronger when adjusting for notable items
  • Investment banking fees rose sharply year over year, signaling a recovery in deal activity
  • Net interest income increased year over year, supported by higher average rates
  • CET1 capital ratio of 13.2%, comfortably above regulatory requirements
  • Tangible book value per share of $97.06 provides a clear valuation anchor

SWOT Analysis

Citigroup’s investment case remains centered on whether management can convert improving operating trends into sustainably higher returns on tangible equity. The quarter reinforced both the opportunity and the risks embedded in that thesis.

Strengths

  • Services and institutional businesses continue to scale, improving the quality and durability of earnings (estimated price impact: +4% to +10%)
  • Strong rebound in investment banking fees highlights Citi’s relevance in large, complex transactions (+3% to +8%)
  • Capital strength and ongoing share buybacks provide downside support and optionality (+4% to +9%)
  • Clear tangible book value base gives value investors a concrete reference point (+2% to +6%)

Weaknesses

  • Reported RoTCE remains well below management’s 10–11% target, limiting valuation re-rating (−6% to −12%)
  • Expense growth and a high efficiency ratio continue to pressure near-term profitability (−4% to −10%)
  • Earnings remain vulnerable to one-time items during the restructuring phase (−2% to −6%)

Opportunities

  • Achieving the stated RoTCE target could justify a meaningful re-rating toward tangible book value or above (+8% to +18%)
  • Operating leverage from simplification and productivity initiatives could improve margins over time (+4% to +12%)
  • Excess capital above regulatory requirements supports continued capital return (+3% to +9%)

Threats

  • A turn in the credit cycle could quickly erode earnings and capital flexibility (−6% to −15%)
  • Rate and macro sensitivity remain meaningful, particularly for net interest income (−3% to −10%)
  • Execution risk persists if cost reductions fail to materialize as planned (−5% to −12%)
Citigroup Q4 2025 SWOT price impact chart showing estimated percentage upside and downside from strengths, weaknesses, opportunities, and threats for value investors.
Citigroup Q4 2025 SWOT price impact range. Estimated upside and downside drivers based on management commentary and valuation sensitivity around tangible book value.

Valuation Scenarios

For Citi, valuation is best framed using price-to-tangible book value, as returns on tangible equity are the primary driver of long-term multiple expansion. With TBVPS at $97.06, the range of outcomes depends largely on execution.

Bear Case

  • Assumes sub-par returns persist and credit or expense pressures rise
  • Valuation at ~0.8× tangible book
  • Implied value: ~$78

Base Case

  • Assumes steady progress toward management’s RoTCE target without full re-rating
  • Valuation at ~1.0× tangible book
  • Implied value: ~$97

Bull Case

  • Assumes credible delivery of 10–11% RoTCE with visible operating leverage
  • Valuation at ~1.2× tangible book
  • Implied value: ~$116

Probability-weighted fair value: approximately $95

Citigroup Q4 2025 valuation scenarios chart showing bear, base, and bull target prices with a dashed fair value line for value investors.
Citigroup Q4 2025 valuation scenarios. Bear, base, and bull price targets derived from tangible book value multiples and return-on-tangible-equity assumptions, with probability-weighted fair value highlighted.

Verdict

Citigroup remains a value investor’s execution bet. The stock is no longer distressed, but it is not yet priced for success. If management delivers on returns and expense discipline, today’s valuation leaves room for upside. If execution stalls, the stock risks remaining range-bound around tangible book value. For patient investors, Citi offers asymmetry — but not certainty.


Call to Action

If you’re tracking large U.S. banks from a value perspective, follow SWOTstock for earnings-driven breakdowns that focus on fundamentals, valuation discipline, and execution — not hype.


Disclaimer

This article is for informational purposes only and does not constitute investment advice. All analysis is based on publicly available company disclosures and reflects estimates and opinions at the time of writing. Investors should conduct their own research before making investment decisions.


Accenture Q1 FY2026 Earnings: A Wonderful Business, Still Waiting for Growth

Accenture reported strong fiscal Q1 2026 results, exceeding revenue and earnings expectations while managing margins and generating cash. However, growth remains cautious with low-single-digit revenue increases. AI demand is emphasized as crucial for long-term growth, yet short-term challenges persist. The stock is viewed as fairly valued at approximately $270.

TL;DR

Accenture  (ACN:NYSE) delivered another quarter of solid execution, beating expectations on revenue and earnings while maintaining margins and strong cash generation. AI demand continues to build, but management remains cautious on near-term revenue acceleration. At around $270, ACN appears fairly valued, with upside dependent on whether AI-led reinvention can meaningfully lift topline growth.


Quarter Recap

  • Fiscal Q1 2026 revenue came in at the high end of guidance, reflecting resilient enterprise demand despite a cautious macro environment.
  • Adjusted earnings grew faster than revenue, supported by disciplined cost control and modest operating leverage.
  • New bookings remained healthy, including continued momentum in AI-related transformation programs.
  • Management reiterated a cautious full-year outlook, emphasizing execution and long-term positioning rather than near-term acceleration.

Key Highlights

  • Revenue growth remained in the low- to mid-single-digit range, consistent with guidance.
  • Adjusted operating margins expanded modestly year over year.
  • Free cash flow supported ongoing dividends and share repurchases.
  • AI was framed as a core component of multi-year reinvention programs, not a standalone growth spike.
  • U.S. federal-related work continued to weigh on near-term growth visibility.

SWOT Analysis

Accenture’s investment profile reflects a balance between durable execution strength and a growth trajectory that remains steady rather than accelerating. The ranges below translate qualitative factors into estimated stock price impact.

Strengths

  • Deep enterprise relationships and recurring transformation demand (+8% to +12%)
  • AI embedded into large-scale reinvention programs, supporting long-term monetization (+6% to +10%)
  • Strong cash flow, balance sheet discipline, and shareholder returns (+4% to +6%)

Strengths — overall impact: +18% to +28%


Weaknesses

  • Low-single-digit organic revenue growth profile (–6% to –10%)
  • Continued softness in U.S. federal business (–4% to –7%)
  • Premium valuation leaves limited margin for disappointment (–5% to –8%)

Weaknesses — overall impact: –15% to –25%


Opportunities

  • Scaling AI-led reinvention programs across global enterprises (+10% to +18%)
  • Operating leverage if demand gradually normalizes (+6% to +10%)
  • Leadership role as an enterprise AI orchestrator across platforms and models (+5% to +8%)

Opportunities — overall impact: +21% to +36%


Threats

  • Prolonged enterprise budget caution delaying large transformation decisions (–10% to –15%)
  • Investor narrative around AI commoditization compressing consulting multiples (–8% to –12%)
  • Competitive pricing pressure from smaller firms and in-house teams (–5% to –8%)

Threats — overall impact: –23% to –35%

Accenture Q1 FY2026 SWOT price impact chart showing estimated stock impact ranges: strengths +18% to +28%, weaknesses −15% to −25%, opportunities +21% to +36%, and threats −23% to −35%, with a dashed zero reference line.

Valuation Scenarios

Accenture’s valuation outcome hinges less on margin execution—which remains strong—and more on whether AI-driven reinvention can re-accelerate revenue growth.

Using $270 as the current price anchor:

Bear Case

  • Revenue growth remains around 2–3%
  • Federal weakness persists and AI monetization is slower than expected
  • Valuation multiple compresses toward the lower end of historical ranges
  • Implied price: ~$209 (–22.5%)

Base Case

  • Revenue growth stabilizes around 4–5%
  • AI bookings convert gradually into revenue
  • Margins expand modestly, supporting high-single-digit EPS growth
  • Implied price: ~$290 (+7.5%)

Bull Case

  • AI-led reinvention drives sustained revenue acceleration above 6%
  • Enterprise spending cycle improves
  • Operating leverage supports double-digit EPS growth with modest multiple expansion
  • Implied price: ~$351 (+30%)

Fair Value Assessment

Applying a probability-weighted approach:

  • Bear: 25%
  • Base: 50%
  • Bull: 25%

This results in a probability-weighted fair value of approximately $285, or about 5–6% upside from current levels.

Accenture valuation scenarios chart based on Q1 FY2026 earnings, showing bear case price target of $209, base case $290, bull case $351, and a probability-weighted fair value of $285.

Verdict

Accenture remains a high-quality compounder with durable client relationships, strong execution, and disciplined capital returns. At around $270, the stock looks fairly valued rather than cheap. Downside is cushioned by cash flow and margins, but meaningful upside will require clearer evidence that AI-led reinvention can translate into sustained topline acceleration.


Call to Action

If you’re tracking enterprise AI adoption beyond the hype, follow SWOTstock for earnings-driven analysis that focuses on what actually moves stock prices.


Disclaimer

This article is for informational purposes only and does not constitute investment advice. All analysis is based on publicly available, official company disclosures and earnings call commentary. Investors should conduct their own research or consult a financial professional before making investment decisions.