Amazon Q3 2025 — AWS Re-Accelerates, Ads Surge, and AI Capex Sets the Stage for 2026

Amazon’s Q3 2025 results showed strong revenue growth at $180.2 billion, with AWS increasing by 18% and advertising up 20%. Operating income rose 29%, driven by logistics efficiencies. While high AI infrastructure investments present near-term challenges, management remains confident in long-term profitability, estimating a fair value of $216 per share.

TL;DR Summary

Amazon delivered a strong Q3 with accelerating AWS growth, booming advertising revenue, and expanding retail margins. While heavy AI infrastructure investments continue to shape near-term cash flow, management’s commentary signals high confidence in long-term returns. Our fair value sits around $215/share, anchored by official financials and steady earnings momentum.


Quarter Recap

Amazon’s Q3 2025 results highlighted a business firing on multiple cylinders. Revenue came in at $180.2 billion, rising 12% year over year on a constant-currency basis. AWS saw renewed momentum with 18% growth, driven by AI training and inference workloads scaling beyond early pilot phases. The advertising segment grew an impressive 20%, outperforming other major digital-ad platforms and reinforcing Amazon’s strength as a retail media leader. Retail profitability continued improving as the company expanded its regionalized fulfillment model, which has meaningfully reduced transportation costs and enabled record levels of fast delivery. Operating income climbed 29%, powered by both AWS leverage and ongoing logistics efficiencies. Management emphasized that AI infrastructure demand is “stronger than supply,” setting the stage for sustained cloud growth into 2026.


Key Highlights

  • Revenue reached $180.2B, up 12% YoY ex-FX.
  • AWS accelerated to 18% YoY growth.
  • Advertising expanded 20% YoY, outpacing Meta and Alphabet.
  • Operating income rose 29% YoY on stronger margins.
  • Trailing 12-month operating cash flow grew 18% YoY.
  • Capex elevated due to AI chips and datacenter expansion.
  • Retail logistics efficiencies strengthened North America margins.
  • Management signaled strong Q4 momentum entering the holiday season.

SWOT Analysis

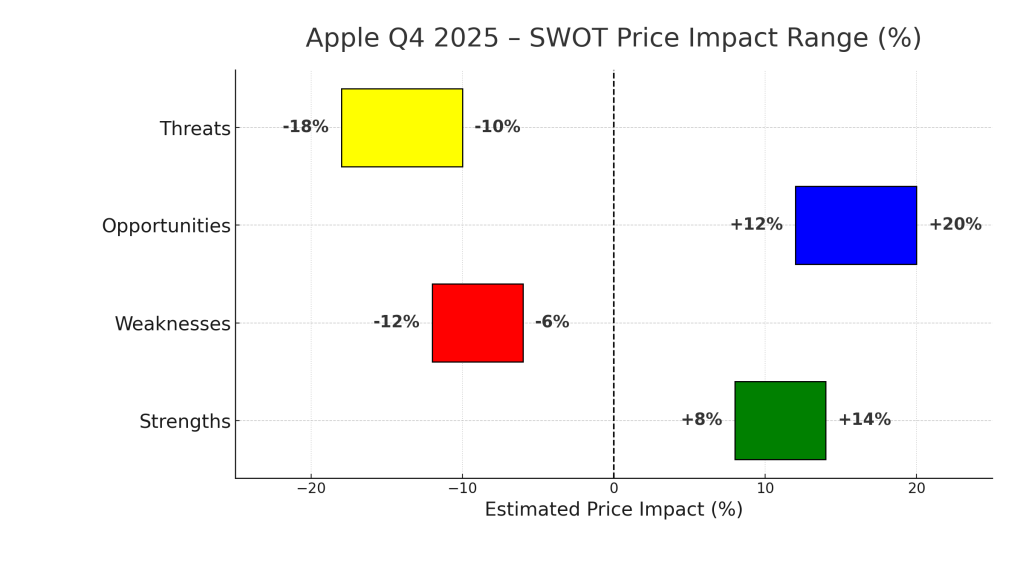
Amazon’s Q3 performance reaffirmed its dual identity as both an AI-infrastructure builder and a highly efficient global retailer. While AWS and Advertising push margins higher, AI-related capex introduces near-term cost pressure. Below is the structured SWOT summary with estimated price-impact ranges for each factor.

🟩 Strengths (+5% to +12%)

  • AWS growth re-accelerated to 18% YoY, confirming strong AI workload demand.
  • Retail logistics efficiency continues improving margins through regional fulfillment.
  • Advertising surged 20% YoY, expanding Amazon’s high-margin revenue mix.
  • Strong operating cash flow (+18% TTM) supports massive AI infrastructure build-out.

🟥 Weaknesses (–4% to –9%)

  • AI infrastructure capex remains very high as Trainium2 and datacenter expansion scale.
  • International segment profitability still lags despite solid revenue growth.
  • Growing analyst concerns that margins may peak in late 2026.
  • Limited disclosure on AWS margins keeps long-term leverage uncertain.

🟦 Opportunities (+8% to +15%)

  • AI chips (Trainium2, Inferentia) strengthen Amazon’s competitive position in cloud AI.
  • Prime Video’s ad-tier ramp unlocks a fast-growing high-margin ad channel.
  • Enterprise AI adoption transitioning from pilots to deployment boosts AWS utilization.
  • “Buy with Prime” and logistics-as-a-service expand total addressable market.

🟨 Threats (–7% to –14%)

  • Cloud pricing pressure from Microsoft and Google intensifying around AI workloads.
  • Regulatory scrutiny across antitrust, advertising, and marketplace operations.
  • Global supply-chain constraints could slow AWS datacenter build-out.
  • Retail macro uncertainty may limit unit growth into 2026.
Amazon Q3 2025 SWOT analysis chart showing estimated stock price impact ranges for strengths, weaknesses, opportunities, and threats, with horizontal bars and a zero-percent reference line.

Valuation Scenarios

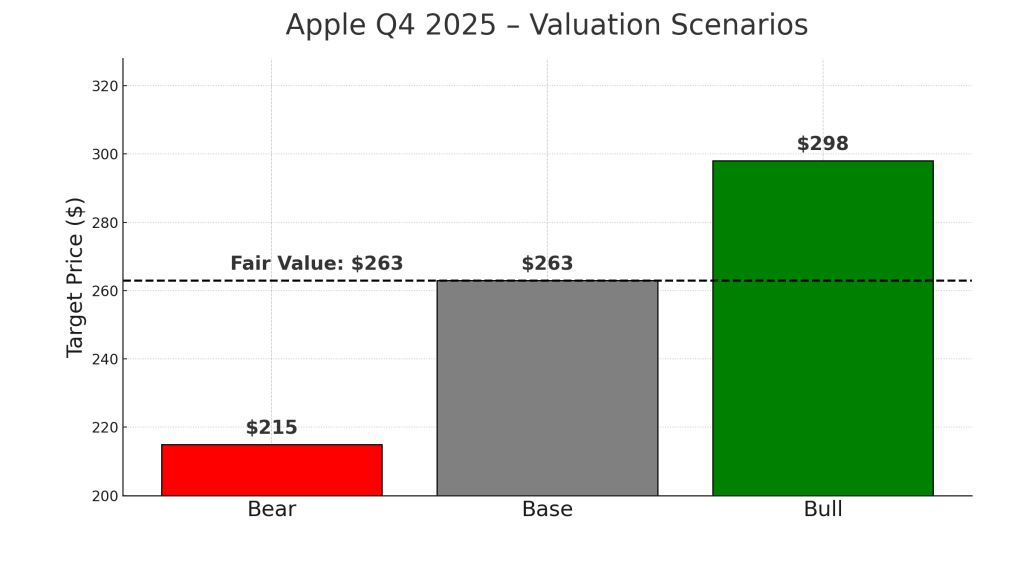
Using Amazon’s official Q3 results and management commentary, these valuation scenarios outline how earnings and multiples may evolve as AWS, Advertising, and Retail continue driving profitability. All calculations anchor to FY2026 earnings potential and Amazon’s historical valuation range during similar growth regimes.

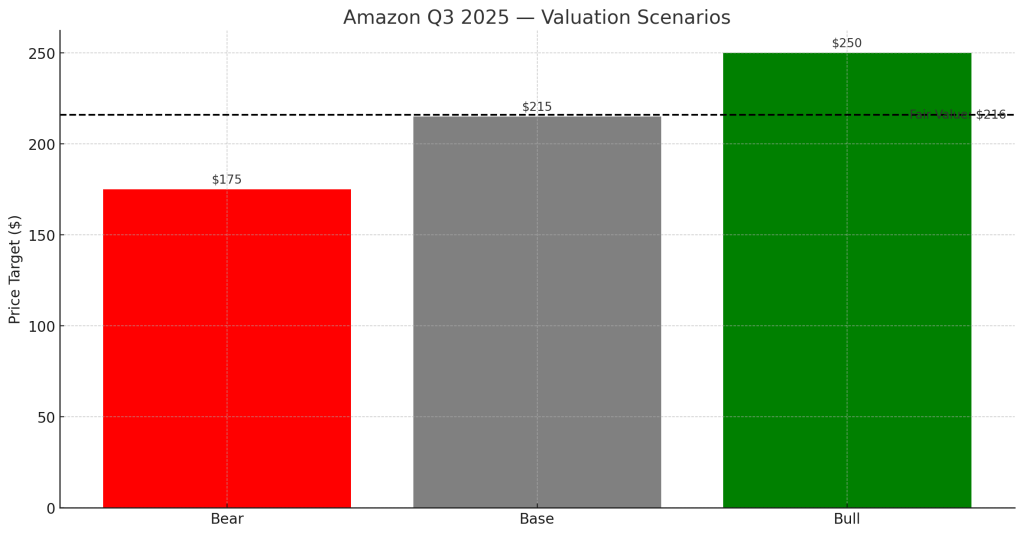
🔴 Bear Case — $175/share (20%)

  • AWS slows toward 12% YoY growth in 2026.
  • Retail margin expansion stalls due to cost inflation.
  • Applying 22× on ~$8.00 FY26 EPS → ~$176.

⚪ Base Case — $215/share (55%)

  • AWS grows 15–17% YoY, supported by AI infrastructure demand.
  • Advertising scales as a third core profit engine.
  • Retail margins continue gradual improvement.
  • Applying 27× on ~$8.00 FY26 EPS → ~$216.

🟢 Bull Case — $250/share (25%)

  • AWS accelerates above 20% YoY from enterprise AI deployment.
  • Prime Video advertising outperforms expectations.
  • Retail unit economics exceed guidance.
  • Applying 30×+ on ~$8.30 FY26 EPS → ~$249.

⭐ Probability-Weighted Fair Value

20% × 175 + 55% × 215 + 25% × 250 = ~216
Final fair value estimate: ~$216/share

Amazon Q3 2025 valuation scenarios chart showing Bear, Base, and Bull price targets with a dashed fair-value line at $216.

Verdict

Amazon’s Q3 results reinforce the company’s position as a long-term compounder powered by AI infrastructure, high-margin advertising, and increasingly efficient retail operations. AWS re-acceleration, combined with sustained cash-flow growth, provides strong visibility into earnings through 2026. While elevated capex and regulatory pressure remain risks, Amazon’s foundational drivers appear robust. At ~mid-$190s pre-earnings levels, the stock offered a compelling setup toward our ~$216 fair value.


Call to Action

If you want more breakdowns of mega-cap tech earnings, SWOT analyses, and fair-value models, follow SWOTstock for updates ahead of the next major reporting cycle.


Disclaimer

This analysis is for informational purposes only and is not investment advice. All estimates reflect public information from Amazon’s official financial results and management commentary.


Apple Q4 2025 — The Comeback Quarter That Put “Intelligence” Back in Apple

Apple reported 8% revenue growth to $102.5 billion and a record $28.75 billion in Services, signaling a return to growth after a flat trend. The iPhone 17 launch and deeper ecosystem engagement drove this performance. Guidance for the holiday quarter suggests continued growth, aligning with Apple’s AI ambitions. Investors reacted positively, with a 6% share price increase post-announcement.

TL;DR Summary

Apple finally broke its flat-growth streak.
Revenue climbed 8 % y/y to $102.5 billion, EPS reached $1.85 (+9 %), and Services hit a record $28.75 billion.
Guidance for the holiday quarter calls for +10–12 % growth, reigniting belief that Apple Intelligence is more than a buzzword.
For growth investors, this quarter marks Apple’s return to the AI-led expansion narrative.


Quarter Recap

After four quarters of muted growth, Apple delivered what Tim Cook called “our strongest lineup ever.”
The iPhone 17 launch, deeper ecosystem engagement, and record Services revenue lifted results well above expectations.
Gross margin expanded to 47.2 %, net income rose to $24.2 billion, and Apple declared another $0.26 dividend while continuing aggressive buybacks.

Beyond the numbers, the tone of the call signaled confidence: management expects the December quarter to be the best holiday season in Apple’s history.
That optimism—and the 6 % share-price jump that followed—suggests investors finally see Apple’s AI strategy taking shape.


Key Highlights

  • Services: $28.75 B (+15 %) — now 28 % of total revenue and driving margin expansion.
  • iPhone: $49.0 B (+6 %) — AI-capable models leading upgrade cycle.
  • Mac / iPad: Flat to down slightly as users wait for AI refreshes.
  • Geography: Greater China $14.5 B (+3 %) — showing early stabilization.
  • Guidance: Revenue +10–12 %, gross margin 47–48 % next quarter.

(Note: Apple’s 8 % revenue growth trails Microsoft’s +12 % and Google’s +10 %, but represents its strongest acceleration since 2022.)


How Apple Intelligence Actually Creates Value

For now, “Apple Intelligence” isn’t a separate subscription—it’s a device-pull engine.
AI-driven features such as natural-language photo search, cross-app summaries, and on-device personal assistance require the latest hardware chips (A18, M4).
That design forces upgrades and feeds Services usage. Apple plans to layer paid tiers later, turning AI into a recurring revenue lever by FY 2026.


SWOT Analysis — Estimated Price Impact

Strengths (+6 to +12 %)
A 2.2 billion-device installed base and record Services margin growth create durable pricing power.
AI-ready devices expand average selling prices and lift gross margin.
→ + $15 – $30 per share

Weaknesses (–5 to –10 %)
Hardware still ≈ 48 % of sales; tariffs and China competition pressure margins.
AI monetization lag keeps near-term EPS growth modest.
→ – $13 – $26 per share

Opportunities (+10 to +18 %)
AI integration across devices and services bundles can boost ARPU by 5–8 %.
Emerging-market FinTech and subscriptions expand TAM.
→ + $20 – $36 per share

Threats (–8 to –15 %)
Regulation (EU DMA, App Store fees), supply-chain relocation costs, and AI competition remain real headwinds.
→ – $18 – $32 per share

Horizontal SWOT bar chart for Apple Q4 2025 showing the estimated stock-price impact ranges for Strengths, Weaknesses, Opportunities, and Threats. Strengths (green) range from +8% to +14%, Weaknesses (red) from –12% to –6%, Opportunities (blue) from +12% to +20%, and Threats (yellow) from –18% to –10%.

Valuation Scenarios

Apple’s fair value clusters around $270, but outcomes vary depending on how quickly its AI ecosystem monetizes.
Here’s how the road ahead could play out:

  • Bull Case ($305, ~30 % probability):
    Apple executes on AI integration, driving 12 % EPS growth and pushing Services beyond 30 % of total revenue.
    The market rewards it with a premium multiple near 32×.
  • Base Case ($270, ~50 % probability):
    EPS grows about 8 % as AI demand builds gradually.
    The stock trades around 29× earnings — roughly where it sits today.
  • Bear Case ($230, ~20 % probability):
    China softness, regulation, and muted AI monetization limit EPS to +3 %.
    Multiple compresses to 25× as investors rotate to faster-growing peers.

➡️ Fair Value Estimate: ≈ $272.5 per share, balancing these three outcomes.

Vertical bar chart for Apple Q4 2025 valuation scenarios showing Bear, Base, and Bull price estimates. Bear scenario (red) is $215, Base (gray) is $263, and Bull (green) is $298. A horizontal dashed line marks Fair Value at $263.

Verdict

At ≈ $270, Apple is fairly valued with a clear path to earnings expansion.
Growth investors should hold core positions and add on dips near $230–240.
The next inflection point arrives mid-2026, when AI features begin contributing revenue and Apple could justify a re-rating to 32–34× P/E ($285–295 target).
If Apple proves that Intelligence sells devices — not just headlines — $300 may come sooner than bears expect.


What to Watch Next

  • Adoption metrics for Apple Intelligence features in real-world use.
  • Services ARPU growth and subscription renewal rates.
  • China unit sales momentum post-holiday quarter.
  • Margin management as $1.4 B tariff cost hits Q1.

(Visual Placeholder #5 – Peer Comparison Table: Apple vs Microsoft vs Alphabet Growth and Margins)


Call to Action

Follow SWOTstock for AI-era earnings analysis of Amazon, Microsoft, and Tesla as we track how AI execution reshapes Big Tech leadership.
Subscribe for alerts when next-quarter AI scorecards drop.


Disclaimer

This analysis uses only Apple Inc.’s official Q4 FY 2025 financial report and earnings call.
It is for informational purposes only and not investment advice.


Palo Alto Networks Q1 FY2026 — “Steady Growth, Strong ARR, and a Market That Wanted More”

Palo Alto Networks reported strong FY2026 Q1 results, with a 16% revenue increase to $2.50 billion and a 29% rise in NGS ARR to $5.9

TL;DR Summary

Palo Alto Networks delivered a solid first quarter for FY2026: revenue climbed 16% to $2.50 billion, NGS ARR rose 29% to $5.9 billion, and RPO expanded 24% to $15.5 billion. Non-GAAP EPS of $0.93 beat expectations, reaffirming the company’s execution as customers expand platform adoption across Strata, Prisma, and Cortex. Yet shares traded lower after earnings as full-year guidance held steady, signaling a “good but not great” quarter for a stock priced for upside surprises. Our probability-weighted fair value comes in at $211, modestly above today’s ~$200 level.


Quarter Recap

Palo Alto Networks opened fiscal 2026 with steady momentum across its recurring revenue engines. Revenue grew 16% year-on-year to $2.50 billion, reflecting consistent demand for platformized security solutions. Next-Generation Security ARR expanded 29% to $5.9 billion, and the company’s Remaining Performance Obligation reached $15.5 billion, illustrating multi-year visibility as customers commit to broader and longer-term contracts. Non-GAAP EPS of $0.93 came in ahead of expectations, supported by robust software mix and continued traction in large deals. GAAP net income softened to $334 million due to higher operating investments and recent acquisition activity. Full-year guidance was reaffirmed at 14% revenue growth and 38–39% free cash flow margin, indicating stable execution without major revisions.


Key Highlights

  • Revenue grew 16% YoY to $2.50B
  • NGS ARR increased 29% YoY to $5.9B
  • RPO reached $15.5B, up 24% YoY
  • GAAP net income: $334M
  • Non-GAAP EPS: $0.93
  • FY2026 revenue guide: $10.50B–$10.54B (~14% YoY)
  • FY2026 non-GAAP EPS guide: $3.80–$3.90
  • FY2026 FCF margin: 38–39%
  • Strong platform adoption across Strata, Prisma, Cortex
  • Deal cycles remain healthy with large multi-module wins

SWOT Analysis

Strengths (+6% to +12%)

Palo Alto’s platform strategy continues to resonate, with customers consolidating disparate tools into unified architectures across network, cloud, and SOC operations. Robust ARR and RPO growth demonstrate durable demand and expanding wallet share. Execution remains consistent, with non-GAAP EPS beating expectations and free cash flow margins reaffirmed at attractive levels.

Weaknesses (–5% to –10%)

GAAP profitability remains pressured as the company absorbs integration costs and continues its investment cycle. The flat full-year revenue outlook reflects strong but not accelerating momentum, which limits near-term operating leverage. Competition and elevated valuation require continuous outperformance to sustain premium multiples.

Opportunities (+8% to +15%)

AI-aligned security represents a significant long-term catalyst. Enterprises are rearchitecting systems to protect AI workloads, model governance, and data pipelines — opening the door for larger platform deals. If AI-driven security cycles broaden or ARR momentum accelerates, Palo Alto could benefit from expanding deal sizes and higher-margin software adoption.

Threats (–8% to –15%)

The competitive landscape remains intense, with CrowdStrike, Zscaler, Fortinet, and hyperscalers rolling out AI-native security features. Deal timing remains sensitive to macro conditions, and any slowdown in billings or ARR conversion could weigh on sentiment. With valuation elevated, even modest disappointments can trigger multiple compression.


SWOT Table

Strengths
+6% to +12%
Execution strength, ARR growth, platform adoption

Weaknesses
–5% to –10%
GAAP margin pressure, flat guide, integration costs

Opportunities
+8% to +15%
AI-security demand, larger platform deals, multi-year contracts

Threats
–8% to –15%
Intense competition, valuation risk, deal-cycle volatility

SWOT price impact chart for Palo Alto Networks Q1 FY2026 showing strengths, weaknesses, opportunities, and threats with corresponding dollar impact ranges on a horizontal bar graph.

Valuation Scenarios & Fair Value

Bull Case — $253 (35% probability)

Assumes stronger ARR expansion, AI-security deal momentum, and upside to FY26 revenue.
EPS: $3.95
Multiple: 64×
Target: $253

Base Case — $200 (50% probability)

Represents steady execution consistent with FY26 guidance.
EPS: $3.85
Multiple: 52×
Target: $200

Bear Case — $152 (15% probability)

Reflects slower deal cycles or competitive pressure leading to multiple compression.
EPS: $3.80
Multiple: 40×
Target: $152

Probability-Weighted Fair Value

0.35(253)+0.50(200)+0.15(152)=2110.35(253)+0.50(200)+0.15(152)=211

➡️ Fair Value Estimate: $211 per share

Today’s price near ~$200 suggests modest upside.

Valuation scenarios chart for Palo Alto Networks Q1 FY2026 showing bear case target of $152, base case target of $200, and bull case target of $253, with a dashed line indicating fair value at $211.”

Verdict

Palo Alto delivered a confident and well-executed quarter with strong ARR performance and healthy deal momentum. The reaffirmed full-year outlook signals stability, but the market was looking for acceleration, especially given the AI-security narrative. For long-term growth investors, the fundamentals remain compelling: resilient demand, high software mix, and strong free cash flow. With shares trading slightly below our $211 fair-value estimate, Palo Alto represents a reasonable entry point for exposure to platformized, AI-aligned cybersecurity — though upside may rely on renewed momentum in billings or a more aggressive guidance raise later in FY2026.


Call to Action

If you found this breakdown helpful, follow SWOTstock for more AI-driven fundamental analysis on today’s most important tech and cybersecurity companies. Each report is built from official filings, earnings transcripts, and a structured methodology designed for disciplined investors.


Disclaimer

This article is for informational purposes only and is not investment advice. All analysis is based exclusively on Palo Alto Networks’ official earnings report, financial disclosures, and management commentary from the latest quarter. Investors should perform their own research or consult a financial professional before making investment decisions.