Palo Alto Networks Q1 FY2026 — “Steady Growth, Strong ARR, and a Market That Wanted More”

Palo Alto Networks reported strong FY2026 Q1 results, with a 16% revenue increase to $2.50 billion and a 29% rise in NGS ARR to $5.9

TL;DR Summary

Palo Alto Networks delivered a solid first quarter for FY2026: revenue climbed 16% to $2.50 billion, NGS ARR rose 29% to $5.9 billion, and RPO expanded 24% to $15.5 billion. Non-GAAP EPS of $0.93 beat expectations, reaffirming the company’s execution as customers expand platform adoption across Strata, Prisma, and Cortex. Yet shares traded lower after earnings as full-year guidance held steady, signaling a “good but not great” quarter for a stock priced for upside surprises. Our probability-weighted fair value comes in at $211, modestly above today’s ~$200 level.


Quarter Recap

Palo Alto Networks opened fiscal 2026 with steady momentum across its recurring revenue engines. Revenue grew 16% year-on-year to $2.50 billion, reflecting consistent demand for platformized security solutions. Next-Generation Security ARR expanded 29% to $5.9 billion, and the company’s Remaining Performance Obligation reached $15.5 billion, illustrating multi-year visibility as customers commit to broader and longer-term contracts. Non-GAAP EPS of $0.93 came in ahead of expectations, supported by robust software mix and continued traction in large deals. GAAP net income softened to $334 million due to higher operating investments and recent acquisition activity. Full-year guidance was reaffirmed at 14% revenue growth and 38–39% free cash flow margin, indicating stable execution without major revisions.


Key Highlights

  • Revenue grew 16% YoY to $2.50B
  • NGS ARR increased 29% YoY to $5.9B
  • RPO reached $15.5B, up 24% YoY
  • GAAP net income: $334M
  • Non-GAAP EPS: $0.93
  • FY2026 revenue guide: $10.50B–$10.54B (~14% YoY)
  • FY2026 non-GAAP EPS guide: $3.80–$3.90
  • FY2026 FCF margin: 38–39%
  • Strong platform adoption across Strata, Prisma, Cortex
  • Deal cycles remain healthy with large multi-module wins
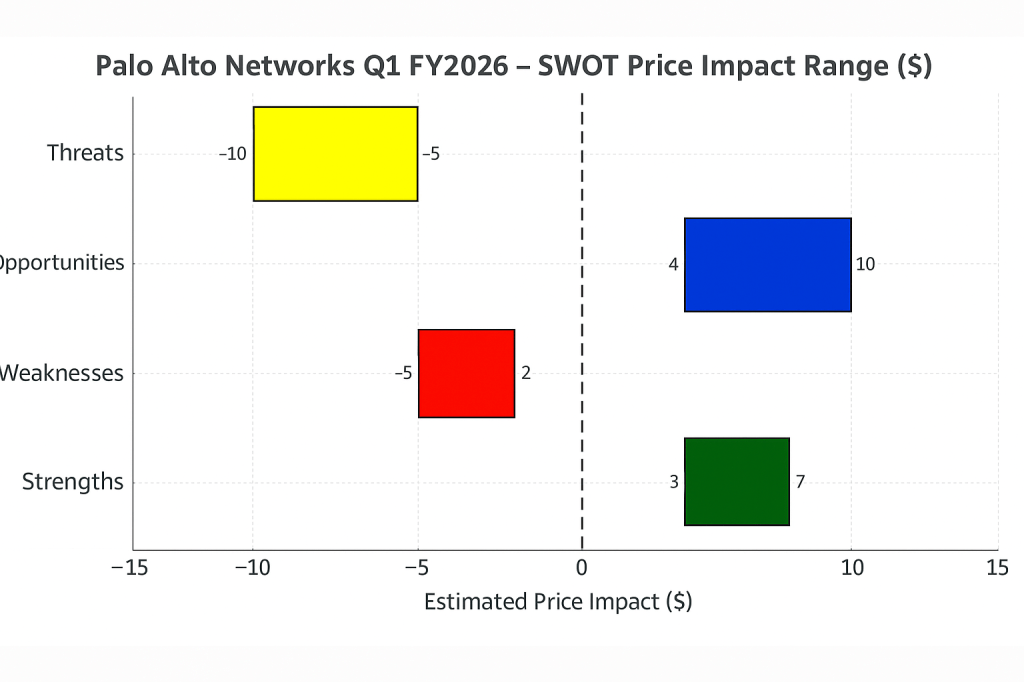
SWOT Analysis

Strengths (+6% to +12%)

Palo Alto’s platform strategy continues to resonate, with customers consolidating disparate tools into unified architectures across network, cloud, and SOC operations. Robust ARR and RPO growth demonstrate durable demand and expanding wallet share. Execution remains consistent, with non-GAAP EPS beating expectations and free cash flow margins reaffirmed at attractive levels.

Weaknesses (–5% to –10%)

GAAP profitability remains pressured as the company absorbs integration costs and continues its investment cycle. The flat full-year revenue outlook reflects strong but not accelerating momentum, which limits near-term operating leverage. Competition and elevated valuation require continuous outperformance to sustain premium multiples.

Opportunities (+8% to +15%)

AI-aligned security represents a significant long-term catalyst. Enterprises are rearchitecting systems to protect AI workloads, model governance, and data pipelines — opening the door for larger platform deals. If AI-driven security cycles broaden or ARR momentum accelerates, Palo Alto could benefit from expanding deal sizes and higher-margin software adoption.

Threats (–8% to –15%)

The competitive landscape remains intense, with CrowdStrike, Zscaler, Fortinet, and hyperscalers rolling out AI-native security features. Deal timing remains sensitive to macro conditions, and any slowdown in billings or ARR conversion could weigh on sentiment. With valuation elevated, even modest disappointments can trigger multiple compression.


SWOT Table

Strengths
+6% to +12%
Execution strength, ARR growth, platform adoption

Weaknesses
–5% to –10%
GAAP margin pressure, flat guide, integration costs

Opportunities
+8% to +15%
AI-security demand, larger platform deals, multi-year contracts

Threats
–8% to –15%
Intense competition, valuation risk, deal-cycle volatility

SWOT price impact chart for Palo Alto Networks Q1 FY2026 showing strengths, weaknesses, opportunities, and threats with corresponding dollar impact ranges on a horizontal bar graph.

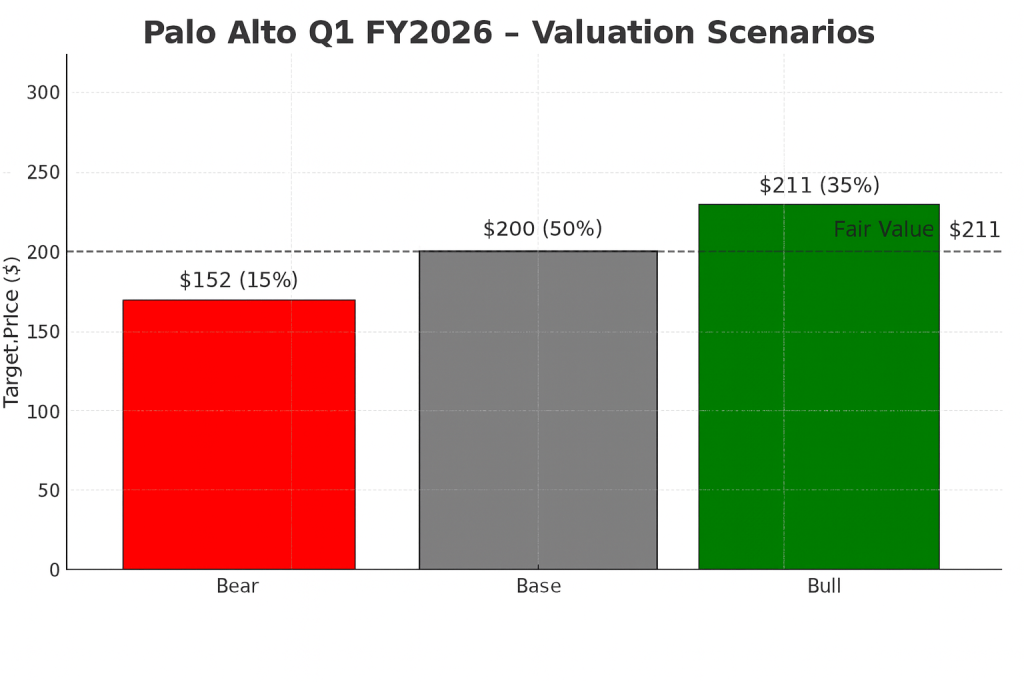
Valuation Scenarios & Fair Value

Bull Case — $253 (35% probability)

Assumes stronger ARR expansion, AI-security deal momentum, and upside to FY26 revenue.
EPS: $3.95
Multiple: 64×
Target: $253

Base Case — $200 (50% probability)

Represents steady execution consistent with FY26 guidance.
EPS: $3.85
Multiple: 52×
Target: $200

Bear Case — $152 (15% probability)

Reflects slower deal cycles or competitive pressure leading to multiple compression.
EPS: $3.80
Multiple: 40×
Target: $152

Probability-Weighted Fair Value

0.35(253)+0.50(200)+0.15(152)=2110.35(253)+0.50(200)+0.15(152)=211

➡️ Fair Value Estimate: $211 per share

Today’s price near ~$200 suggests modest upside.

Valuation scenarios chart for Palo Alto Networks Q1 FY2026 showing bear case target of $152, base case target of $200, and bull case target of $253, with a dashed line indicating fair value at $211.”

Verdict

Palo Alto delivered a confident and well-executed quarter with strong ARR performance and healthy deal momentum. The reaffirmed full-year outlook signals stability, but the market was looking for acceleration, especially given the AI-security narrative. For long-term growth investors, the fundamentals remain compelling: resilient demand, high software mix, and strong free cash flow. With shares trading slightly below our $211 fair-value estimate, Palo Alto represents a reasonable entry point for exposure to platformized, AI-aligned cybersecurity — though upside may rely on renewed momentum in billings or a more aggressive guidance raise later in FY2026.


Call to Action

If you found this breakdown helpful, follow SWOTstock for more AI-driven fundamental analysis on today’s most important tech and cybersecurity companies. Each report is built from official filings, earnings transcripts, and a structured methodology designed for disciplined investors.


Disclaimer

This article is for informational purposes only and is not investment advice. All analysis is based exclusively on Palo Alto Networks’ official earnings report, financial disclosures, and management commentary from the latest quarter. Investors should perform their own research or consult a financial professional before making investment decisions.


Why Goldman Is Backing Baidu: AI Cloud Momentum Meets Policy Tailwinds

Baidu is experiencing substantial growth in its AI cloud services, with a 42% increase despite a 6% decline in advertising revenue, leading to decreased earnings. Goldman Sachs maintains a Buy rating, citing strategic investments. However, risks include U.S. chip restrictions and regulatory changes. Baidu’s valuation suggests potential upside if AI monetization improves.

TL;DR: Baidu’s AI Cloud Is Booming, But Ad Weakness Lingers

Goldman Sachs reaffirmed its Buy rating on Baidu despite trimming its price target. Beneath the drag of declining ad revenue lies a fast-growing AI cloud engine and deep integration into China’s AI strategy. In Q1 2025, Baidu’s cloud grew over 40%, outpacing peers like Alibaba and Tencent. While earnings dipped, strategic investments in ERNIE AI and Apollo Go are gaining traction. At ~$84, Baidu trades at a 20–25% discount to its estimated fair value.

Clean infographic summarizing Baidu’s Q1 2025: +42% AI Cloud growth, –6% ad revenue decline, investments in Ernie AI and Apollo Go, and a 20–25% valuation discount, with no footer text.

Quick Risk Snapshot

Top 3 Risks at a Glance

  • Export Controls: U.S. chip curbs may limit Baidu’s model training capabilities
  • Regulatory Crackdown: Surprise data or AI rules in China could cut valuations overnight
  • Monetization Gap: ERNIE is technically impressive—but where’s the revenue?

Q1 2025 Recap: AI is Surging, but Ads Still Weigh on Profitability

Baidu delivered a mixed but forward-looking quarter. Revenue rose 3% YoY to ¥32.45 billion, beating expectations, driven by a 42% jump in AI Cloud services. However, its core advertising revenue declined 6%, pulling EPS down by 7%.

Management emphasized that Baidu is no longer just an ad business. CFO Junjie He called AI Cloud a “structural growth engine,” with new pricing strategies designed to build market share quickly.

Why it matters: This quarter signals that Baidu is chasing scale and infrastructure leadership—not just short-term margins.

Bar chart comparing Baidu’s Q1 2025 segment revenue: AI Cloud at ¥9.4B and Ad Revenue at ¥16.0B, highlighting the company’s growing cloud business versus its declining ad segment.

Key Highlights

  • Revenue: ¥32.45B (+3% YoY)
  • Adjusted EPS: ¥18.54 (–7% YoY)
  • AI Cloud: ¥9.4B (+42% YoY)
  • Ad Revenue: ¥16.0B (–6%)
  • ERNIE AI: Free-tier and Turbo upgrades launched
  • Apollo Go: Overseas ops launched in UAE and Switzerland
  • Buybacks: $445M in Q1; $2.1B total
  • Ratings: Goldman, Benchmark maintain Buy
Line chart comparing Baidu’s revenue and net income over the last five quarters (Q1 2024 to Q1 2025), showing consistent revenue near ¥32–34B and rising net income peaking at ¥7.72B in Q1 2025.

SWOT Analysis: A High-Potential Pivot With Limited Room for Error

Let’s break it down using the SWOT framework—what’s working, what’s not, where upside lies, and what could derail the story.

Strengths

  • AI Cloud Outperformance: 42% growth beats Alibaba (+18%) and Tencent (+5%)—suggests Baidu’s architecture is gaining real-world adoption.
  • ERNIE Model Pipeline: Free, open-access models with advanced reasoning (X1) and multimodal capability (4.5) aim to build developer lock-in.
  • Backed by Big Names: Goldman and Benchmark keeping Buy ratings provides institutional cover.

+ Price Impact: +$15 to +30

Weaknesses

  • Ad Revenue Shrinkage: 6% drop in core advertising weakens cash flow reliability.
  • Earnings Pressure: Margin compression from free tools, price cuts, and rising AI compute costs.
  • Transparency: Baidu’s upbeat tone feels disconnected from profitability trends—investors may question reporting quality.

– Price Impact: –$10 to –20

Opportunities

  • China AI Policy Tailwinds: Backed by a ¥60B national AI fund, Baidu is well-positioned as a state-aligned infrastructure play.
  • Apollo Go Global: Early mover in robotaxis beyond China borders—may attract sovereign or enterprise partnerships.
  • AI Monetization Path: If Baidu can convert ERNIE from R&D to revenue via enterprise tools or cloud inference APIs, re-rating likely.

+ Price Impact: +$10 to +25

Threats

  • Tech Export Curbs: U.S. chip bans on Nvidia/AMD AI hardware limit model training capacity.
  • Rising Domestic Competition: Alibaba’s Tongyi Qianwen and Tencent’s Hunyuan are growing fast with commercial APIs.
  • Delisting/Regulatory Risk: ADR structure, CCP data controls, or surprise regulation could drastically change valuation environment.
  • Currency Volatility: RMB depreciation adds an FX layer to Baidu’s dollar-denominated shares.

– Price Impact: –$15 to –30

Factor Range Impact Notes
Strengths +15 to +30 Cloud & ERNIE momentum
Weaknesses –10 to –20 Ad reliance, earnings fade
Opportunities +10 to +25 Policy & mobility tailwinds
Threats –15 to –30 Geopolitical and regulatory

Implied Range: $69 – $114 vs current price ~$84

Horizontal SWOT chart showing Baidu’s Q1 2025 stock price impact estimates, with fixed x-axis from –40 to +40: Threats (–30 to –15), Opportunities (+10 to +25), Weaknesses (–20 to –10), Strengths (+15 to +30), and a vertical dashed baseline at $0.

Valuation Scenarios: How It Could Play Out

Valuation = EPS forward ​× P/E

Base Case – 7.00 × 15 = $105

Cloud keeps scaling, ads stabilize
Probability: 60%

Bull Case – 7.75 × 18 = $140

Enterprise AI lands, Apollo Go JV, margin gains
Probability: 25%

Bear Case – 5.00 × 15 = $75

AI stalls, chip blocks hit hard, new China policy drop
Probability: 15%

Weighted Average Estimate: $106.25 → +26% upside

(105×0.6)+(140×0.25)+(75×0.15)=106.25

Chart comparing Baidu’s Q1 2025 valuation scenarios: Bear Case ($75), Base Case ($105), Bull Case ($140), alongside current price ($84) and a dotted fair value line at $106.25.

Verdict: Cautiously Optimistic, AI-Led Rerating Is Possible

Baidu’s execution is improving, even as its earnings lag. AI Cloud is clearly working. ERNIE shows potential. Apollo Go is going international. Still, transparency, monetization, and policy remain wildcards.

If you believe China is serious about tech independence, Baidu is its AI bet. The risk/reward is no longer binary—but still asymmetric.

Our Take: Slightly undervalued. Buy/accumulate with a long-term AI view.


What Would Change Our View?

Upside Triggers

  • AI monetization evidence (cloud APIs, enterprise adoption)
  • Positive shift in U.S.-China chip policy
  • Robotaxi revenue in H2

Downside Red Flags

  • Surprise AI regulation in China
  • Margin compression without revenue pickup
  • Negative audit news or delisting pressure

Call to Action

Want more AI-powered investment breakdowns—without the hype? Follow @SWOTstock and get the next big move before the headlines hit.


Disclaimer

This post is based solely on Baidu’s official financial report, earnings call, and verified analyst commentary. It is not investment advice. Please do your own research.


Leave a comment


Autodesk Q1 2026 Earnings: AI Tools Drive Growth—but Is the Upside Already Priced In?

Autodesk (ADSK) beats Q1 FY2026 estimates and raises guidance, but is the stock already priced for perfection? Dive into our AI-focused SWOT analysis, valuation breakdown, and investor verdict.

TL;DR – Solid Beat, Upgraded Guidance, But Market Unmoved

Autodesk (NASDAQ: ADSK) beat expectations in Q1 with 15% revenue growth, expanding margins, and strong free cash flow. Management raised full-year guidance and highlighted its AI platform roadmap. Still, the stock stayed flat—suggesting the optimism may be fully priced in.


Financial Overview – Growth That Converts to Cash

Autodesk reported:

  • Revenue: $1.63B (+15% YoY)
  • EPS (Non-GAAP): $2.29
  • Operating Margin: 37% (+300bps YoY)
  • Free Cash Flow: $556M (+14%)
  • Billings: $1.43B (+29%)
  • FY2026 guidance raised for revenue and EPS

What sets Autodesk apart isn’t just strong revenue—it’s the ability to consistently convert earnings into cash flow.

Line chart showing Autodesk’s free cash flow and net income over the last five quarters, highlighting consistent growth through Q1 2026.

Where the Growth Is Coming From

Revenue isn’t growing evenly across all business lines. Autodesk’s AEC (architecture, engineering, and construction) segment remains dominant, but Manufacturing and “Others” are catching up.

Bar chart comparing Autodesk’s revenue by segment—AEC, Manufacturing, and Others—between Q1 2025 and Q1 2026.

Also critical is the mix of recurring revenue. Subscription ARR is expanding steadily, which supports long-term valuation multiples.

Line chart showing Autodesk’s total revenue versus quarterly subscription ARR from Q1 2025 to Q1 2026, reflecting recurring revenue growth.

Management’s Outlook – Confidence Backed by Upward Revisions

Autodesk has shown a pattern of raising guidance, reinforcing investor confidence in leadership and execution.

Bar chart illustrating Autodesk’s EPS guidance revisions, showing increases from original to final guidance in FY2025 and FY2026.

SWOT Breakdown – What’s Working, What’s Not, and Where We Go Next

Let’s break it down using SWOT—strengths, weaknesses, opportunities, and threats—with estimated stock price impact for each:

Strengths

  • Revenue and FCF beat expectations
  • AI rollout begins across Revit and Fusion
  • Subscription model fuels predictable growth

Price Impact: +$15 to +$20


Weaknesses

  • Flat stock reaction post-earnings suggests limited short-term upside
  • High R&D spend during platform transition could compress near-term margins

Price Impact: –$5 to –$10


Opportunities

  • Generative design and predictive modeling features gain traction
  • Construction Ops platform and APAC expansion could drive new growth
  • Increased ARR could unlock multiple expansion

Price Impact: +$25 to +$40


Threats

  • Geopolitical and macro headwinds
  • Execution risk with AI and Cloud scale
  • Valuation already rich (~30.7x forward earnings)

Price Impact: –$20 to –$30

SWOT Summary Table

Type Key Points Price Impact
Strengths Revenue & margin beat, AI rollout started +$15 to +$20
Weaknesses Flat stock, platform costs –$5 to –$10
Opportunities Generative design AI, platform growth, APAC expansion +$25 to +$40
Threats Macro risk, AI execution gaps, valuation pressure –$20 to –$30
Horizontal bar chart showing Autodesk’s estimated stock price impact by SWOT element with both endpoints labeled.

Valuation Scenarios – Let’s Do the Math

Despite the strong report, Autodesk’s closing price after earning released ($295.35 as of May 23, 2025) implies a ~30.7x forward P/E. Here’s how that compares to valuation scenarios based on official EPS guidance and fair multiples:

Base Case – Fair Value: $132

  • EPS = $9.62 × P/E 13.7 → $132
  • Reflects steady execution and moderate optimism

Bull Case – Fair Value: $160

  • EPS = $9.73 × P/E 16.5 → $160
  • Assumes strong AI traction and margin expansion

Bear Case – Fair Value: $100

  • EPS = $9.50 × P/E 10.5 → $100
  • Macro pressure + execution delays = multiple compression

Weighted Average Estimate: $132.5

(132×0.6)+(160×0.25)+(100×0.15)=132.5

Bar chart showing Autodesk’s valuation scenarios with weighted average, compared to current stock price.

So Why Is the Market Paying $295?

That’s nearly double our base case. Investors are pricing in:

  • Premium for platform dominance and design ecosystem
  • Long-term AI monetization potential
  • Confidence in 3–5 year growth, not just FY2026

Let’s check historical valuation to see if this premium is new.

Dual-axis chart showing Autodesk’s stock price and trailing P/E ratio over the last five years.

Verdict – Fully Valued. Wait for Dip.

Autodesk’s vision is impressive. The stock is too.
But at current prices, the upside may already be realized—at least in the short term. Long-term investors may want to hold. Opportunists should consider waiting for a pullback below $250 to improve margin of safety.


Call to Action

Want no-hype, investor-friendly breakdowns like this?
Subscribe to SWOTstock to stay ahead of the curve—no fluff, just fundamentals.


Disclaimer

This post is based solely on Autodesk’s official financial report and earnings call transcript. It does not constitute investment advice. Please do your own research.


Leave a comment