ASML’s Q3 Performance: Steady Growth Amid Challenges

ASML posted a solid Q3 with €7.5 billion in sales and €2.1 billion in net income, leading to a positive stock reaction. Despite a projected decline in Chinese demand for 2026, management remains optimistic, maintaining a fair valuation of approximately $1,190 per share, indicating significant growth potential driven by AI advancements.

🔎 TL;DR Summary

ASML (AMSL:NASDAQ) just delivered another steady quarter: €7.5 billion in sales, €2.1 billion net income, and margins holding above 51 %. The stock reacted positively in pre-market, climbing ~3 %, as investors looked beyond a cautious China outlook to renewed confidence in ASML’s long-term AI-driven roadmap. Our fair-value model points to ~ $1,190 per share, ≈ 25 % upside.


🧭 Quarter Recap

Management called Q3 “in line with guidance.” Bookings hit €5.4 billion, supported by continued momentum in EUV and early shipments of High-NA EUV systems. The company also highlighted its new AI partnership with Mistral AI, aiming to embed machine-learning control into yield and productivity.

The only dark cloud: ASML expects a “significant decline in China demand in 2026.” Still, management does not foresee overall sales falling below 2025 levels — a sign of resilience amid geopolitical shifts.


💡 Key Highlights

  • Net sales: €7.52 billion | Gross margin: 51.6 %
  • Net income: €2.13 billion | EPS: €5.49
  • Bookings: €5.4 billion | Service revenue: €1.96 billion
  • Guidance: Q4 sales €9.2 – €9.8 billion | Full-year +15 % growth

🧩 SWOT Analysis (Q3 2025)

Strengths (+8 to +12 %) Technological monopoly in EUV and upcoming High-NA tools sustain >50 % gross margin and high visibility.

Weaknesses (−4 to −7 %) Cap-ex cycles and €1.2 billion quarterly R&D keep cash flows volatile.

Opportunities (+10 to +18 %) AI lithography, Mistral AI integration, and High-NA adoption expand ASML’s total addressable market through 2028.

Threats (−8 to −12 %) China sales normalization and export controls could trim €1.5 – 2 billion from 2026 revenue.

Net SWOT bias: +5 % to +9 % upside.

A graph illustrating the SWOT analysis of ASML for Q3 2025, showing estimated price impact ranges for strengths, weaknesses, opportunities, and threats in percentage.
SWOT analysis chart highlighting ASML’s strengths, weaknesses, opportunities, and threats for Q3 2025.

📊 Valuation Scenarios

• Bull Case: ASML’s High-NA EUV rollout and AI-driven lithography adoption accelerate revenue growth above 20 % annually through 2027. → Estimated EPS 2026: €27 | P/E 45× | Fair Value ≈ $1,310 (+44 %).

• Base Case: Steady 15 % growth and margin stability around 52 %. → Estimated EPS 2026: €25 | P/E 40× | Fair Value ≈ $1,080 (+14 %).

• Bear Case: China demand softens (-15 % revenue in 2026) and margins slip to 49 %. → Estimated EPS 2026: €22 | P/E 35× | Fair Value ≈ $830 (-13 %).

🎯 Weighted Fair Value:$1,190 per share (+25 % upside)


Bar chart depicting ASML's valuation scenarios for Q3 2025, with 'Bear' case at $830, 'Base' case at $1080, and 'Bull' case at $1310, along with a dashed line indicating the fair value at $1099.
ASML Q3 2025 Valuation Scenarios: Target prices under Bear, Base, and Bull cases.

🧠 Verdict

ASML remains the “picks-and-shovels” play for the AI era. Even as near-term demand wobbles, its EUV and High-NA roadmap locks in a multi-year growth path few companies can match. For tech-savvy growth investors, the setup still favours accumulation on dips.


💬 Investor Takeaway

Market reaction shows confidence in ASML’s long-term story: from chipmaker orders to AI co-design tools, it continues to define the semiconductor future. Short-term noise aside, the firm’s monopoly position and AI-linked flywheel justify a premium valuation — and our $1,190 fair price reflects that potential.


Disclaimer: This post is for informational purposes only and not financial advice. Please do your own research before investing.

Berkshire Hathaway Q2 2025: Fortress Balance Sheet, Capital Inaction, and the Buffett‑to‑Abel Transition

Berkshire Hathaway’s Q2 2025 results show a cautious approach, with operating earnings of $11.16B down 4% YoY and a significant net income drop of 59% due to a Kraft Heinz writedown. Despite strong cash reserves of $344B, no buybacks occurred, raising investor concerns over capital deployment ahead of Buffett’s leadership transition to Greg Abel.

📌 TL;DR Summary:

Berkshire Hathaway reported Q2 2025 operating earnings of $11.16 B (–4% YoY) and a $3.8 B writedown on Kraft Heinz, dragging net income down 59%. Cash remains enormous at $344 B, but no buybacks were executed, leaving investors questioning capital deployment. Book value per share grew 6% YoY, but the stock trades near 1.45× book — above Buffett’s historical repurchase thresholds. For value investors, Berkshire remains a fortress‑like hold, but not an obvious bargain as the leadership transition to Greg Abel approaches.


🧾 Quarter Recap:

Berkshire Hathaway’s Q2 2025 earnings reflect disciplined caution with limited offensive moves.

  • Operating earnings: $11.16 B (–4% YoY).
  • Net income: $12.37 B (–59% YoY) due to a $3.8 B Kraft Heinz impairment.
  • Cash: $344 B, slightly down from Q1 but still near record highs.
  • Book value per share~$262, up 6% YoY and ~1% sequentially.
  • No share repurchases, for the second consecutive quarter.
  • Equity activity: Net seller of ~$3 B in stock.
  • Buffett’s discipline holds: As he wrote in the 2023 letter, “We only repurchase shares when we believe they are selling at a meaningful discount to intrinsic value.”

In Q1, we observed:

“Berkshire is signaling caution, not conviction — sitting on cash, avoiding buybacks, and waiting for real value to emerge.”

Q2 results confirm this stance — cash is stockpiled, but deployment remains elusive.


📌 Key Highlights:

  • BNSF Railway: Operating profit up ~19% to $1.47 B on freight volume growth.
  • Geico: Underwriting profit ~$1.8 B, with ~16.5% margin.
  • Insurance (reinsurance & P/C): Underwriting income declined 12%, with P&C reinsurance premiums down ~10%. Float rose to ~$174 B.
  • Consumer goods: Revenue fell ~5%, impacted by tariffs and slowing demand for brands like Fruit of the Loom.
  • FX losses: ~$877 M, pressuring underwriting results.
Line chart showing Berkshire Hathaway’s revenue and net income over the last five quarters: revenue remains relatively stable between $92B and $97B, while net income declines from about $30B in Q2 2024 to $12.37B in Q2 2025.

📈 Book Value & Valuation Context:

  • Book value per share: ~$262, up 6% YoY.
  • Price-to-book: ~1.45×, slightly below the 10‑year average of 1.5×.
  • Historical buyback threshold: Buffett previously authorized buybacks when shares traded under 1.2× book. At current levels (~1.45×), Berkshire remains above that range, which explains the lack of repurchases.

Value investor insight: Berkshire’s market price suggests it’s fully valued by Buffett’s own conservative yardstick.


🧠 SWOT Analysis with Price Impact Estimates:

Strengths (+$15 – $25/share)

  • Fortress balance sheet: $344 B in cash and $174 B in insurance float.
  • Operational resilience: BNSF and Geico continue to deliver.
  • Diversified revenue streams: Core industrials and energy shield against sector shocks.

Weaknesses (–$10 – $20/share)

  • Kraft Heinz writedown exposes underperforming legacy investments.
  • No share buybacks, signaling management sees limited margin of safety at current levels.
  • Underwriting softness and FX headwinds pressure insurance results.

Opportunities (+$10 – $20/share)

  • Capital deployment: $344 B cash can be deployed for opportunistic M&A or buybacks if valuations fall.
  • Rail consolidation: BNSF may benefit from strategic M&A moves in the sector.
  • Insurance cycle hardening: Potential for improved pricing in future quarters.

Threats (–$10 – $15/share)

  • Leadership transition: Buffett‑to‑Abel handoff raises uncertainty about future capital allocation.
  • Macro risks: Tariffs and FX volatility weigh on consumer and manufacturing units.
  • Equity portfolio volatility: GAAP fair‑value swings distort net income.

📊 SWOT Summary Table

SWOT summary table for Berkshire Hathaway Q2 2025 showing strengths, weaknesses, opportunities, and threats with estimated price impacts
Horizontal bar chart showing Berkshire Hathaway Q2 2025 SWOT price impact: Threats at approximately –12.5, Opportunities at +15, Weaknesses at –15, and Strengths at +20, with a vertical dashed line at zero.

💸 Valuation Scenarios:

We apply sum‑of‑parts (subsidiary cash flows + equity portfolio) and P/B benchmarking:

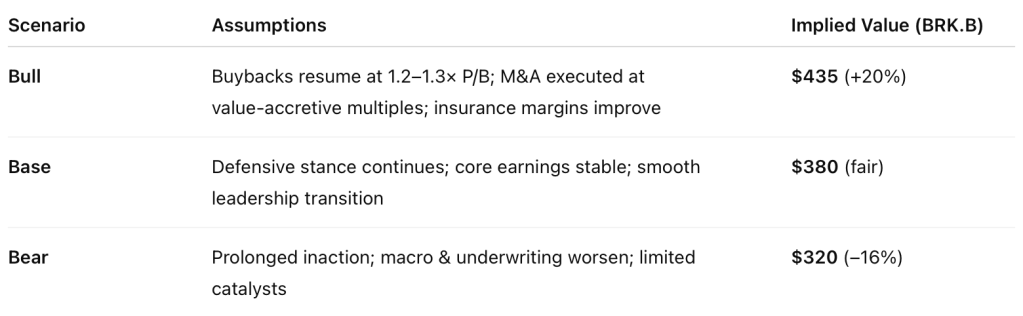
Valuation scenarios table for Berkshire Hathaway Q2 2025 showing bull, base, and bear cases with assumptions and implied BRK.B share prices

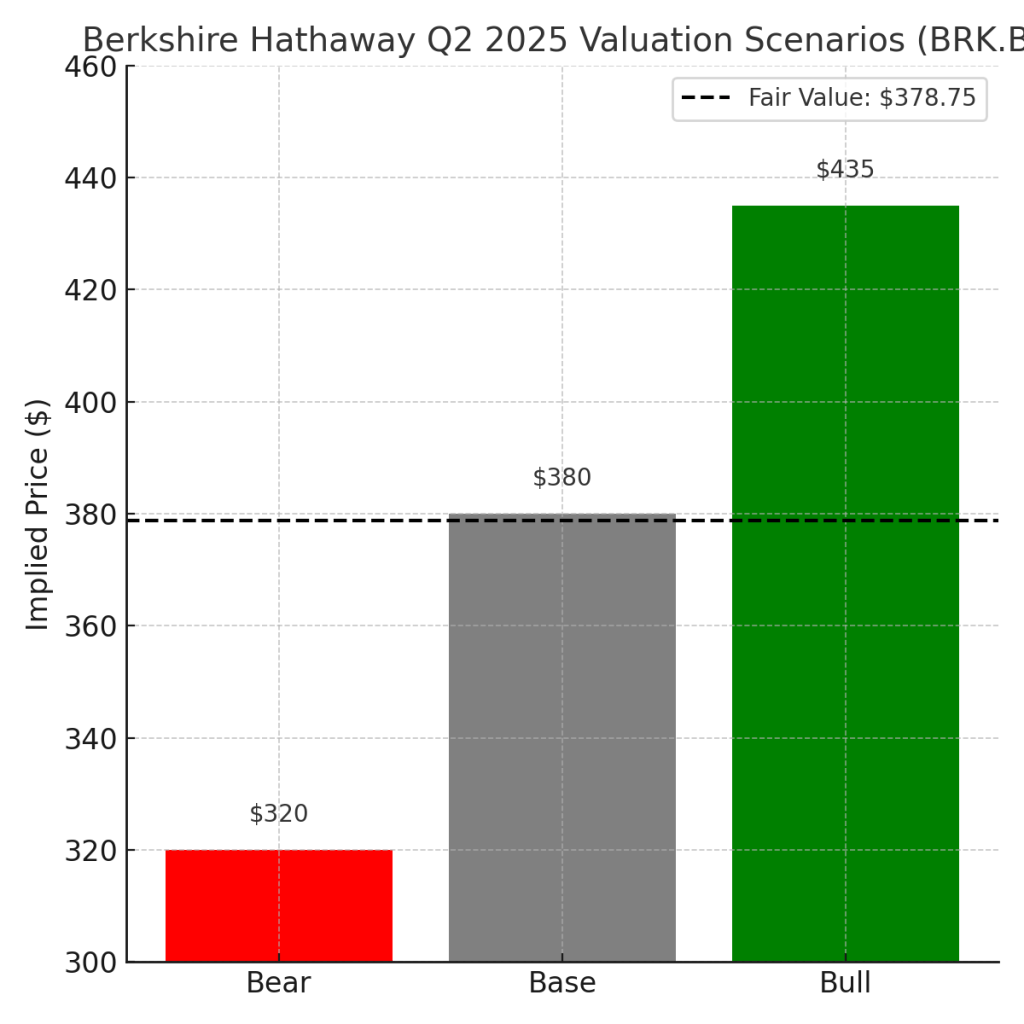
Probability‑Weighted Fair Value = (0.25 × 435) + (0.5 × 380) + (0.25 × 320) = $378.75/share.

Vertical bar chart showing Berkshire Hathaway Q2 2025 valuation scenarios: Bear case at $320, Base case at $380, and Bull case at $435, with a horizontal dashed line indicating the probability-weighted fair value of approximately $378.75.

📊 Peer Comparison Insight:


Berkshire Hathaway’s P/B ratio of 1.45 positions it above Markel (1.2) but far below the S&P 500 average of 4.2, reinforcing its standing as a value‑oriented conglomerate rather than a growth‑priced index constituent. Its ROE of 10% trails the S&P 500’s 14%, reflecting Berkshire’s conservative leverage and capital deployment posture, yet it still outpaces Markel’s 8%. The YTD return of 4% lags the S&P 500’s 6%, highlighting market skepticism about near‑term catalysts amid Buffett’s upcoming transition and limited capital actions. For DIY value investors, this underscores Berkshire’s role as a steady compounding hold rather than a momentum‑driven outperformer.

Horizontal bar chart comparing Berkshire Hathaway, Markel, and the S&P 500 in Q2 2025: Berkshire shows a P/B ratio of 1.45, ROE of 10%, and YTD return of 4%; Markel shows a P/B ratio of 1.2, ROE of 8%, and YTD return of 6%; S&P 500 shows a P/B ratio of 4.2, ROE of 14%, and YTD return of 6%.

🔑 Catalysts for Re‑rating and Market Reaction

Berkshire’s stock continues to trade like the fortress it is — steady but unspectacular — with a year‑to‑date gain of about 4%, trailing the S&P 500’s roughly 6% advance. The muted market response to Q2 earnings suggests that investors see the quarter as “business as usual”: strong balance sheet, reliable operating results, but little in the way of near‑term excitement. For the stock to re‑rate higher, investors are watching for clearer capital deployment signals — whether that’s buybacks at higher price‑to‑book levels, opportunistic large‑scale acquisitions, or a more aggressive investment approach under Greg Abel’s leadership once the Buffett transition is complete. A significant market downturn, which would give Berkshire the chance to deploy its $344 B cash pile into undervalued opportunities, also remains a potential catalyst for a re‑rating. Until then, the shares are likely to trade within a range that reflects their defensive compounding profile rather than breakout growth.


🧠 Verdict:

For value investors, Berkshire remains a defensive cornerstone: diversified, cash‑rich, and well‑positioned for opportunistic moves. But at ~1.45× book, shares are not trading at a margin of safety by Buffett’s standards. Until buybacks resume, M&A materializes, or valuations reset lower, this is a hold for long‑term compounding — not a bargain entry point.


📣 Call to Action:

Stay ahead of Berkshire’s next moves — from buybacks to the post‑Buffett era.
Subscribe to SWOTstock for deep‑dive analyses that cut through the headlines.


⚠️ Disclaimer:

This analysis is based solely on Berkshire Hathaway’s Q2 2025 public filings (Form 10‑Q, earnings release). It does not constitute financial advice. Perform your own due diligence or consult a licensed advisor before making investment decisions.


Leave a comment


Morgan Stanley Q2 2025: Trading Strength Offsets IB Weakness, But Market Stays Cautious

Morgan Stanley reported strong Q2 2025 results, with $16.8B revenue and $2.13 EPS, surpassing expectations. Wealth Management added $59B in assets, while trading revenues increased. Despite a 5% drop in investment banking fees, the firm raised its dividend and initiated a $20B buyback, reflecting ongoing shareholder commitment. Shares fell post-announcement amid market caution.

TL;DR Summary

Morgan Stanley delivered a strong Q2 2025, with $16.8 B revenue and EPS of $2.13, both above expectations. Wealth Management inflows of $59 B and robust trading performance offset a 5% decline in investment banking fees. The firm also raised its dividend to $1.00/share (yielding ~2.8%) and approved a $20 B share buyback, underscoring its commitment to returning capital. Despite these positives, shares slipped ~1–2% post‑earnings, reflecting cautious sentiment around capital markets headwinds. Our fair value estimate remains ~$144, near current levels, with upside tied to a revival in dealmaking and continued strength in Wealth Management.


Quarter Recap

Morgan Stanley reported net revenues of $16.8 B, up 12% YoY, and EPS of $2.13, beating consensus by 7.6%. ROTCE reached 18.2%, reaffirming the firm’s profitability strength.

Wealth Management added $59 B in net new assets, partially offset by $22 B in tax-related outflows. Trading was a bright spot: equities revenue came in at ~$3.7 B (+23% YoY) and fixed income at ~$2.2 B (+9%). These gains helped offset investment banking fees, which fell ~5% YoY and remain below pre‑2022 levels.

Capital returns were a highlight: the board approved a quarterly dividend increase to $1.00/share (yielding ~2.8% at current prices) and a $20 B share repurchase program, beginning in Q3 2025.


Key Highlights

  • Revenue: $16.8 B (+12% YoY)
  • EPS: $2.13 (+7.6% above consensus)
  • ROTCE: 18.2%
  • Wealth Management: $59 B net new assets, offset by $22 B in tax outflows
  • Trading: Equities $3.7 B (+23%); Fixed income $2.2 B (+9%)
  • Investment Banking: Down ~5% YoY; still lagging pre‑2022 levels
  • Capital Returns: Dividend raised to $1.00/share (~2.8% yield)$20 B buyback approved
Line chart showing Morgan Stanley’s revenue and net income over the past five quarters, highlighting growth in Q2 2025.

Peer Comparison

Morgan Stanley’s steady, wealth-led approach continues to differentiate it. But when comparing to peers, Goldman Sachs grew investment banking revenue ~26% YoY, while Morgan Stanley saw a 5% decline. JPMorgan also outpaced MS in advisory and underwriting activity. This highlights a strategic trade‑off: Morgan Stanley prioritizes stable Wealth Management growth, sacrificing some upside in deal-driven businesses.

Bar chart comparing Morgan Stanley, Goldman Sachs, and JPMorgan for Q2 2025: Investment banking revenue change (%, orange bars) and wealth management inflows ($B, teal bars).

SWOT Analysis

Morgan Stanley’s Q2 shows why the market reacted cautiously: the firm delivered solid results, but investors remain concerned about weaker capital markets revenue and near-term growth visibility.

Strengths (+$4 to +$8):

  • Wealth inflows: $59 B new assets despite tax-related outflows
  • Trading strength: Equities +23%, Fixed Income +9% YoY
  • Capital returns: Dividend raised to $1/share (~2.8% yield) and $20 B buyback
  • Strong profitability: ROTCE at 18.2%, EPS beat of 7.6%

Weaknesses (−$3 to −$6):

  • Investment banking lag: −5% YoY vs Goldman’s +26%
  • Expense growth: Costs rising faster than some revenue lines
  • Client outflows: Tax outflows muted net inflow impact

Opportunities (+$3 to +$7):

  • Cross-selling E*TRADE clients within Wealth Management
  • Tech and AI investments to enhance operating leverage
  • Rebound in IPO/M&A could significantly lift investment banking revenues

Threats (−$4 to −$7):

  • Macro risks: Slowing economy could cut dealmaking & trading volumes
  • Regulatory pressures: Higher capital requirements could restrict buybacks
  • Competitive fee pressure: Margin erosion in Wealth Management & brokerage

Net SWOT price impact: −$7 to +$8 (implying short-term trading range between ~$136 and $151).


SWOT Table

Morgan Stanley Q2 2025 SWOT analysis table showing strengths, weaknesses, opportunities, and threats with estimated stock price impact ranges.
Horizontal bar chart showing Morgan Stanley Q2 2025 SWOT price impact ranges with consistent label spacing and X-axis starting at -6%.

Valuation Scenarios

Current price: ~$143.56

  • Bull Case (30%):
    IB revenue rebounds +5%, WM inflows >$50 B/quarter, ROTCE >18%.
    Target: $162
  • Base Case (50%):
    Stable WM inflows, trading moderates, IB remains sluggish.
    Target: $144
  • Bear Case (20%):
    WM growth slows, trading revenue drops, regulatory capital costs rise.
    Target: $121

Probability‑weighted fair value:(0.3 × 162) + (0.5 × 144) + (0.2 × 121) = **$144.3**

Fair value: ~$144
Assessment: Fairly valued. Any upside depends on an M&A/IPO rebound and sustained asset growth in Wealth Management.

Bar chart showing Morgan Stanley Q2 2025 valuation scenarios: Bear case at $121, Base case at $144, Bull case at $162, with a dotted line indicating fair value at $144.3.

12‑Month Outlook

Looking ahead, Morgan Stanley’s fortunes will hinge on:

  • Capital markets recovery: IPO/M&A activity improving in 2026 could reaccelerate IB revenue.
  • Sustained Wealth inflows: Maintaining $50 B+/quarter will support fee growth and capital returns.
  • Regulatory clarity: New capital requirements could affect buyback pace.

Verdict

Morgan Stanley remains a defensive, shareholder-friendly play, with stable wealth-led earnings and enhanced capital returns. While near-term upside is capped by muted deal activity, long-term investors benefit from solid dividends, repurchases, and consistent profitability.


Call to Action

Are you bullish on Morgan Stanley’s wealth-first strategy? Drop your thoughts below, and subscribe for more SWOT-driven earnings breakdowns to help you invest smarter.


Disclaimer

This analysis is based solely on Morgan Stanley’s official Q2 2025 financial report and earnings call transcript. It is for informational purposes only and is not investment advice.


Leave a comment