Goldman Sachs Q2 2025: Resilient Earnings, Bigger Payouts, and Competitive Edge Among Peers

Goldman Sachs reported Q2 2025 earnings with EPS of $10.91 and revenue of $14.58 billion, exceeding expectations. The bank raised its dividend by 33%, repurchased $3 billion in stock, and maintained strong capital ratios. Despite some cyclical weaknesses, it shows potential for growth in advisory services and wealth management.

TL;DR — What You Need to Know

Goldman Sachs posted EPS of $10.91 on $14.58 billion revenue, beating expectations. The bank raised its quarterly dividend by 33% and repurchased nearly $3 billion in stock, returning over $4 billion to shareholders. With a book value per share of ~$349.7 and a CET 1 ratio of 14.5%, Goldman’s capital position remains strong. Our probability‑weighted fair value: ~$731, slightly above the current share price of ~$724.


Quarter Recap

Goldman Sachs delivered net revenues of $14.58 billion in Q2 2025, up 15% YoY, driven by a strong rebound in trading and advisory revenues. Net earnings came in at $3.72 billion, translating to EPS of $10.91, ahead of consensus expectations.

Assets under supervision hit a record $3.29 trillion, growing by $120 billion in a single quarter. Book value per share now stands at ~$349.7, with a CET 1 capital ratio of 14.5%, providing a robust buffer against market and regulatory risks.

CEO David Solomon noted that Goldman’s pipeline for advisory work is “healthy and diversified across sectors,” while CFO Denis Coleman pointed to anticipated deal flow from technology, healthcare, and energy, supporting investment banking revenues in H2.


Key Highlights

  • Revenue beat: $14.58 B (+15% YoY) on strong trading and advisory results.
  • EPS: $10.91 vs. consensus of ~$9.7–$9.8.
  • ROE: 12.8%, up sharply from 2023 lows.
  • Dividend hike: From $3 → $4 per share (+33%), starting Q3 2025.
  • Share repurchases: Nearly $3 billion in buybacks, for total shareholder return over $4 billion this quarter.
  • Capital strength: Book value per share: ~$349.7CET 1 ratio: 14.5%.
  • Record AUS: $3.29 T, enhancing fee‑based stability.
Line chart showing Goldman Sachs revenue and net income for the past five quarters, highlighting Q2 2025 revenue at $14.58 billion and net income at $3.72 billion.

Peer Comparison: Goldman vs JPMorgan vs Morgan Stanley

Peer comparison table showing Goldman Sachs versus JPMorgan and Morgan Stanley for Q2 2025, including ROE, forward P/E ratio, dividend yield, and book value per share.

Goldman trades at a discounted P/E compared to JPM and MS but offers a smaller dividend yield, which is now improving with its 33% payout increase.

Grouped bar chart comparing Goldman Sachs, JPMorgan, and Morgan Stanley for Q2 2025 across three metrics: ROE (%, green), forward P/E ratio (blue), and dividend yield (%, orange).

Dividend Growth in Context

Goldman’s dividend hike to $4/share marks one of its largest increases in a decade, reflecting confidence in sustainable earnings.

Bar chart showing Goldman Sachs quarterly dividend per share from 2020 to 2025, highlighting an increase from $2.0 in 2020 to $4.0 in 2025 following a 33% hike.

At current prices, the yield is ~2.2%, moving closer to peers like Morgan Stanley (3.1%) and JPMorgan (2.6%).


SWOT Analysis (with Price Impact)

Strengths (+$15–$25 impact)

  • Robust revenue growth: 15% YoY, with strong trading and M&A advisory.
  • Capital returns: 33% dividend hike and $3 B in buybacks signal capital efficiency.
  • Book value & capital buffer: $349.7 BVPS, CET 1 at 14.5%.
  • Improved ROE: 12.8%, showing recovery from post‑pandemic lows.

Weaknesses (–$8–$12 impact)

  • Reliance on trading: Equities revenue is cyclical and market-dependent.
  • Subdued consumer banking: Marcus platform still underperforming.
  • Rising expenses: Operating costs up 6% YoY, with more spend on tech and compliance.

Opportunities (+$10–$18 impact)

  • M&A & capital markets revival: Advisory pipeline in tech, energy, and healthcare indicates momentum in H2 2025.
  • Wealth management growth: Record AUS positions Goldman for fee expansion.
  • Technology leverage: AI and automation investments could boost efficiency.

Threats (–$12–$20 impact)

  • Macro headwinds: Tariffs, election‑year volatility, and slower global growth may hurt client activity.
  • Speculative market behavior: Management flagged rising “retail‑driven trading excesses” as a systemic risk.
  • Regulatory tightening: Basel III and other potential capital rules could cap returns.

SWOT Summary Table

Horizontal bar chart showing estimated price impact of SWOT factors for Goldman Sachs Q2 2025 with closer label placement for negative values: Threats (-16), Opportunities (+14), Weaknesses (-10), Strengths (+20), and a vertical line at zero.

Valuation Scenarios (Price Targets)

  • Base Case (50% probability): $725
    Assumes mid‑single‑digit revenue growth in H2, steady trading, and continued buybacks/dividends.
  • Bull Case (30% probability): $780
    Assumes a robust M&A rebound, sustained trading momentum, and controlled expense growth.
  • Bear Case (20% probability): $670
    Assumes a slowdown in advisory and trading, plus stricter capital requirements.

Probability‑Weighted Fair Value:

(0.5×725)+(0.3×780)+(0.2×670)=730.5(0.5×725)+(0.3×780)+(0.2×670)=730.5

→ Fair Value: ≈ $731


How This Compares to Other Valuations

Community-based models (e.g., Simply Wall St) place fair value between $594–$701. Our $731 target reflects a higher confidence in Goldman’s capital efficiency, pipeline strength, and capital return policy—but also assumes macro risks remain manageable.


Vertical bar chart showing Goldman Sachs Q2 2025 valuation scenarios: Bear case $670, Base case $725, Bull case $780, with a dotted line indicating Fair Value at $731.

Verdict

At $731, for value investors, it offers:

  • Resilient earnings in a diversified revenue base,
  • Stronger capital returns (higher dividends + buybacks),
  • Attractive capital buffers supporting stability.

Compared to peers, Goldman trades at a discounted valuation but offers lower yield, which is now improving. For income-focused investors who value both stability and growth in payouts, Goldman looks like a steady hold with modest upside.


Call to Action

Do you see Goldman’s trading and advisory strength continuing into H2? Are you adding bank stocks to your portfolio this year? Share your thoughts in the comments or join the conversation on our LinkedIn page.


Disclaimer

This analysis is based solely on Goldman Sachs’ official Q2 2025 financial report and earnings call. It is for informational purposes only and does not constitute financial advice.


Leave a comment


Bank of America Q2 2025: Earnings Beat, Dividend Growth Ahead, and a Fair Value Play for Income Investors

TL;DR

Bank of America posted Q2 2025 EPS of $0.89, topping expectations, driven by record net interest income and robust trading revenue. Management reaffirmed NII guidance toward $15.5–$15.7 billion and announced an 8% dividend hike (raising forward yield to ~3.2%). While credit risks in commercial real estate and macro uncertainties persist, BAC remains fairly valued near $48, making it a steady, income‑oriented choice for DIY value investors.


Quarter Recap

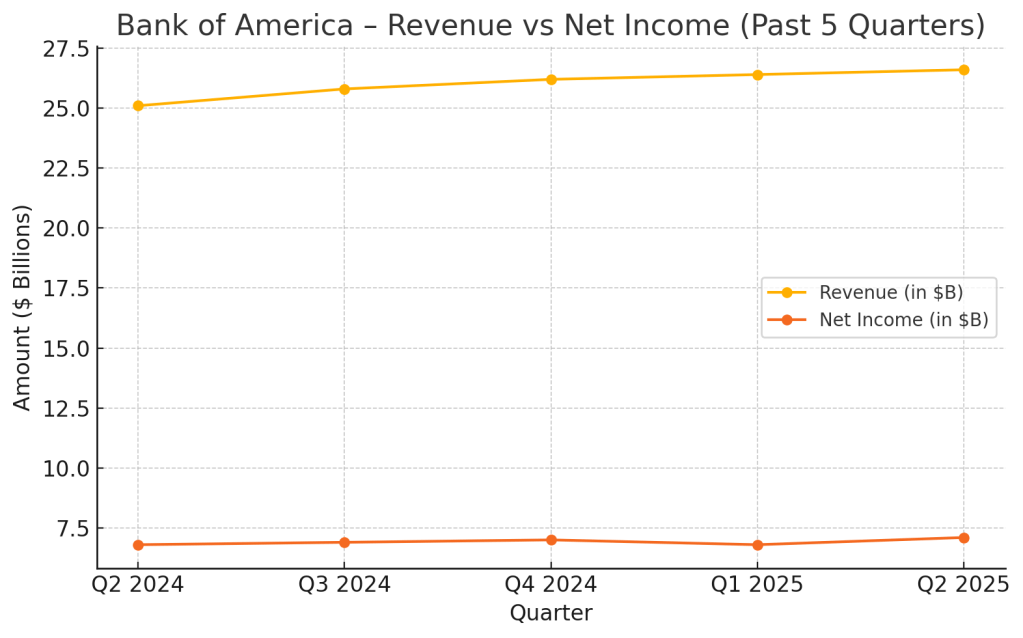
In Q2 2025, Bank of America reported revenue of $26.6 billion (+4% YoY) with net interest income (NII) reaching $14.8 billion — a record high. Net income rose to $7.1 billion (EPS $0.89), beating estimates by 3 cents.

Management highlighted:

  • Efficiency progress: Non‑interest expenses dropped ~$600 million QoQ, with a target to reach ~60% efficiency ratio.
  • Deposit strength: 8th straight quarter of deposit growth, with average checking balances rising from $6K to $9.2K YoY.
  • Credit costs: Provisions increased to ~$1.6 billion, mainly from office‑related CRE loans.
  • Trading resilience: Markets revenue rose ~15% YoY, with management expecting a 13‑quarter growth streak to continue.
  • Shareholder returns: $7.3 billion in Q2 (dividends + buybacks) and an 8% dividend increase announced for Q3.

Key Highlights

  • EPS: $0.89 (+7% YoY), beat by 3 cents
  • Revenue: $26.6 billion (+4% YoY)
  • Net Interest Income: $14.8 billion (record)
  • Efficiency: Expenses down $600 million QoQ; targeting ~60% ratio
  • Dividend: 8% hike brings forward yield to ~3.2%
  • Asset quality: Net charge‑offs of $1.5 billion; provisions up to $1.6 billion
  • Deposits: 8th consecutive quarter of growth
Line chart showing Bank of America revenue and net income over the past five quarters, highlighting Q2 2025 growth in both metrics.

SWOT Analysis

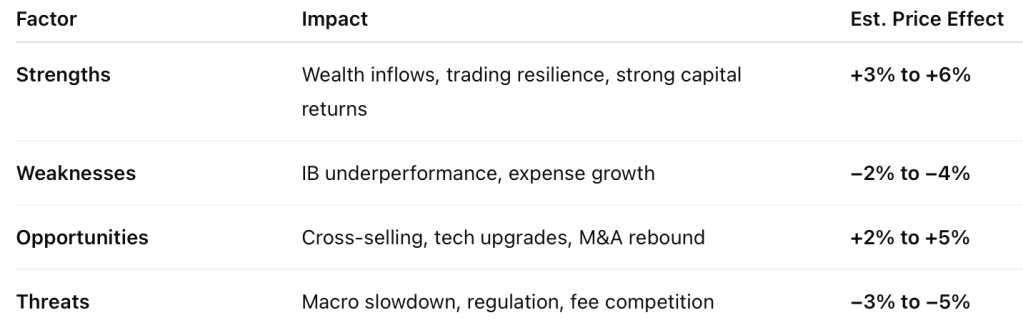
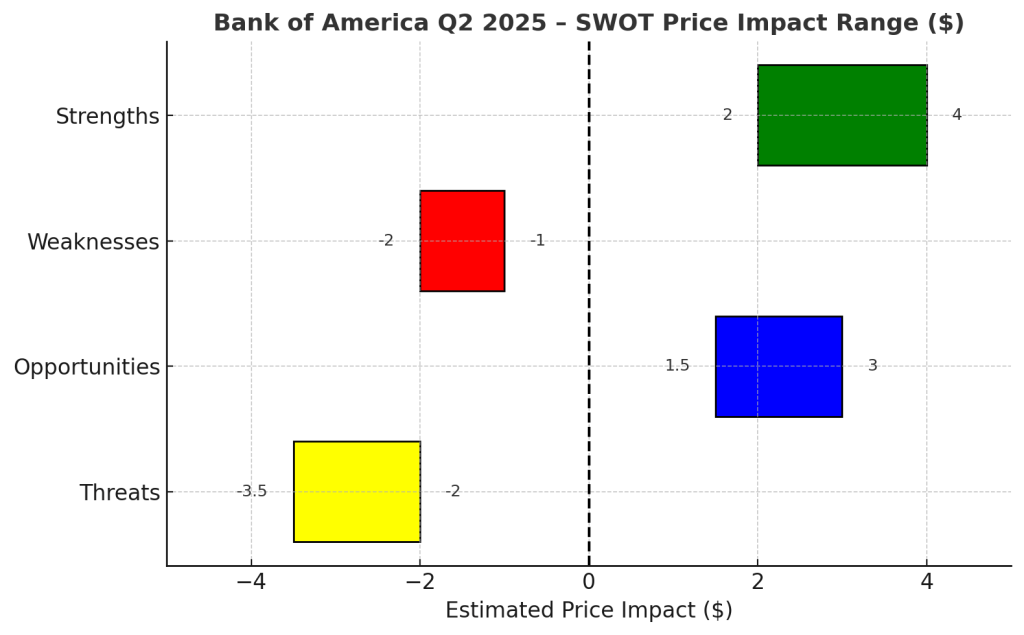
  • Strengths (+$2 – 4 impact):
    Record NII, diversified revenue streams, improving efficiency, and a dividend hike reflecting capital confidence.
  • Weaknesses (−$1 – 2 impact):
    Slower revenue growth than peers, elevated CRE‑related losses, and a still‑high expense base.
  • Opportunities (+$1.5 – 3 impact):
    AI & digital investments, sustained deposit momentum, expanding trading revenue, and higher dividend yield enhancing total return.
  • Threats (−$2 – 3.5 impact):
    Tariff‑driven macro risks, potential Fed rate cuts compressing NII, and rising credit costs in commercial real estate.

Net price impact: ≈ +$1.0–1.5/share vs. pre‑earnings levels, supporting the current range.


SWOT Summary Table

Bank of America Q2 2025 SWOT price impact analysis table showing strengths, weaknesses, opportunities, and threats with estimated stock price impacts.
Bar chart showing Bank of America Q2 2025 SWOT price impact ranges: strengths (+2 to +4), weaknesses (−1 to −2), opportunities (+1.5 to +3), and threats (−2 to −3.5), with X-axis starting at −5.

Valuation Scenarios

To frame a realistic outlook for Bank of America’s stock, we modeled three scenarios based on management’s guidance, Q2 results, and macro risks. The Base Case assumes steady EPS growth, stable net interest income, and controlled expenses, keeping the stock near its current range. The Bull Case reflects a scenario where trading revenue momentum accelerates, the efficiency ratio improves faster toward the 60% target, and net interest income benefits from a slower‑than‑expected pace of Fed rate cuts. Conversely, the Bear Case factors in higher commercial real estate charge‑offs and a compressed margin environment from rapid rate cuts. These scenarios give a clear range of plausible outcomes for value investors, balancing potential upside with key risks.

Bank of America Q2 2025 valuation scenarios table showing bull case at $52, base case at $48, and bear case at $42 with probability-weighted fair value of $48.

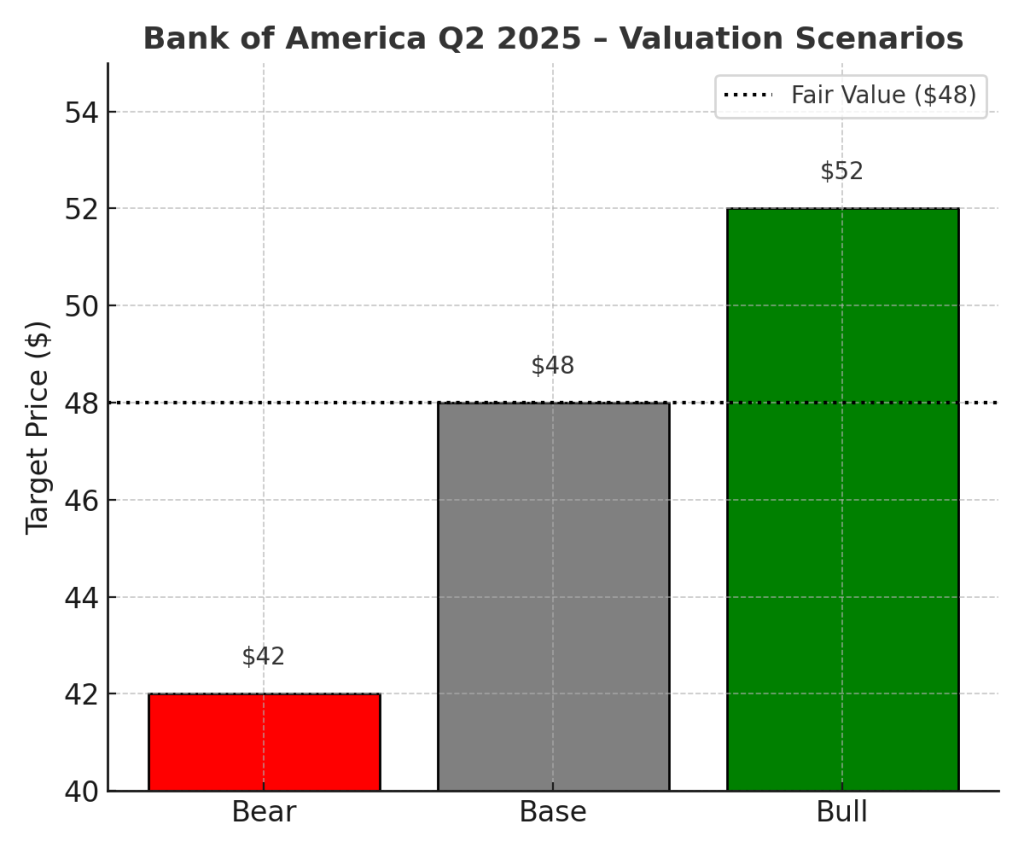
Probability‑Weighted Fair Value:(0.5 × 48) + (0.3 × 52) + (0.2 × 42) ≈ $48

Bar chart showing Bank of America Q2 2025 valuation scenarios: Bear case at $42, Base case at $48, and Bull case at $52, with a dotted line for the $48 fair value.

Dividend Growth Snapshot

Bank of America’s 8% dividend hike for Q3 2025 raises the quarterly payout from $0.24 to $0.26 per share, pushing the forward yield to roughly 3.2% at current prices. This increase continues the bank’s consistent multi‑year trend of dividend growth, reflecting management’s confidence in earnings stability and capital strength. Combined with $7.3 billion in share buybacks during Q2, this makes BAC a compelling choice for income‑focused investors who prioritize reliable cash returns and long‑term capital appreciation.

  • Q2 dividend: $0.24/share → Q3: $0.26/share
  • 8% increase = forward yield of ~3.2% at $48/share

Peer Comparison

When compared to its large‑cap U.S. banking peers, Bank of America sits in the middle of the pack. At a price‑to‑book ratio of ~1.3× and forward P/E around 13×, it trades cheaper than JPMorgan (P/B ~1.6×, P/E ~12×) but at a premium to Citigroup (P/B ~0.8×, P/E ~9×). Dividend yield at ~3.2% (post‑hike) makes BAC more attractive than JPMorgan (~2.8%) but still below Citi’s ~4%. This positioning reflects its balanced profile: steadier than Citi, but with less growth momentum than JPMorgan — a mix that appeals to value‑oriented investors seeking income without extreme risk exposure.

Peer comparison table for Bank of America Q2 2025 versus JPMorgan and Citigroup, showing price-to-book, price-to-earnings, and dividend yield metrics.

Verdict

At ≈$48/share, BAC trades close to our fair value estimate. For DIY value investors, it offers steady dividendsaggressive buybacks, and a resilient balance sheet. While upside is modest without macro support, the dividend hikeand sustained trading & deposit growth make it a hold‑to‑accumulate for long‑term portfolios.


Call to Action

Do you hold Bank of America or other bank stocks? Comment below — is BAC your top pick for steady income, or do you prefer peers like Citi or JPMorgan?


Disclaimer

This analysis is for informational purposes only and based solely on Bank of America’s official Q2 2025 financial report and earnings call. It does not constitute financial advice. Please consult a licensed advisor before making investment decisions.

SAP Q2 2025 Earnings: Cloud Momentum, AI Push — Is This Pullback a Buy?

SAP’s Q2 2025 earnings delivered 24% cloud growth, margin expansion, and a strong AI roadmap, yet shares dipped 6%. Is this a buying opportunity for growth investors?

TL;DR

SAP’s Q2 2025 delivered 24% YoY cloud growth83% free cash flow surge, and margin expansion, yet the stock dropped ~6%. For growth‑minded investors, this may be an opportunity to accumulate, as SAP pushes deeper into AI‑driven enterprise solutions and China expansion, though macro and FX risks remain.


Quarter Recap: Why This Matters to Growth Investors

SAP posted Q2 revenues of €9.43B, driven by cloud revenue of €5.13B (+24% YoY) and a backlog increase of 22%Operating margin rose to 27.2% (+1.8pp), while free cash flow surged 83% to €2.36B.

So why did shares drop ~6%? The market zeroed in on slowing backlog growthmacroeconomic uncertainty, and FX drag, which overshadowed the otherwise strong report.

Why you should care: SAP’s fundamentals still point to a cloud‑first, AI‑powered transformation with improving profitability — a combination attractive for growth investors with a mid‑term horizon.


Key Highlights

  • Cloud revenue: €5.13B (+24% YoY)
  • Total backlog: +22% YoY
  • Operating margin27.2% (+1.8pp YoY)
  • Free cash flow€2.36B (+83% YoY)
  • Share buyback: Up to €5B, supporting EPS
Line chart showing SAP’s revenue and net income over the past five quarters, highlighting steady growth through Q2 2025.

AI: More Than a Buzzword — What SAP Is Building

SAP is embedding generative AI into its Business AI platform, integrating tools across ERP, procurement, and HR. It’s also expanding AI‑as‑a‑service offerings, giving customers access to pre‑built, domain‑specific AI models.

CEO Christian Klein emphasized that AI is “not just an add‑on but core to SAP’s next‑generation enterprise software.” This positions SAP to capture higher‑margin, stickier revenue as clients adopt AI‑enhanced workflows.


Peer Comparison: How Does SAP Stack Up?

Bar chart comparing SAP, Oracle, and Microsoft in Q2 2025 for cloud growth percentage, operating margin percentage, and P/E ratio.
  • SAP: Cloud +24%, margin 27.2%, P/E ~24x
  • Oracle: Cloud +20%, margin ~41%, P/E ~30x
  • Microsoft (Intelligent Cloud): +21%, margin ~42%, P/E ~35x

SAP trades at a relative discount while maintaining competitive growth — a point for long‑term investors to watch.


SWOT Analysis: Price Impact on the Table

SAP’s Q2 shows resilience in cloudgrowing AI initiatives, and geographic diversification, offset by backlog sensitivity and macro risk.

Horizontal bar chart showing SAP Q2 2025 SWOT price impact: strengths and opportunities with positive effects, weaknesses and threats with negative effects.
SWOT analysis table for SAP Q2 2025 showing strengths, weaknesses, opportunities, and threats with estimated price impact ranges.

Valuation Scenarios: Where Could the Stock Go?

Bar chart showing SAP Q2 2025 valuation scenarios: Bear case €165, Base case €200, Bull case €230, Current Price €185, with a dotted line marking the fair value at €199.
Valuation scenarios table for SAP Q2 2025 showing bull, base, and bear cases with assumptions, target prices, and probabilities.

Probability‑Weighted Fair Value:
(0.50 × 200) + (0.25 × 230) + (0.25 × 165) = €198.75 (~€199).


Verdict: An Attractive Mid‑Term Entry for Growth Investors

SAP is cheaper than its peers, with comparable growth and a clear AI‑driven roadmap. The post‑earnings dip brings it within our fair value range (€195–205), offering a tactical entry for investors who believe in its AI and China growth story.


Call to Action: Should You Buy?

Before adding SAP, ask yourself:

  • Do you believe AI integration will drive higher‑margin growth?
  • Are you comfortable with China exposure amid global trade uncertainty?
  • Does SAP’s valuation vs. Oracle/Microsoft justify a position in your portfolio?

Join the conversation: What’s your take on SAP’s AI pivot? Share your thoughts in the comments and explore more at SWOTstock.com.


Disclaimer

This article is for informational purposes only and does not constitute investment advice. All analysis is based solely on SAP’s official Q2 2025 financial statements, earnings call transcript, and management commentary.


Leave a comment