💡 Alphabet Q3 2025 Earnings — A $100 B Quarter that Still Feels Underpriced

Alphabet (GOOGL) achieved over $100 billion in quarterly revenue for the first time, showing 16% year-over-year growth. Key drivers include a strong Cloud business and effective YouTube monetization. Despite CapEx concerns, the company remains cash-rich, positioning itself for long-term growth in AI and other sectors, recommending a hold strategy.

TL;DR Summary

Alphabet (GOOGL:NASDAQ) just passed the $100 billion quarterly revenue mark for the first time — growing 16 % year over year with broad strength across Search, YouTube, and Cloud. Despite record profits, the stock still trades near fair value, offering patient investors a long-term compounding story powered by disciplined AI execution.


Q3 2025 Financial Highlights

  • Revenue: $102.3 B (+16 % YoY)
  • Operating Income: $31.7 B (+23 %)
  • EPS: $2.87 (diluted)
  • Google Cloud: $15.2 B (+34 %), operating margin 9 % (up from 5 %)
  • YouTube Ads: +18 % YoY, Shorts monetization gaining traction
  • Buybacks: $15 B this quarter
  • CapEx: Guidance raised to $91–93 B (from $85 B) to expand AI infrastructure

Management Commentary — The AI Era at Work

CEO Sundar Pichai described the quarter as “a reflection of how AI is transforming every corner of our business.”
He highlighted how Gemini models are now woven across Search, Workspace, and Android, while Google Cloud has become “a foundation for the next wave of AI applications.”

Pichai also drew attention to Waymo’s momentum, noting tens of thousands of fully autonomous rides weekly — a reminder that Alphabet’s portfolio still holds long-term optionality beyond advertising.
CFO Ruth Porat reiterated a focus on “disciplined investment” and sustainable capital returns, ensuring AI expansion doesn’t come at the expense of profitability.


Market Reaction

Shares rose roughly 6 % post-earnings to around $288, as investors applauded Alphabet’s combination of growth and cost control.
Growth investors celebrated the $100 B milestone; value investors noticed something quieter but more powerful — free-cash-flow compounding and balance-sheet strength, with over $100 B in cash and a business model that still prints double-digit operating margins despite surging AI spend.


SWOT Analysis — What’s Driving and Challenging Alphabet

Strengths — The Engine Still Scales

  • Alphabet’s ability to integrate AI across core products has turned efficiency into a margin lever, driving a 23 % jump in operating income.
  • Cloud growth of +34 % confirms enterprise adoption of Google AI and Vertex AI, while YouTube continues to monetize Shorts effectively.
  • A balance sheet boasting $109 B in cash and $80 B in free cash flow gives management the flexibility to invest and repurchase shares without financial strain.
  • These elements together could support a 6 – 12 % upside in valuation, equivalent to +$16–32 per share, if current trends hold.

Weaknesses — Spending Before the Payoff

  • The biggest risk near term is CapEx intensity: management raised 2025 guidance to $91–93 B, pushing short-term margins down to 31 %.
  • Cloud infrastructure build-out and TPU chip development consume cash before incremental revenue arrives.
  • For value investors, this is the “patience tax” — reinvestment that depresses earnings temporarily but is critical to maintain AI leadership. Estimated drag: −6 to −10 % on near-term fair value.

Opportunities — Optionality Beyond Ads

  • The rollout of Gemini-powered experiences across Search and Workspace is still early. If user engagement and monetization scale as expected, Alphabet could open entirely new revenue lines within existing products.
  • Waymo’s commercialization offers an overlooked lever: as autonomous rides expand to new cities, the segment could evolve from cost center to strategic asset.
  • Together, these trends imply +8 to +15 % potential uplift as new businesses begin contributing meaningfully.

Threats — The Unseen Headwinds

  • Alphabet faces regulatory pressure in the U.S. and EU that could reshape how it structures Search partnerships.
  • Rising AI training costs and limited chip supply could inflate unit economics in 2026.
  • Global digital tax initiatives also threaten to trim net margins.
  • These could shave 10 – 18 % off valuation in a downside scenario.
Bar chart showing Alphabet Q3 2025 SWOT price impact ranges: Strengths (+16 to +32 USD, green), Weaknesses (−28 to −17 USD, red), Opportunities (+23 to +40 USD, blue), and Threats (−50 to −28 USD, yellow), with a dashed vertical line at zero indicating estimated stock price effects.

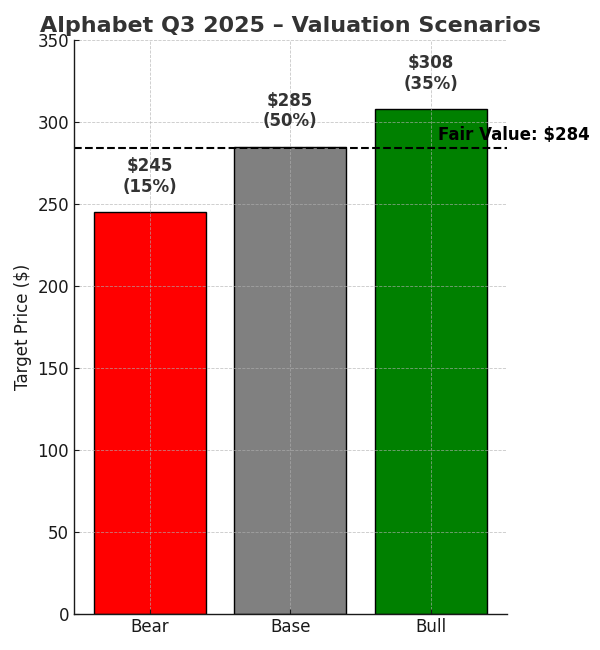
Valuation Scenarios — Fair Value Still Around $284

Bull Case (35 % probability)
If Gemini monetization accelerates and Cloud margins surpass 10 %, EPS could reach $14 in FY 2026. At 22× earnings, that implies a $308 target — driven by full AI adoption and modest multiple expansion.

Base Case (50 % probability)
A more realistic view assumes 12 % revenue growth and modest margin recovery. With EPS near $13 and 20× multiple, fair value sits at $285 — consistent with steady compounding and disciplined reinvestment.

Bear Case (15 % probability)
If regulatory constraints slow Search deals or AI costs balloon, EPS might stall around $12. Applying 17× multiple yields $245 per share.
Even here, Alphabet remains profitable and cash-rich, limiting true downside risk.

Weighted Fair Value: ≈ $284/share — almost identical to where the stock trades now (~$288).
For long-term holders, that suggests limited short-term upside but strong margin of safety given cash reserves and buyback velocity.

Vertical bar chart showing Alphabet Q3 2025 valuation scenarios: Bear case $245 (15%), Base case $285 (50%), and Bull case $308 (35%), with a dashed horizontal line marking fair value at $284 per share.

Verdict — Hold, Accumulate Below $270

Alphabet remains a quiet compounding engine: dominant in AI infrastructure, prudent in spending, and generous in shareholder returns.
At $288, the stock sits near intrinsic value. But below $270, its 3.5 % free-cash-flow yield and recurring revenue make it a compelling long-term hold for patient investors.

For value investors, the strategy is clear: own quality, wait through the CapEx cycle, and let compounding do the work.


What to Watch Next

  • Gemini monetization in Search and YouTube
  • Cloud profitability progression toward 10 %+ margins
  • DOJ antitrust outcomes and global tax rulings
  • Returns from AI infrastructure CapEx and Waymo expansion

Call to Action

Follow SWOTstock for clear, fundamentals-based coverage of high-cash-flow AI compounders like Alphabet, Microsoft, and Amazon.
Subscribe to receive new posts right after each earnings call.


Disclaimer

This analysis is based solely on Alphabet Inc. official Q3 2025 financial report and earnings call transcript.
It is not investment advice. Please conduct independent research before investing.


One response to “💡 Alphabet Q3 2025 Earnings — A $100 B Quarter that Still Feels Underpriced”

Leave a comment

Goldman Sachs and Morgan Stanley: A High-Stakes Earnings Season for Wall Street’s Finest

Preview the upcoming Q2 2025 earnings for Goldman Sachs and Morgan Stanley. Explore key themes, strategic differences, and what investors should watch as Wall Street’s top banks report.

TL;DR – Two Different Engines, One Market Test

As Goldman Sachs and Morgan Stanley prepare to report their second-quarter results, investors are watching closely to see how two of Wall Street’s most iconic firms are navigating a shifting macro environment. While Morgan Stanley has leaned into wealth management as its long-term growth pillar, Goldman continues to reposition itself after a retreat from consumer banking and a volatile stretch in investment banking. The upcoming earnings will offer a fresh look at which model is winning in 2025—and whether either name is undervalued relative to its forward potential.


Q1 Recap: Strategic Divergence on Full Display

In the first quarter of 2025, the divergence in strategy between these two institutions became increasingly evident. Goldman Sachs delivered better-than-expected results, driven largely by strength in its global markets division—particularly fixed income and commodities trading. While investment banking revenues remained muted, the firm’s Asset and Wealth Management segment showed encouraging growth, quietly contributing to earnings stability amid broader volatility.

Morgan Stanley, in contrast, leaned into its now-dominant wealth management franchise, which continues to anchor its earnings with more predictable, fee-based income. Trading revenues were healthy, though less volatile than Goldman’s, and investment banking activity remained sluggish. The integration of E*TRADE and Eaton Vance appears to be progressing, but margins continue to be scrutinized by analysts who want to see more operating leverage.

Both stocks have tracked broader market gains this year, aided by rising investor sentiment and increased risk appetite. However, the strong run-up in equity markets sets a higher bar for Q2 performance—and makes any shortfall more likely to trigger a valuation reset.


Q2 2025 Preview: Key Themes to Watch

📈 1. Investment Banking Activity and the M&A Pipeline

The long-awaited recovery in deal activity has been uneven, but early signs point to a modest thaw in M&A and equity underwriting markets. Investors will want to see whether either bank is capturing greater wallet share as clients cautiously return to the table. Goldman, with its deep advisory bench, may be positioned to benefit from any early rebound.

💼 2. Wealth Management Profitability and Scale

Morgan Stanley’s wealth business, now a cornerstone of its strategy, remains in focus—particularly operating margins and net new assets. Investors will look for signs that scale advantages from prior acquisitions are beginning to deliver incremental earnings leverage. Conversely, any slip in cost discipline or fee compression could raise concerns about future growth.

📊 3. Trading Performance and Market Volatility

With macro volatility subsiding somewhat in Q2, trading desks may face tougher year-over-year comps. Goldman’s exposure to fixed income and commodities could give it an edge in any remaining dislocations. Morgan Stanley’s more balanced exposure may serve it well in calmer markets, but could also limit upside if activity is muted.

🏦 4. Strategic Repositioning at Goldman

Goldman’s exit from its consumer ventures continues to unfold, and the second quarter may offer further updates on its plans to streamline operations and refocus capital. While these efforts have weighed on sentiment in the past, clarity and discipline in execution could turn the narrative more constructive.

💰 5. Capital Return and CET1 Management

Both firms are expected to comment on their capital return strategies following the latest Fed stress test results. Goldman has historically been more aggressive with buybacks, while Morgan Stanley may emphasize stability and capital preservation. Investors will weigh these decisions against current payout ratios and the firms’ risk-weighted asset profiles.


SWOT Analysis: Comparing Strategic Profiles

SWOT analysis table comparing Goldman Sachs and Morgan Stanley ahead of Q2 2025 earnings, highlighting strengths, weaknesses, opportunities, and threats for each firm.

Valuation in Context: Discounted for Uncertainty

From a valuation perspective, both firms trade at a discount to their historical averages, reflecting persistent questions around the pace of recovery in core businesses.

  • Goldman Sachs (GS) is currently trading at approximately 11.2x forward earnings, a discount that arguably reflects both the overhang from its consumer pivot and cyclical risk in trading and advisory.
  • Morgan Stanley (MS) commands a higher multiple, at around 13.3x forward earnings, underpinned by the predictability of its wealth franchise and a more balanced revenue base.

However, if investment banking activity accelerates meaningfully in the second half of the year, Goldman may be poised for a multiple re-rating. Conversely, if market volatility diminishes further, Morgan Stanley’s stable income streams may prove more defensive.


Bottom Line: Different Models, Same Market Test

As both firms head into Q2 earnings, the contrast between Goldman’s capital markets orientation and Morgan Stanley’s wealth-driven stability will once again be on full display. Investors will be looking not only for solid headline numbers, but for forward guidance that supports each firm’s strategic trajectory. Whether it’s Goldman’s return to its core strengths or Morgan Stanley’s steady ascent in fee-based income, the upcoming results could significantly shift investor sentiment—and relative valuations—for the rest of the year.


Stay Ahead of the Curve

📩 Subscribe to SWOTstock.com for full earnings recaps, updated SWOT profiles, and revised valuation scenarios for both Goldman Sachs and Morgan Stanley—posted immediately after earnings are released.


Disclaimer

This article is for informational purposes only and does not constitute financial advice or a recommendation to buy or sell any securities. Always perform your own due diligence or consult a licensed financial advisor before making investment decisions.


Leave a comment


Micron Is Back in the Game: Q3 2025 Proves AI Demand Is Real — But Is the Stock Still a Buy?

Micron’s Q3 FY2025 earnings reveal a strong AI-driven rebound with record DRAM sales, margin expansion, and rising profitability. Explore our SWOT analysis, valuation scenarios, and stock price outlook based solely on official financials and management commentary.

TL;DR Summary

Micron (NASDAQ:MU) reported blockbuster Q3 FY2025 earnings, fueled by explosive growth in AI memory demand — especially for high-bandwidth memory (HBM), which exceeded $1 billion for the quarter and is already sold out for 2025. With EPS of $1.91 and Q4 guidance pointing even higher, Micron is making a strong case for a rerating. Our updated fair value estimate is $135.50, implying modest upside from current levels, but more importantly, confirming Micron’s transition from cyclical to structural relevance in the AI build-out.


Quarter Recap: A Turning Point in the Cycle

For years, Micron has lived and died by the memory cycle. But Q3 FY2025 feels different. The company reported its highest-ever quarterly revenue at $9.3 billion, a 37% year-over-year increase. DRAM led the charge, generating $7.1 billion, while HBM demand — largely driven by AI servers — grew over 50% quarter-over-quarter and surpassed $1 billion for the first time. Management confirmed that all HBM supply is committed through the end of 2025, signaling not just demand, but pricing power.

Gross margin came in at 39% (non-GAAP), and EPS surged to $1.91, up from a loss just one year ago. More importantly, free cash flow turned decisively positive at $1.95 billion, providing flexibility for both investment and shareholder return.

Micron also reaffirmed its long-term strategic positioning with a $200 billion commitment to U.S. manufacturing and R&D under the CHIPS Act. This isn’t just a bounce-back quarter — it looks like a foundation for a new phase of sustained growth.

Line chart showing Micron’s revenue and net income over the past five quarters. Revenue steadily rises from $3.75 billion in Q3 FY24 to $9.30 billion in Q3 FY25. Net income starts at –$1.9 billion, remains negative until Q1 FY25, then turns positive in Q2 FY25 and reaches $1.89 billion in Q3 FY25. The chart includes a horizontal dashed line at zero to mark the breakeven point.

What’s Fueling the Momentum?

The key driver is unmistakably AI. As hyperscalers expand their infrastructure to support large language models and enterprise AI deployments, demand for advanced memory — particularly HBM and DDR5 — has exploded. Micron’s unique position as one of just a few players in this space is enabling it to lock in customers at strong margins.

But it’s not just the top line that’s improving. Operating leverage is finally kicking in. Inventory days are falling, CapEx is normalizing, and the company’s balance sheet is healthy with over $27.9 billion in total liquidity. For growth investors watching this space, Micron is beginning to look like a structurally profitable company, not just a cyclical memory supplier.

Stacked bar chart showing Micron’s DRAM and NAND revenue over the last five quarters. DRAM revenue increases from $2.75 billion in Q3 FY24 to $7.10 billion in Q3 FY25. NAND revenue grows from $1.00 billion to $2.20 billion over the same period. DRAM consistently contributes the larger share of total revenue, with a noticeable acceleration starting in Q1 FY25

SWOT Analysis: Breaking Down the Fundamentals

Rather than relying on sentiment or social media buzz, let’s unpack the key forces driving Micron’s stock — both good and bad — based on official data and management commentary.

Bar chart showing estimated stock price impact ranges for Micron Q3 FY2025 by SWOT category. From top to bottom: Strengths range from +15 to +25 USD, Weaknesses from –10 to –5 USD, Opportunities from +10 to +20 USD, and Threats from –15 to –10 USD. Bars are color-coded green, red, blue, and yellow respectively. The x-axis ranges from –20 to 25 USD per share, indicating estimated contribution to Micron’s stock price from each factor.

Strengths (+$15 to +25/share)

Micron’s execution in AI memory is the real story. HBM revenue not only topped $1B but is fully booked through next year. The 1-gamma DRAM node — with 30% density and 20% power improvements — is entering early production, providing a margin and performance edge.

Weaknesses (–$5 to –10/share)

Despite DRAM’s strength, NAND continues to underperform (+4% YoY), and high CapEx levels weigh on near-term cash conversion. There’s also concentration risk — a handful of cloud customers drive a significant portion of revenue.

Opportunities (+$10 to +20/share)

With CHIPS Act funding unlocking domestic capacity and HBM4 set to launch, Micron has multiple ways to extend its lead. If FY26 EPS trends toward $3.00, the market may rerate MU toward a higher earnings multiple.

Threats (–$10 to –15/share)

AI cycles are notoriously hard to predict. Any slowdown in server buildouts, export restrictions to China, or aggressive pricing from Samsung and SK Hynix could compress Micron’s margins and reduce upside.

📊 Micron Q3 FY2025 SWOT Summary

SWOT summary table for Micron Q3 FY2025 showing four categories: Strengths include HBM leadership and margin recovery with an estimated impact of +15 to +25 USD/share; Weaknesses include NAND underperformance and high CapEx with an impact of –5 to –10 USD/share; Opportunities highlight the HBM4 ramp and CHIPS Act subsidy with +10 to +20 USD/share impact; Threats note China risk and competitive pricing pressure with –10 to –15 USD/share impact.

Valuation Scenarios: Calculating What It’s Worth

Based on Micron’s own forward guidance, historical multiples, and a fair risk-adjusted outlook, here’s how we frame the valuation:

Valuation scenarios table for Micron Q3 FY2025. The bullish case assumes $3.00 EPS and 20× P/E for a $160 target, with 30% probability and $48 weighted value. The base case uses $2.50 EPS and 18× P/E for a $135 target, with 50% probability and $67.50 weighted value. The bearish case assumes $2.00 EPS and 15× P/E for a $100 target, with 20% probability and $20 weighted value. The probability-weighted fair value estimate is $135.50 per share.

🎯 Fair Value Estimate:

$48.00 + $67.50 + $20.00 = → $135.50/share
📉 Current Price (as of June 26): ~$127.25
📈 Implied Upside: ~6.5%

Bar chart showing Micron’s Q3 FY2025 valuation scenarios. Bear case target is $100 (red), base case is $135 (gray), bull case is $160 (green), and current stock price is $127 (black). A dotted blue line marks the calculated fair value at $136. The chart illustrates relative upside potential under different earnings scenarios.

Peer Context: How Does Micron Stack Up?

Micron’s 39% gross margin now rivals Samsung’s memory division but still trails SK Hynix’s HBM-focused business, which has hit margins north of 45%. However, Micron’s consistent EPS acceleration — paired with a cleaner balance sheet and U.S. production capacity — could justify a premium multiple in future quarters.

Bar chart comparing gross margins of major memory players for Q3 FY2025. Micron has a 39% gross margin, SK Hynix leads with 45%, and Samsung’s memory division reports 40%. The chart highlights Micron’s competitive positioning, slightly behind its Korean peers in profitability.

What to Watch Next Quarter

  1. HBM4 Ramp-Up: Will Micron maintain pricing power as next-gen chips hit production?
  2. CapEx Discipline: Is investment tapering enough to keep FCF positive?
  3. AI Demand Stickiness: Does server spending hold up into year-end?

Verdict: Hold to Accumulate

Micron is no longer just a cyclical memory stock — it’s emerging as a core infrastructure provider for the AI era. At today’s price around $127, the stock offers a balanced risk-reward profile with clear near-term momentum and longer-term optionality. For tech-savvy growth investors, this is a name to hold and continue accumulating on dips — not chase blindly, but don’t look away either.


Call to Action

If you’re tracking AI infrastructure plays and want insights backed only by the official data — not clickbait — follow SWOTstock or subscribe for the next update.


Disclaimer

This post is for informational purposes only. All analysis is based solely on Micron’s official Q3 FY2025 financial report and earnings call transcript. No third-party data or analyst commentary was used.


Leave a comment