
TL;DR
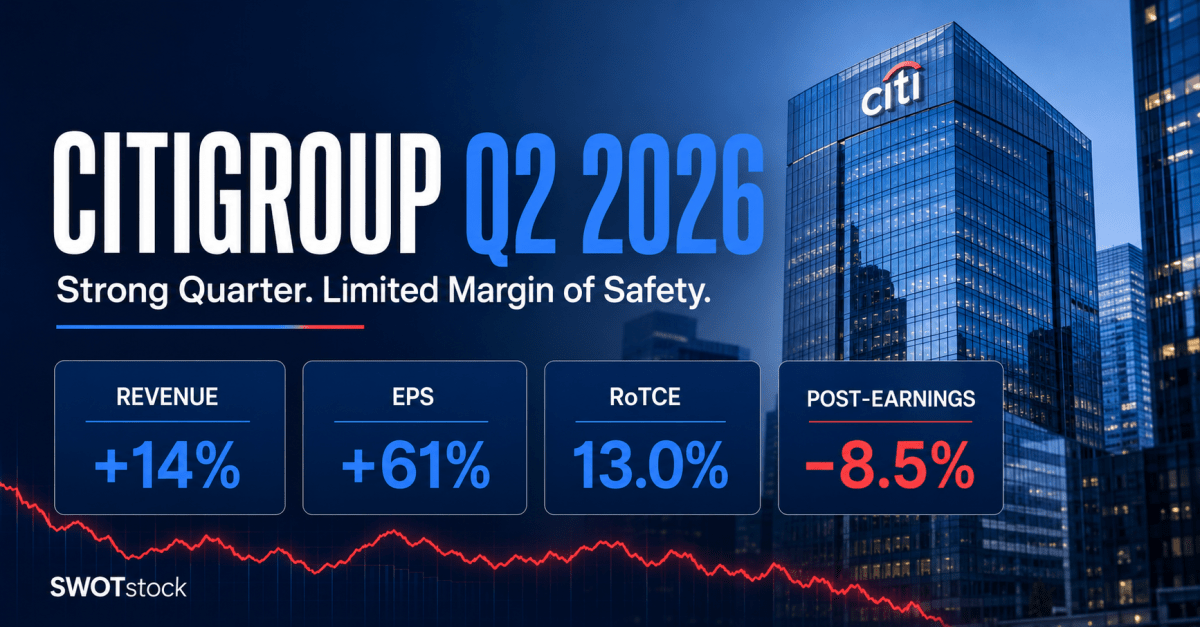
Citigroup (C:NYSE) delivered an impressive second quarter. Revenue rose 14%, net income increased 45%, and return on tangible common equity reached 13%. Services remained the standout franchise, while Markets, Banking and Wealth all reported strong growth. Positive operating leverage also showed that Citi’s restructuring is beginning to translate into better profitability.
Yet the shares fell 5.3% on earnings day and declined to $128.72 by July 20—8.5% below the pre-earnings close. The likely concern is not whether Q2 was strong, but whether its profitability can be sustained once Markets revenue normalizes and restructuring costs continue.
Our scenario analysis produces a range of $94 to $155, with a probability-weighted fair value of approximately $123. At $128.72, Citi already appears priced for a normalized RoTCE of roughly 12.6%, leaving limited margin of safety for a value investor.
Quarter Recap
Citigroup reported Q2 2026 revenue of $24.77 billion, up 14% from a year earlier. Net income increased 45% to $5.83 billion, while diluted EPS rose 61% to $3.15.
The improvement was not limited to revenue growth. Operating expenses increased by a more moderate 5%, creating more than nine percentage points of positive operating leverage. Citi’s efficiency ratio improved from 62.7% to 57.4%, and pre-tax income rose 54%.
Most importantly, return on tangible common equity reached 13%, compared with 8.7% one year earlier. This provided tangible evidence that Citi’s collection of businesses can generate attractive returns when revenue growth, operating leverage and credit conditions align.
The balance sheet remained well capitalized. Tangible book value per share increased 7% to $100.89, while the CET1 ratio reached 12.8%. Citi returned approximately $5 billion to shareholders during the quarter, including $4 billion of share repurchases, and plans to increase its quarterly dividend by 12% beginning in Q3, subject to board approval.
The figures are drawn from Citi’s official Q2 earnings release, earnings presentation
, financial supplement
, and earnings-call transcript
.
Market Reaction
Citi closed at $140.71 on July 13, immediately before the earnings release. The shares opened lower at $137.74 on July 14, briefly rallied as high as $144.29, and then reversed sharply to close at $133.27—a decline of 5.3%.
The intraday reversal was more revealing than the initial opening decline. Buyers first pushed the stock above its pre-earnings close, but the rally failed completely. Citi finished near the lower end of its unusually wide trading range on approximately 32 million shares of volume.
The weakness also continued after earnings day. Following a modest rebound on July 15, Citi declined during each of the next three sessions and closed at $128.72 on July 20. That placed the shares 8.5% below their pre-earnings level.
This pattern suggests that investors distinguished between a very strong quarter and a sustainable improvement in normalized profitability. Citi demonstrated that it can generate a 13% quarterly RoTCE, but management retained a more conservative 10%–11% target for 2026 and cautioned that second-half Markets revenue could decline more sharply than its normal seasonal pattern.
Key Highlights
Services remains Citi’s strongest franchise
Services revenue increased 18% to $6.38 billion, while net income rose 51% to $2.58 billion. The segment generated a 30.9% RoTCE, supported by 19% growth in average deposits, 13% growth in cross-border transaction value and 22% growth in assets under custody or administration.
These results matter because Services is more recurring and less dependent on market conditions than trading or investment banking. It provides Citi with a high-return core around which the broader transformation can be built.
Markets and Banking produced exceptional results
Markets revenue rose 17% to $7.01 billion, including 45% growth in Equity Markets. Banking revenue increased 34%, supported by a 44% rise in Investment Banking revenue.
These businesses contributed materially to Citi’s 13% quarterly RoTCE. They also introduce a question about durability. Management noted that Markets revenue has historically declined approximately 20% between the first and second halves and indicated that the 2026 decline could be larger following the exceptionally strong first half.
Operating leverage is finally visible
Revenue growth of 14% substantially exceeded expense growth of 5%. Citi’s efficiency ratio fell to 57.4%, demonstrating the earnings potential available when revenue expands faster than the cost base.
However, management still expects a full-year efficiency ratio of approximately 60%. Severance expense exceeded $800 million during the first half, and total expenses remained higher than a year ago. The transformation is producing results, but it is not yet complete.
Capital returns are accelerating
Citi has begun its previously announced $30 billion common-share repurchase commitment. At the July 20 market value, that amount represents roughly 13% of Citi’s equity capitalization, although the eventual reduction in diluted shares will depend on execution prices and employee share issuance.
Repurchases can increase per-share earnings, but Citi is now trading above tangible book value. This means the investment case can no longer rely simply on buying back deeply discounted shares; Citi must also earn sufficiently attractive returns on its tangible equity.
SWOT Analysis
Strengths
- Services provides a high-return foundation: Its 30.9% RoTCE, strong deposit growth and expanding transaction volumes could support a higher consolidated return and valuation multiple. Potential price impact: +6% to +11% [SENS]
- Positive operating leverage is emerging: Sustaining an efficiency ratio around 59%–60%, rather than reverting toward 62%–63%, could add approximately $0.90–$1.30 to normalized EPS. Potential price impact: +7% to +12% [SENS]
- Capital and tangible-book growth provide support: Tangible book value rose 7%, the CET1 ratio reached 12.8%, and capital returns accelerated. Potential price impact: +4% to +8% [HEUR]
Weaknesses
- Q2 profitability exceeded management’s normalized outlook: The gap between the 13% quarterly RoTCE and the 10%–11% full-year target indicates that Q2 should not automatically be treated as the new earnings baseline. Potential price impact: −12% to −20% [SENS]
- The expense transformation remains unfinished: Expenses still increased 5%, while the full-year efficiency target is weaker than the Q2 result. A two-percentage-point efficiency shortfall could reduce annual after-tax income by approximately $1.5 billion. Potential price impact: −6% to −9% [SENS]
- All Other continues to dilute the core franchises: All Other recorded a $923 million quarterly net loss, preventing the strong segment-level returns from translating fully into consolidated profitability. Potential price impact: −5% to −9% [SENS]
Opportunities
- A sustained RoTCE above 12% could unlock a further rerating: Citi’s core segments all produced double-digit returns during Q2. Establishing that these returns are durable would improve both earnings and the valuation multiple investors are willing to pay. Potential price impact: +12% to +20% [SENS]
- Lower stranded costs offer self-help upside: Reducing even half of the Q2 All Other loss rate could recover approximately $1.5–$1.9 billion of annual after-tax earnings. Potential price impact: +6% to +10% [SENS]
- Repurchases could compound per-share earnings: The $30 billion commitment offers meaningful EPS support if Citi maintains strong returns and executes the program without weakening its capital position. Potential price impact: +5% to +9% [SENS]
Threats
- Markets revenue could normalize sharply: A greater-than-usual second-half decline would reduce earnings and reinforce the perception that Q2 profitability was unusually cyclical. Potential price impact: −4% to −8% [SENS]
- Consumer credit could deteriorate: The U.S. Consumer Cards net-credit-loss rate was already 4.19%. A move beyond management’s 4.0%–4.5% range would weaken earnings and increase the margin of safety investors require. Potential price impact: −2% to −6% [SENS]
- Higher capital requirements could slow buybacks: Regulatory changes or continued balance-sheet growth could consume part of Citi’s excess capital and delay the anticipated share-count reduction. Potential price impact: −4% to −8% [HEUR]
These ranges represent individual sensitivities. They overlap and should not be added together.
Valuation Scenarios
For Citi, tangible book value is a more useful valuation anchor than a conventional P/E ratio. The key question is how much sustainable return the company can generate from its tangible common equity.
The analysis starts with tangible book value of $100.89 per share and uses a 10.5% cost of equity and 3% sustainable growth assumption.
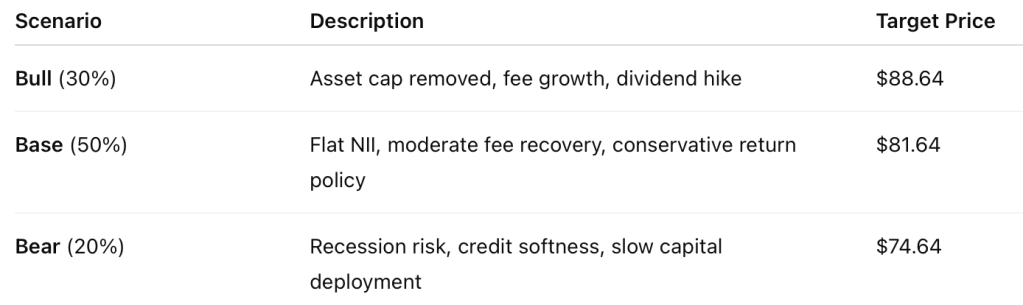
Bear Case: $94
In the bear case, normalized RoTCE settles near 10%, broadly consistent with the lower end of Citi’s 2026 target.
Markets revenue declines sharply during the second half, the efficiency ratio remains near 60%, and All Other continues absorbing a meaningful portion of core-franchise earnings. Credit remains manageable, but the buyback program creates limited intrinsic-value accretion because the shares trade above tangible book.
This produces a justified valuation of approximately 0.93 times tangible book value and a target price of $94, representing downside of about 27% from $128.72.
Assigned probability: 30%
Base Case: $128
The base case assumes normalized RoTCE reaches approximately 12.5%.
Services maintains strong underlying growth, while Wealth and Banking continue improving. Markets revenue normalizes, but recurring franchise growth partly offsets the decline. Transformation savings gradually reduce All Other losses, and credit remains controlled.
Under these assumptions, Citi warrants approximately 1.27 times tangible book value, producing a target price of $128. This is essentially in line with the July 20 market price.
Assigned probability: 50%
Bull Case: $155
The bull case assumes Citi reaches the midpoint of its 14%–15% medium-term RoTCE target.
The efficiency ratio falls below 55%, Services retains its high-return profile, and investments in Wealth, Banking and U.S. Consumer Cards translate into stronger earnings. All Other losses decline materially, while capital productivity improves without a significant deterioration in credit.
This supports a valuation of approximately 1.53 times tangible book value and a target price of $155, representing upside of about 20%.
Assigned probability: 20%
Probability-Weighted Fair Value
Applying these probabilities produces a fair value of approximately:
(\$94 \times 30\%)+(\$128 \times 50\%)+(\$155 \times 20\%) =\mathbf{\$123}
At $128.72, Citi trades approximately 5% above this probability-weighted fair value.
The current price also implies a sustainable RoTCE of roughly 12.6%. Investors are therefore already paying for Citi to outperform its 10%–11% 2026 target and make substantial progress toward its medium-term ambition.
Verdict
Citi’s transformation is becoming visible in the financial results. Services is an excellent franchise, operating leverage is improving, capital returns are accelerating, and the company has now demonstrated that it can produce a 13% quarterly RoTCE.
However, the valuation has moved ahead of the evidence needed for a comfortable value-investor entry. At $128.72, the market already assumes that Citi can sustain returns close to its exceptional first-half level. If normalized RoTCE settles near management’s 10%–11% 2026 target, the downside could be considerable.
The asymmetry is not especially attractive: the bear case implies approximately 27% downside, while the bull case offers around 20% upside. That does not make Citi a poor company or an automatic sell. It means the stock currently offers limited margin of safety.
For a Type 2 value investor, Citi is better classified as a hold or watchlist candidate than a clear bargain. A lower share price, further tangible-book growth, or stronger evidence that 12%–13% RoTCE is sustainable would improve the risk-reward balance.
Call to Action
Is Citi’s 13% quarterly RoTCE the beginning of a durable transformation—or was Q2 simply an unusually favorable combination of Markets strength and operating leverage?
Share your view in the comments, and follow SWOTstock for independent earnings analysis built from company filings and official management disclosures.
Disclaimer
This article is for informational and educational purposes only and does not constitute investment, financial, legal or tax advice. The valuation scenarios and price-impact ranges are estimates based on stated assumptions and are not predictions or guarantees of future performance.
Financial markets involve risk, including the possible loss of principal. Investors should conduct their own research and consider their financial circumstances, objectives and risk tolerance before making any investment decision. The author may hold positions in securities discussed.





Leave a Reply