SAP Q2 2025 Earnings: Cloud Momentum, AI Push — Is This Pullback a Buy?

SAP’s Q2 2025 earnings delivered 24% cloud growth, margin expansion, and a strong AI roadmap, yet shares dipped 6%. Is this a buying opportunity for growth investors?

TL;DR

SAP’s Q2 2025 delivered 24% YoY cloud growth83% free cash flow surge, and margin expansion, yet the stock dropped ~6%. For growth‑minded investors, this may be an opportunity to accumulate, as SAP pushes deeper into AI‑driven enterprise solutions and China expansion, though macro and FX risks remain.


Quarter Recap: Why This Matters to Growth Investors

SAP posted Q2 revenues of €9.43B, driven by cloud revenue of €5.13B (+24% YoY) and a backlog increase of 22%Operating margin rose to 27.2% (+1.8pp), while free cash flow surged 83% to €2.36B.

So why did shares drop ~6%? The market zeroed in on slowing backlog growthmacroeconomic uncertainty, and FX drag, which overshadowed the otherwise strong report.

Why you should care: SAP’s fundamentals still point to a cloud‑first, AI‑powered transformation with improving profitability — a combination attractive for growth investors with a mid‑term horizon.


Key Highlights

  • Cloud revenue: €5.13B (+24% YoY)
  • Total backlog: +22% YoY
  • Operating margin27.2% (+1.8pp YoY)
  • Free cash flow€2.36B (+83% YoY)
  • Share buyback: Up to €5B, supporting EPS
Line chart showing SAP’s revenue and net income over the past five quarters, highlighting steady growth through Q2 2025.

AI: More Than a Buzzword — What SAP Is Building

SAP is embedding generative AI into its Business AI platform, integrating tools across ERP, procurement, and HR. It’s also expanding AI‑as‑a‑service offerings, giving customers access to pre‑built, domain‑specific AI models.

CEO Christian Klein emphasized that AI is “not just an add‑on but core to SAP’s next‑generation enterprise software.” This positions SAP to capture higher‑margin, stickier revenue as clients adopt AI‑enhanced workflows.


Peer Comparison: How Does SAP Stack Up?

Bar chart comparing SAP, Oracle, and Microsoft in Q2 2025 for cloud growth percentage, operating margin percentage, and P/E ratio.
  • SAP: Cloud +24%, margin 27.2%, P/E ~24x
  • Oracle: Cloud +20%, margin ~41%, P/E ~30x
  • Microsoft (Intelligent Cloud): +21%, margin ~42%, P/E ~35x

SAP trades at a relative discount while maintaining competitive growth — a point for long‑term investors to watch.


SWOT Analysis: Price Impact on the Table

SAP’s Q2 shows resilience in cloudgrowing AI initiatives, and geographic diversification, offset by backlog sensitivity and macro risk.

Horizontal bar chart showing SAP Q2 2025 SWOT price impact: strengths and opportunities with positive effects, weaknesses and threats with negative effects.
SWOT analysis table for SAP Q2 2025 showing strengths, weaknesses, opportunities, and threats with estimated price impact ranges.

Valuation Scenarios: Where Could the Stock Go?

Bar chart showing SAP Q2 2025 valuation scenarios: Bear case €165, Base case €200, Bull case €230, Current Price €185, with a dotted line marking the fair value at €199.
Valuation scenarios table for SAP Q2 2025 showing bull, base, and bear cases with assumptions, target prices, and probabilities.

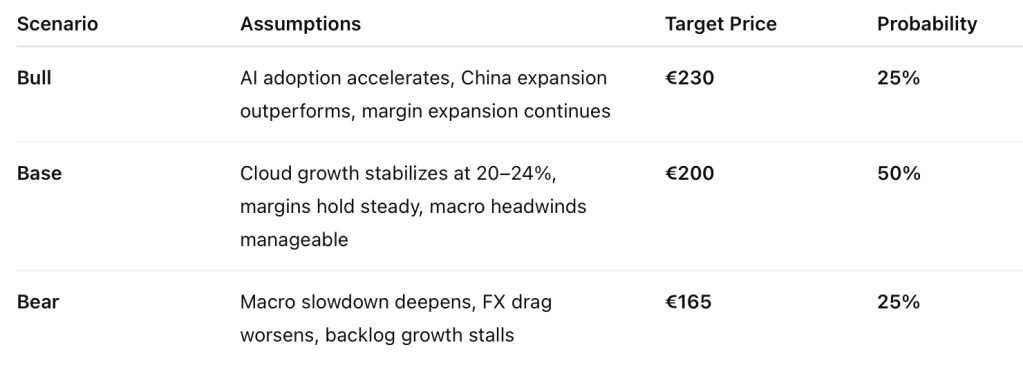
Probability‑Weighted Fair Value:
(0.50 × 200) + (0.25 × 230) + (0.25 × 165) = €198.75 (~€199).


Verdict: An Attractive Mid‑Term Entry for Growth Investors

SAP is cheaper than its peers, with comparable growth and a clear AI‑driven roadmap. The post‑earnings dip brings it within our fair value range (€195–205), offering a tactical entry for investors who believe in its AI and China growth story.


Call to Action: Should You Buy?

Before adding SAP, ask yourself:

  • Do you believe AI integration will drive higher‑margin growth?
  • Are you comfortable with China exposure amid global trade uncertainty?
  • Does SAP’s valuation vs. Oracle/Microsoft justify a position in your portfolio?

Join the conversation: What’s your take on SAP’s AI pivot? Share your thoughts in the comments and explore more at SWOTstock.com.


Disclaimer

This article is for informational purposes only and does not constitute investment advice. All analysis is based solely on SAP’s official Q2 2025 financial statements, earnings call transcript, and management commentary.


Leave a comment


🧠 Adobe Q2 FY2025: AI Gains Momentum, But Wall Street Lags Behind

Adobe reported strong Q2 FY2025 results with $5.87 billion in revenue and raised its full-year guidance, driven by accelerating AI adoption. Despite this, the stock fell slightly, possibly due to unmet investor expectations for detailed AI revenue. Analysts see potential upside, making it an attractive long-term investment opportunity.

🚨 TL;DR — The Market Isn’t Rewarding This Beat (Yet)

Adobe (NASDAQ: ADBE) delivered double-digit growth, accelerating AI adoption, and raised full-year guidance. Yet the market response was muted. With fundamentals clearly improving and AI monetization tracking ahead of schedule, this gap presents an opportunity for long-term investors.


📆 A Strong Quarter Powered by AI and Recurring Revenue

Adobe posted another record quarter with $5.87 billion in revenue (up 11% YoY) and $5.06 in non-GAAP EPS (up 13%). Management raised full-year revenue and EPS guidance, reflecting confidence in the AI product suite and its impact on customer value.

Line chart showing Adobe’s revenue and net income trends over the past five quarters, highlighting Q2 FY2025 record performance.

✨ Q2 FY2025 Highlights at a Glance

  • Revenue: $5.87B (+11% YoY)
  • Non-GAAP EPS: $5.06 (+13%)
  • Operating Income: $2.67B (non-GAAP)
  • Digital Media ARR: $18.09B (+12.1%)
  • Business Pros & Consumers: $1.6B revenue (+15%)
  • MAUs: 700M+ across Acrobat & Express (+25%)
  • AI monetization on track to surpass $250M ARR
  • Operating Cash Flow: $2.19B
  • Shares Repurchased: 8.6M
  • FY2025 Guidance Raised: Revenue to $23.5–23.6B; EPS to $20.50–$20.70

🚀 What’s Driving Growth: Firefly, Acrobat AI, GenStudio

CEO Shantanu Narayen confirmed that Firefly, Acrobat AI Assistant, and GenStudio are central to Adobe’s AI push. Adoption of these tools is growing across both creative pros and new user groups, such as business professionals and educators. While Adobe doesn’t break out revenue by product, they reiterated that AI-driven ARR is already contributing “billions” and tracking ahead of plan.


📉 Why the Stock Fell Despite the Beat

Adobe’s stock dipped around 1% in after-hours trading — a familiar pattern for growth names with high expectations. Although Adobe raised guidance and showed real AI traction, investors may have been hoping for more granular AI revenue breakdowns or a clearer timeline for when this monetization becomes a larger part of total ARR.

Additionally, macro uncertainty and the strong YTD performance likely triggered some profit-taking. But CFO Dan Durn also noted that demand rebounded in Q2, a sign that macro pressures may be easing.


🧩 SWOT Analysis: What’s Driving the Price Range?

Adobe’s own financial data and management commentary give us a clear view of its strengths and risks. Among the positives: accelerating AI monetization, strong margins, a growing base of non-creative users, and consistent free cash flow. These fundamentals could justify a price range of $455 to $475 — representing 10–15% upside.

On the flip side, investors may be disappointed by the lack of specific AI revenue detail. Combined with cautious buyback disclosures, these introduce a near-term downside risk of 3–5%. Macroeconomic pressure or poor execution on AI could also push the stock toward the $385–$390 level.

Horizontal bar chart visualizing Adobe’s SWOT analysis with estimated stock price impact ranges for Strengths, Weaknesses, Opportunities, and Threats.

📊 SWOT Summary Table

Table summarizing Adobe’s Q2 FY2025 SWOT analysis with estimated stock price impact ranges for strengths, weaknesses, opportunities, and threats.

🔮 What’s Adobe Worth? Valuing the Stock Based on Official Guidance

Using Adobe’s internal EPS guidance and valuation history, we mapped out three scenarios:

  • Bull Case: AI monetization exceeds expectations and Adobe reclaims a premium P/E multiple (30×).
    → $20.70 EPS × 30 = $621
  • Base Case: Adobe delivers its guidance and trades at 24×, slightly below its historical average.
    → $20.60 × 24 = $494
  • Bear Case: AI monetization stalls and valuation contracts to 19×.
    → $20.50 × 19 = $389
Bar chart comparing Adobe’s bear, base, and bull case valuation targets with a dashed line indicating the current share price and a dotted line for fair value.

Weighting these scenarios (20% bull, 60% base, 20% bear), our fair value estimate is $498.40 — roughly 20% above the current price of $413.


🏁 Our Take: Mispricing Creates Opportunity

Adobe’s raised guidance, strong recurring revenue growth, and accelerating AI adoption all point to a business gaining momentum. Even more compelling: our fair value estimate of $498 closely mirrors the average analyst target of ~$497, reinforcing the case for upside.

Management noted that demand improved sequentially in Q2, a sign that macro headwinds may be easing. While competition in generative AI is heating up across creative tools, Adobe is positioning itself well by embedding AI across its full product suite.

For long-term investors with a focus on high-quality, cash-generative, AI-leveraged software businesses, the post-earnings dip appears to be a gift.


💬 Like This Analysis? Get More on SWOTstock

At SWOTstock, we distill earnings calls, official filings, and executive strategy into investor-ready breakdowns — backed by data and free from noise. Please subscribe to stay on top.


⚠️ Disclaimer

This post is based entirely on Adobe’s official financial statements and earnings call from Q2 FY2025. It is not financial advice.


Leave a comment


Autodesk Q1 2026 Earnings: AI Tools Drive Growth—but Is the Upside Already Priced In?

Autodesk (ADSK) beats Q1 FY2026 estimates and raises guidance, but is the stock already priced for perfection? Dive into our AI-focused SWOT analysis, valuation breakdown, and investor verdict.

TL;DR – Solid Beat, Upgraded Guidance, But Market Unmoved

Autodesk (NASDAQ: ADSK) beat expectations in Q1 with 15% revenue growth, expanding margins, and strong free cash flow. Management raised full-year guidance and highlighted its AI platform roadmap. Still, the stock stayed flat—suggesting the optimism may be fully priced in.


Financial Overview – Growth That Converts to Cash

Autodesk reported:

  • Revenue: $1.63B (+15% YoY)
  • EPS (Non-GAAP): $2.29
  • Operating Margin: 37% (+300bps YoY)
  • Free Cash Flow: $556M (+14%)
  • Billings: $1.43B (+29%)
  • FY2026 guidance raised for revenue and EPS

What sets Autodesk apart isn’t just strong revenue—it’s the ability to consistently convert earnings into cash flow.

Line chart showing Autodesk’s free cash flow and net income over the last five quarters, highlighting consistent growth through Q1 2026.

Where the Growth Is Coming From

Revenue isn’t growing evenly across all business lines. Autodesk’s AEC (architecture, engineering, and construction) segment remains dominant, but Manufacturing and “Others” are catching up.

Bar chart comparing Autodesk’s revenue by segment—AEC, Manufacturing, and Others—between Q1 2025 and Q1 2026.

Also critical is the mix of recurring revenue. Subscription ARR is expanding steadily, which supports long-term valuation multiples.

Line chart showing Autodesk’s total revenue versus quarterly subscription ARR from Q1 2025 to Q1 2026, reflecting recurring revenue growth.

Management’s Outlook – Confidence Backed by Upward Revisions

Autodesk has shown a pattern of raising guidance, reinforcing investor confidence in leadership and execution.

Bar chart illustrating Autodesk’s EPS guidance revisions, showing increases from original to final guidance in FY2025 and FY2026.

SWOT Breakdown – What’s Working, What’s Not, and Where We Go Next

Let’s break it down using SWOT—strengths, weaknesses, opportunities, and threats—with estimated stock price impact for each:

Strengths

  • Revenue and FCF beat expectations
  • AI rollout begins across Revit and Fusion
  • Subscription model fuels predictable growth

Price Impact: +$15 to +$20


Weaknesses

  • Flat stock reaction post-earnings suggests limited short-term upside
  • High R&D spend during platform transition could compress near-term margins

Price Impact: –$5 to –$10


Opportunities

  • Generative design and predictive modeling features gain traction
  • Construction Ops platform and APAC expansion could drive new growth
  • Increased ARR could unlock multiple expansion

Price Impact: +$25 to +$40


Threats

  • Geopolitical and macro headwinds
  • Execution risk with AI and Cloud scale
  • Valuation already rich (~30.7x forward earnings)

Price Impact: –$20 to –$30

SWOT Summary Table

Type Key Points Price Impact
Strengths Revenue & margin beat, AI rollout started +$15 to +$20
Weaknesses Flat stock, platform costs –$5 to –$10
Opportunities Generative design AI, platform growth, APAC expansion +$25 to +$40
Threats Macro risk, AI execution gaps, valuation pressure –$20 to –$30
Horizontal bar chart showing Autodesk’s estimated stock price impact by SWOT element with both endpoints labeled.

Valuation Scenarios – Let’s Do the Math

Despite the strong report, Autodesk’s closing price after earning released ($295.35 as of May 23, 2025) implies a ~30.7x forward P/E. Here’s how that compares to valuation scenarios based on official EPS guidance and fair multiples:

Base Case – Fair Value: $132

  • EPS = $9.62 × P/E 13.7 → $132
  • Reflects steady execution and moderate optimism

Bull Case – Fair Value: $160

  • EPS = $9.73 × P/E 16.5 → $160
  • Assumes strong AI traction and margin expansion

Bear Case – Fair Value: $100

  • EPS = $9.50 × P/E 10.5 → $100
  • Macro pressure + execution delays = multiple compression

Weighted Average Estimate: $132.5

(132×0.6)+(160×0.25)+(100×0.15)=132.5

Bar chart showing Autodesk’s valuation scenarios with weighted average, compared to current stock price.

So Why Is the Market Paying $295?

That’s nearly double our base case. Investors are pricing in:

  • Premium for platform dominance and design ecosystem
  • Long-term AI monetization potential
  • Confidence in 3–5 year growth, not just FY2026

Let’s check historical valuation to see if this premium is new.

Dual-axis chart showing Autodesk’s stock price and trailing P/E ratio over the last five years.

Verdict – Fully Valued. Wait for Dip.

Autodesk’s vision is impressive. The stock is too.
But at current prices, the upside may already be realized—at least in the short term. Long-term investors may want to hold. Opportunists should consider waiting for a pullback below $250 to improve margin of safety.


Call to Action

Want no-hype, investor-friendly breakdowns like this?
Subscribe to SWOTstock to stay ahead of the curve—no fluff, just fundamentals.


Disclaimer

This post is based solely on Autodesk’s official financial report and earnings call transcript. It does not constitute investment advice. Please do your own research.


Leave a comment