Tesla Q3 2025 — When Growth Meets Gravity

Tesla’s Q3 results show record revenue of $25.2 billion and net income of $2.1 billion. While margins are recovering, they remain below 2022 levels. The fair value estimate is $227 per share, with current valuation suggesting a hold recommendation. Investors should consider a buy zone around $180-$190.

TL;DR:

Tesla reported record Q3 revenue of $25.2 B (+7.8 %) and net income of $2.1 B (+11 %), but margin recovery remains shallow.

The fair value sits near $227/share — reasonable for holders, not yet a bargain for new buyers.


📊 Quarter Recap

• Revenue $25.2 B (+7.8 %)

• Gross Profit $5.65 B (+13 %)

• Operating Income $2.17 B (+29 %)

• Free Cash Flow $1.47 B (+61 %)

• Auto Gross Margin 19.6 % (↑ 1.3 pts YoY)

Margins have stabilized after two years of price cuts — but at ~19 %, still far below the 25 % peak of 2022.

Each 1 pt margin shift ≈ $1 B impact to net income.


💬 Management Tone

“We’re entering the autonomy era — vehicle hardware is ready.” – Elon Musk

“Capex will rise into 2026 as we ramp Optimus and Dojo.” – CFO

Translation: positive cash flow continues, but the AI and robotics push keeps capex heavy. Patience required.


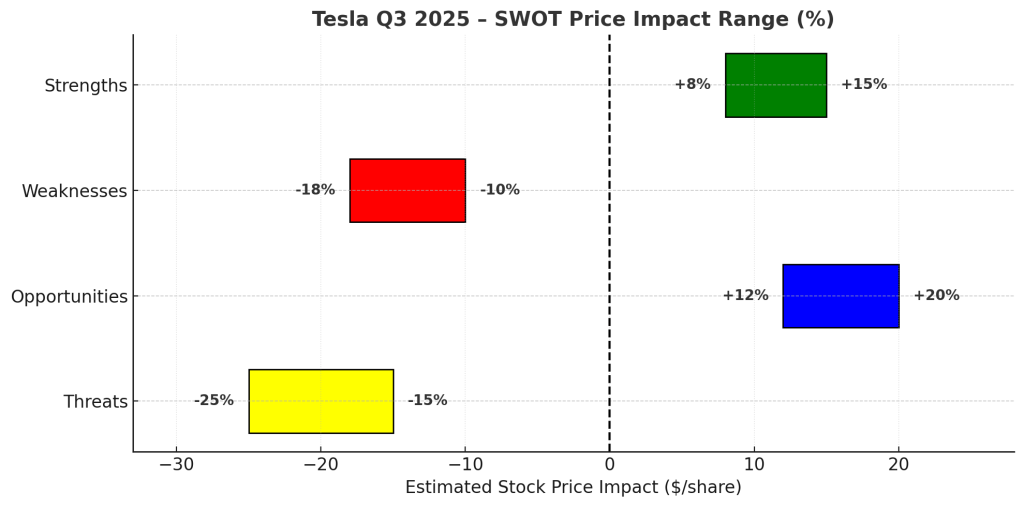
🧩 SWOT Summary (Price Impact Ranges)

Strengths (+8 – 15 %)

– Vertically integrated EV + AI ecosystem

– $25 B net cash cushion

– Sequential margin recovery

Weaknesses (–10 – 18 %)

– Margins well below 2022 levels

– Tariff + mix pressure

– Energy unit still small

Opportunities (+12 – 20 %)

– FSD subscriptions and Dojo compute could add 1–2 pts to margin

– Energy backlog extending beyond 2026

Threats (–15 – 25 %)

– BYD and Hyundai competition

– Capex overshoot risk

– Governance noise around Musk pay

Horizontal bar chart showing Tesla’s Q3 2025 SWOT price impact ranges: Strengths (+8% to +15%, green), Weaknesses (−10% to −18%, red), Opportunities (+12% to +20%, blue), and Threats (−15% to −25%, yellow). Each range is labeled at both ends, with a dashed line at zero representing neutral stock price impact.

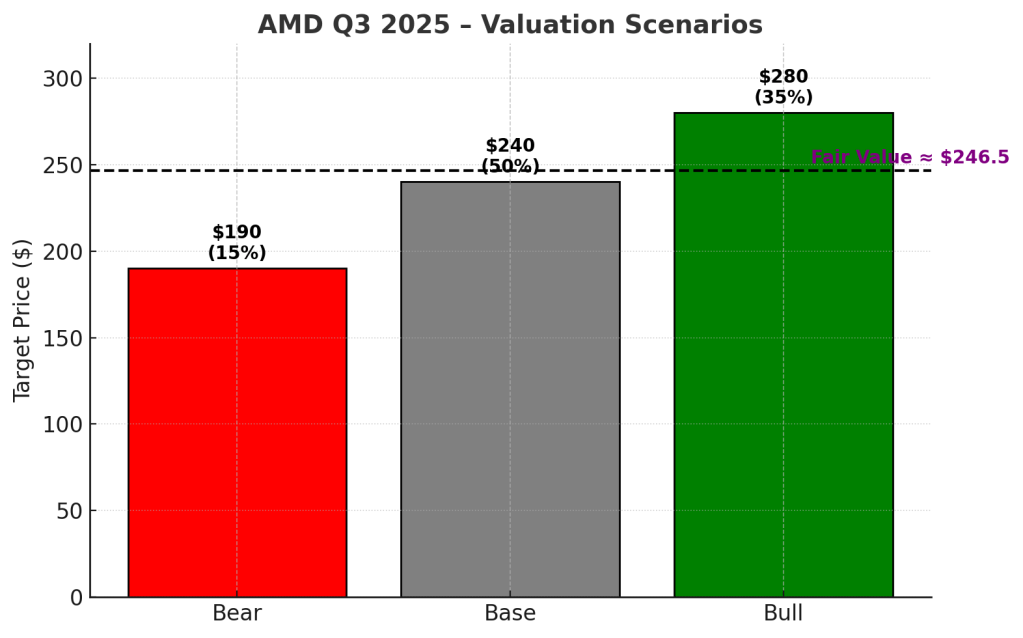
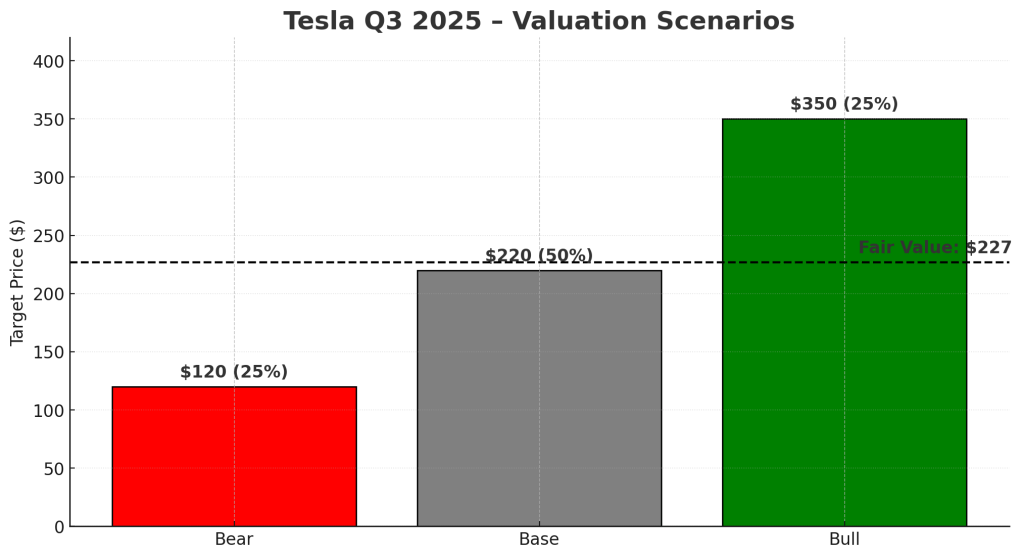
🎯 Valuation Scenarios

(Baseline price $235 pre-earnings)

• Bull ($350) — Autonomy success & 22 % margins → 25 % probability

• Base ($220) — 19 % margins & steady FCF → 50 %

• Bear ($120) — Margin < 17 %, flat cash flow → 25 %

➡ Fair Value ≈ $227/share

Buy Zone $180–190  |  Hold $200–250  |  Trim/Avoid > $260

Bar chart showing Tesla’s Q3 2025 valuation scenarios: Bear case at $120, Base case at $220, and Bull case at $350, each labeled with its probability. A dashed horizontal line marks the fair value estimate at $227. The chart uses red, gray, and green bars against a clean financial-style layout.

🧮 Value-Investor Checklist

✅ Auto margin ≥ 19 % → base case safe

⚠️ Capex > $3 B/qtr → cash pressure

🚗 FSD revenue traction → bull trigger

📉 China ASP trend → bear signal


Verdict — HOLD (Fair Value ≈ $227)

Tesla remains a great company at a reasonable price, not a clear bargain.

Investors seeking 20 %+ margin of safety should target $180–190.

Patience beats momentum — cash and discipline will define returns.


Call to Action

📈 Subscribe to SWOTstock for AI-driven SWOT breakdowns of Tesla and other AI-era leaders — turning official filings into investor-ready insights.


Disclaimer

Based solely on Tesla Inc.’s official Q3 2025 10-Q and management remarks. Not investment advice. Do your own due diligence.


🔋 AMD Q3 2025 — AI Growth Kicks Into High Gear, but Valuation Catches Up

AMD reported record Q3 2025 earnings with a 36% revenue increase to $9.25 billion and a gross margin of 54%. Data Center sales grew 22%, while Client & Gaming surged 73%. Despite strong results, stock dipped due to export-control concerns. Q4 revenue guidance is between $9.3-$9.9 billion.

🧭 TL;DR Summary

Advanced Micro Devices (AMD:NASDAQ) posted record Q3 2025 results: revenue up 36 % y/y to $ 9.25 billion, non-GAAP EPS $ 1.20, and gross margin 54 %.
Data Center sales jumped 22 %, Client & Gaming soared 73 %, while Embedded declined 8 %.
Guidance for Q4 calls for $ 9.3 – 9.9 billion revenue—yet the stock dipped ≈ 4 % after hours as investors digested export-control headwinds and lofty expectations.


🧾 Quarter Recap

AMD’s Q3 marked a clear inflection in its AI and compute franchise.
CEO Lisa Su described the quarter as “a step-up in our growth trajectory as our rapidly scaling data-center AI business drives significant revenue and earnings growth.”
Gross margin improved two points y/y to 52 % (GAAP) and 54 % (non-GAAP), underscoring richer product mix led by EPYC CPUs and Instinct GPUs.
Operating income more than doubled to $ 1.27 billion.

Segment breakdown:

  • Data Center: $ 4.34 b (+ 22 %) — 5th Gen EPYC and Instinct MI350 ramp.
  • Client + Gaming: $ 4.05 b (+ 73 %) — Ryzen and console demand rebound.
  • Embedded: $ 0.86 b (– 8 %) — soft industrial & networking orders.

Management guided Q4 revenue $ 9.3 – 9.9 b (midpoint $ 9.6 b), excluding China-bound MI308 GPU shipments awaiting approval.


🌟 Key Highlights

  1. AI acceleration: Instinct MI350 shipments ramping, with MI308 awaiting export clearance.
  2. Margin expansion: Gross margin 54 % shows strong mix shift to high-end compute.
  3. Balanced growth: Client & Gaming offset softer Embedded demand.
  4. Cautious guidance: China restrictions = headwind, but secular AI TAM tailwinds intact.

🧩 SWOT Analysis (with Price-Impact Ranges)

Strengths (+ 7 – 15 %)
High-margin AI and server products drive sustainable earnings growth. Data Center + Client momentum supports multiple expansion.

Weaknesses (– 6 – 12 %)
Exposure to export controls and volatile PC cycle; Embedded softness limits diversification.

Opportunities (+ 10 – 22 %)
Next-gen MI350 and Zen 5 launches could unlock share gains vs NVIDIA and Intel; AI server TAM expands through 2026.

Threats (– 8 – 18 %)
Regulatory uncertainty (China exports), intense AI competition, macro slowdown risk.

AMD Q3 2025 SWOT price impact chart showing strengths, weaknesses, opportunities, and threats with colored horizontal bars from –45 to +55 dollars, indicating potential stock price impact ranges.

💸 Valuation Scenarios

  • Bull Case (35 % probability)
    • 2026 E EPS ≈ $ 6.50
    • P/E multiple ≈ 40×
    • Target Price: $ 260 – 300 (+ 20 %)
    • Thesis: Strong AI GPU and EPYC share gains, China shipments resume, margin expansion continues.
  • Base Case (50 % probability)
    • 2026 E EPS ≈ $ 5.50
    • P/E multiple ≈ 35×
    • Target Price: $ 230 – 250 (± 0 %)
    • Thesis: Balanced growth across Data Center and Client, modest Embedded recovery, stable margins.
  • Bear Case (15 % probability)
    • 2026 E EPS ≈ $ 4.50
    • P/E multiple ≈ 30×
    • Target Price: $ 180 – 200 (– 20 %)
    • Thesis: AI spending slows, export restrictions persist, competition pressures gross margin.

🎯 Probability-weighted fair value: $ 242 – 255 per share — roughly aligned with current post-earnings price, indicating AMD is fairly valued with moderate upside if AI acceleration outperforms.💸 Valuation Scenarios

AMD Q3 2025 valuation scenarios chart showing Bear, Base, and Bull cases with target prices of $190, $240, and $280, and a dashed line marking fair value around $246.

🧠 Verdict

AMD Q3 2025 shows AI execution is translating into profits. The stock’s valuation now reflects that success.
Short-term pullbacks from export or competitive news could offer better entries, but long-term investors still have a clear AI compounder.

Call: ⚖️ Hold / Accumulate on Weakness
Fair Value: $ 242 – 255 per share


🗣️ Call to Action

If you’re an AI-infrastructure-focused investor, keep AMD on your watchlist for pullbacks below $ 240.
The next earnings cycle will reveal whether the MI350 and Zen 5 ramps translate into market-share inflection.


⚠️ Disclaimer

This analysis is based solely on AMD’s official Q3 2025 financial report and earnings call. It is not investment advice. Please conduct your own due diligence before making investment decisions.


⚙️ CoreWeave (Q3 2025) — From Hyper-Growth to High-Leverage AI Utility

CoreWeave’s Q3 report showcases significant growth with revenue doubling to $1.36 billion and a backlog of $55.6 billion. However, the company’s $8 billion debt and $310 million in quarterly interest illustrate financial strain. Priced at $105, the stock reflects optimistic outcomes, while fair value is estimated at $90 per share.

TL;DR Summary

CoreWeave (CRWE:NASDAQ) third-quarter report confirms explosive growth—but also exposes a balance sheet running hot.
Revenue doubled year-on-year to $1.36 billion, backlog swelled to $55.6 billion, and adjusted EBITDA hit $838 million(61 % margin).
Yet the company is now carrying $8.7 billion in debt and paying $310 million in quarterly interest, revealing that CoreWeave has become a capital-heavy AI-infrastructure utility rather than a lightweight cloud startup.
At $CRWV ≈ $105, the stock already prices in a near-bull scenario; our fair-value model centers near $90 per share.


Quarter Recap

For the quarter ended September 30 2025:

  • Revenue: $1.364 billion (+134 % YoY)
  • Adj. EBITDA: $838 million (61 % margin)
  • Net loss: $110 million (–$0.22 EPS)
  • Interest expense: $310 million
  • CapEx: $1.85 billion
  • Backlog: $55.6 billion (+271 % YoY)

Management reiterated that “demand for CoreWeave’s platform continues to exceed available capacity,” but acknowledged construction delays at a third-party facility that could push revenue into Q1 2026.


Key Highlights

  • 💾 Scale: 590 MW active / 2.9 GW contracted capacity
  • 🤝 Clients: OpenAI, Meta, Anthropic—anchor AI tenants
  • 💰 Financing: ≈ $14 billion secured debt + equity to date
  • 🏗️ CapEx run-rate: ≈ $7 billion annualized
  • 📊 Backlog visibility: multi-year revenue coverage through 2027

Updated SWOT Analysis & Price Impact

🧠 Updated SWOT

Strengths (+10 – 20 %)

  • Massive $55 B backlog, 61 % EBITDA margin, and first-mover advantage in AI-optimized cloud.

Weaknesses (–15 – 25 %)

  • $8 B debt load and $300 M quarterly interest burn.
  • Persistent capex drag limits near-term free cash flow.

Opportunities (+20 – 35 %)

  • Secular AI-compute demand and long-term contracts with OpenAI, Meta, and Anthropic.
  • Potential shift from training spikes to recurring inference workloads.

Threats (–20 – 30 %)

  • Execution risk from data-center delays.
  • Refinancing or rate exposure.
  • Hyperscaler competition as NVIDIA supply normalizes.

Overall, CoreWeave remains the purest listed proxy for AI-compute demand, but its financial structure now demands operational precision rather than just growth.


Horizontal bar chart titled CoreWeave Q3 2025 – SWOT Price Impact Range (%) showing four color-coded categories: Strengths (+10% to +20%, green), Weaknesses (–25% to –15%, red), Opportunities (+20% to +35%, blue), and Threats (–30% to –20%, yellow). A dashed vertical line at zero marks neutral price impact.

⚖️ The investment picture

At around $105 per share, $CRWV trades near 11 times enterprise value to sales — a premium multiple that assumes smooth execution and sustained GPU scarcity.
Based on confirmed data and realistic assumptions:

  • In a bull case, where demand stays hot and margins expand, the stock could approach $135 a share.
  • In a base case, assuming balanced growth and slower capex, fair value sits around $90 a share.
  • In a bear case, where delays and refinancing pressure bite, the price could compress toward $50 a share.

Our probability-weighted fair value lands near $90 per share, suggesting the stock is already priced for near-best-case outcomes.

Vertical bar chart titled CoreWeave Q3 2025 – Valuation Scenarios comparing three cases: Bear ($48), Base ($88), and Bull ($138). Bars are colored red, gray, and green respectively, with a dashed horizontal line marking the probability-weighted fair value near $90 per share.”

Verdict

CoreWeave has evolved from a nimble startup into a capital-intensive AI utility—and markets are treating it as such.
The company’s operating performance is stellar, but $8 B of debt and $300 M per-quarter interest make flawless execution non-negotiable.
At $105, CRWV is already priced for near-bull outcomes; our base-case fair value around $90 suggests a balanced risk/reward rather than deep undervaluation.
Upside to $130 requires both smooth facility ramp-up and sustained AI compute scarcity through 2026.


Call to Action

Growth-oriented investors should monitor:

  1. Q4 delivery timelines for the delayed data centers.
  2. Refinancing terms & interest coverage as rates stay high.
  3. Utilization rates > 90 % as the key profitability signal.

For indirect exposure, consider NVIDIAVertiv, or Super Micro Computer as liquid public proxies for the AI-infrastructure theme.


Disclaimer

This analysis uses only CoreWeave’s official Q3 2025 financial release, filings, and management commentary.
It is not investment advice and is for educational purposes only.
All price targets and valuations are illustrative and subject to change as new data emerges.