TL;DR (SEO-optimized)
BioNTech’s Q3 2025 proved the pivot is real: revenue rebounded to €1.52B (+22% YoY) on partnership inflows (not vaccines), guidance was raised to €2.6–2.8B, and cash remains massive at €16.7B. Profit is still negative as R&D ramps into oncology. Our 12-month weighted fair value ≈ $100/share (vs. ~$104), with upside tied to 2026 oncology readouts — notably Pumitamig (BNT327) — and the company’s AI-assisted immunotherapy engine.
Quarter Recap (human-readable narrative)
BioNTech reported €1.52B in Q3 revenue, up sharply year over year as the Bristol Myers Squibb oncology collaboration recognized upfront and milestone payments. Core COVID vaccine sales continued to fade, while R&D rose to €565M and SG&A held near €148M, reflecting tighter operating discipline during the pivot. Despite the stronger top line, BioNTech posted a net loss of €28.7M (€–0.12 per share). Management raised FY25 revenue guidance to €2.6–2.8B and emphasized that a €16.7B cash/securities balance provides a multi-year runway to prosecute late-stage oncology programs.
Key Highlights (what matters this quarter)
- Guidance raised: FY25 revenue now €2.6–2.8B (was €1.7–2.2B).
- Cash strength: €16.7B war chest supports multi-year, late-stage pipeline without dilution.
- Oncology pivot: Lead program Pumitamig (BNT327) advancing toward 2026 readouts; mRNA cancer vaccines continue with partners.
- AI inside: Internal models for neoantigen prediction and mRNA construct design shorten design-to-trial cycles.
- Profitability deferred: Negative EPS persists as spending concentrates on oncology milestones.
SWOT Analysis (with short intro + bullet points)
Intro: BioNTech is transitioning from pandemic windfall to a pipeline-driven oncology model. The following SWOT reflects only what management disclosed in the Q3 2025 report/call and our interpretation of how each area could move the stock.
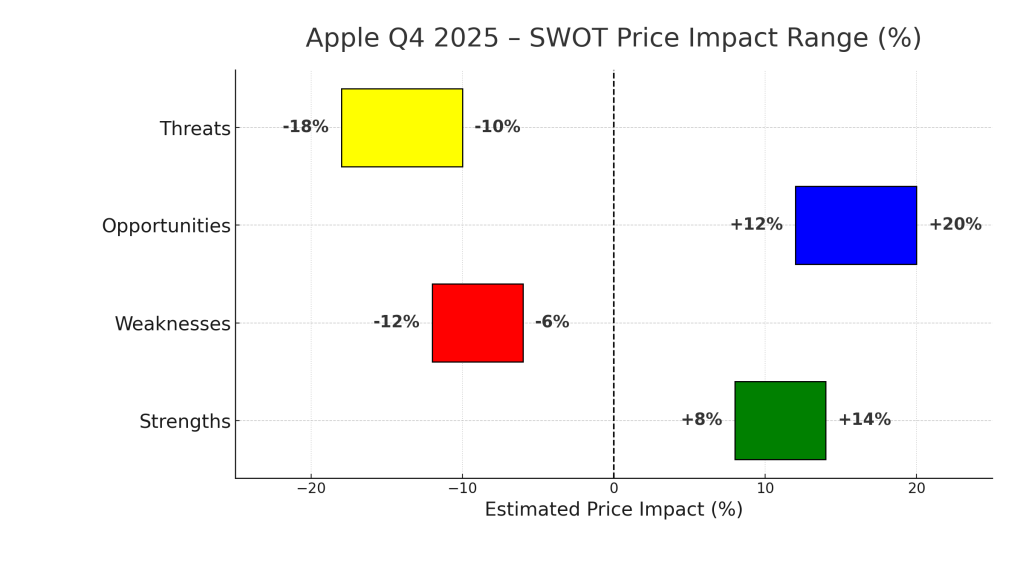
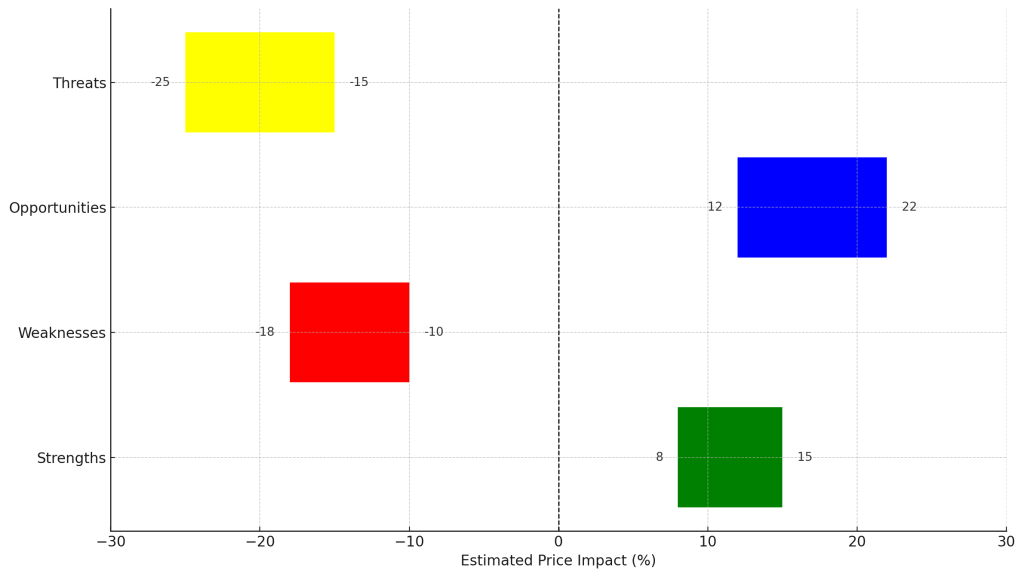
Strengths — estimated stock impact: +8% to +15%
- €16.7B cash & securities provide exceptional runway and deal flexibility.
- Blue-chip partners (BMS, Pfizer, Genentech) validate platforms and add non-dilutive funding.
- FY25 guidance raised; operating discipline improving despite elevated R&D.
Weaknesses — estimated stock impact: –10% to –18%
- Still loss-making; near-term earnings visibility limited.
- Revenue mix skewed to one-off collaboration payments vs. recurring product sales.
- COVID vaccine decline continues to weigh on recurring revenue base.
Opportunities — estimated stock impact: +12% to +22%
- 2026 catalysts: Pumitamig Phase 2/3 and mRNA cancer-vaccine readouts could reset valuation.
- AI-assisted design may accelerate cycle times and increase program hit-rate.
- Expansion of BMS collaboration and additional combo trials across solid tumors.
Threats — estimated stock impact: –15% to –25%
- Regulatory slippage or mixed efficacy signals could push timelines to 2027–2028+.
- Intense competition (e.g., Moderna mRNA oncology; antibody leaders) and pricing scrutiny.
- Biotech risk sentiment — multiple compression if sector flows weaken.
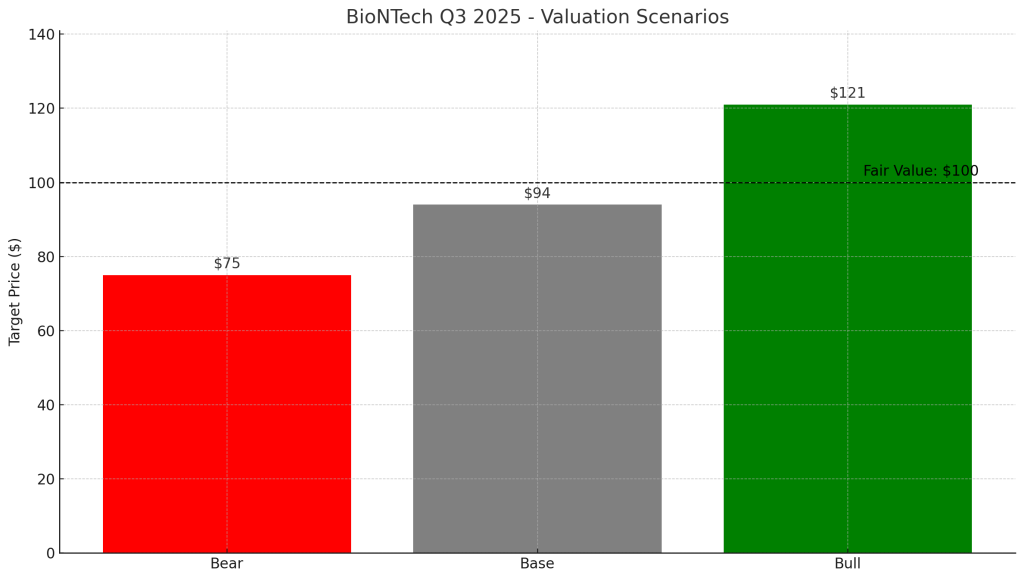
Valuation Scenarios (short intro + bullet points)
Intro: We anchor valuation to FY25 guidance and management’s pipeline cadence. We apply standard biotech framing: earnings multiple when profitable; sales multiple when loss-making. All inputs reflect the Q3 2025 disclosures.
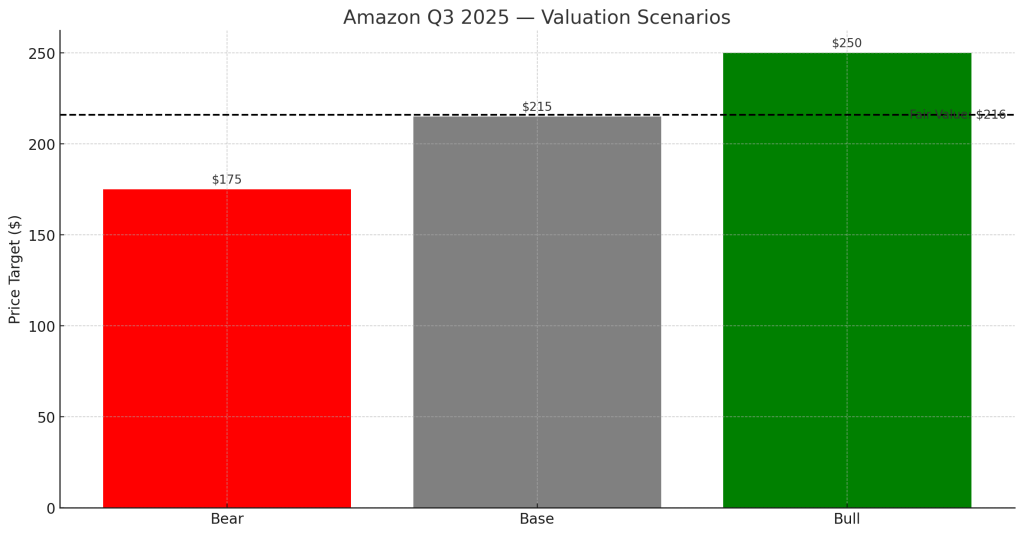
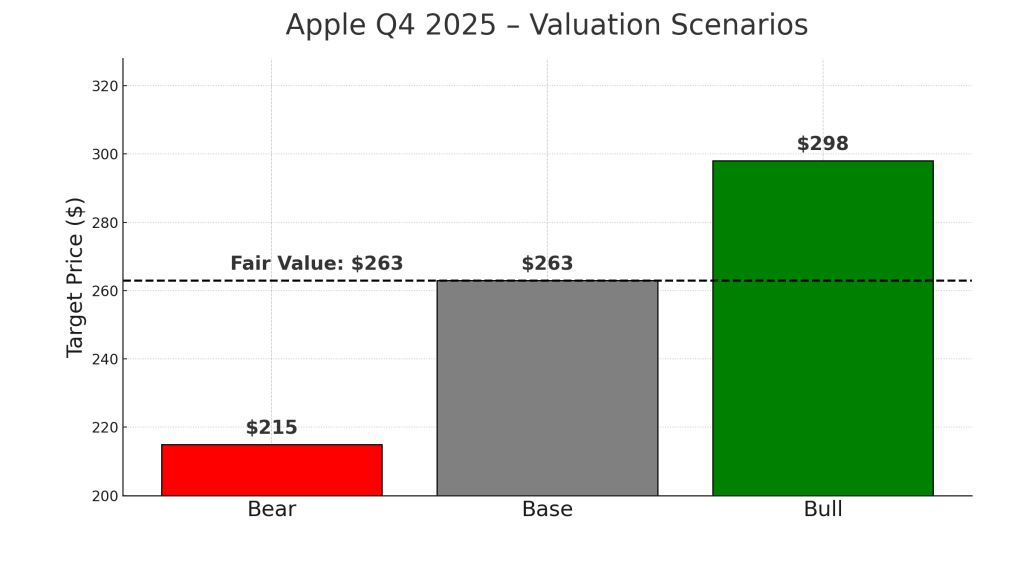
Bull Case — ~$121 (+≈16% vs. $104)
- Assumptions: first oncology readouts positive; FY26 EPS ≈ $3.45; apply 35× P/E (pipeline re-rate).
- Math: $3.45 × 35 ≈ $121.
Base Case — ~$94 (near-fair)
- Assumptions: executes to raised FY25 guide; FY26 EPS ≈ $1.94; apply 25× P/E (mid-cap biotech).
- Math: $1.94 × 25 ≈ $94.
Bear Case — ~$75 (–≈28%)
- Assumptions: oncology timelines slip; losses persist; value on P/S = 3× FY25 sales (~€2.3B) on ~235M diluted shares.
- Math: ≈ $75.
Weighted Fair Value ≈ $100/share
- 35% Bull, 45% Base, 20% Bear → ~$100. With shares near ~$104, risk/reward is neutral until we get 2026 data.
Verdict
BioNTech is no longer a COVID stock — it’s a clinical-trial story with an AI-assisted engine behind it. The balance sheet and partnerships provide stability; outcomes in 2026 will determine whether the multiple expands toward leaders or compresses with delays. For tech-savvy growth investors, this screens as a speculative hold near fair value, with asymmetric upside if even one late-stage asset delivers.
Call to Action
- Track Pumitamig (BNT327) Phase 2/3 updates in 1H 2026.
- Watch for AI-pipeline disclosures (design cycles, neoantigen modeling) and any BMS scope expansion.
- Re-underwrite position sizing on dips toward the $90–95 support zone if sector beta weighs on biotech.
Disclaimer
This post is based only on BioNTech’s official Q3 2025 financial report and earnings call. It is not investment advice. Biotech equities are volatile and may result in loss of principal. Conduct your own research before investing.