

TL;DR – AI Momentum Is Building, But Valuation Is a Hurdle
Snowflake (NYSE: SNOW) delivered another solid quarter, with strong growth in product revenue and promising early traction in AI-native services like Cortex. While the company continues to execute on its transition from data warehouse to AI platform, GAAP profitability remains elusive. The stock is trading above $200, which reflects confidence in long-term AI monetization—but may leave little room for near-term execution missteps.
Quarter Recap – Solid Fundamentals, Strong Vision, and Rising Expectations
Snowflake entered fiscal 2026 with impressive momentum. Product revenue grew 26% year-over-year to $996.8 million, supported by rising demand from enterprise clients and sustained usage from technology-forward organizations. Total remaining performance obligations (RPO) reached $6.7 billion, a 34% increase, signaling deep customer commitment over the coming quarters.
Yet what made this quarter stand out wasn’t just the numbers—it was the strategic tone. CEO Sridhar Ramaswamy framed the company’s evolution clearly: Snowflake is aiming to become the infrastructure backbone of enterprise AI. The recent launch of Cortex allows users to run LLMs and vector search on their own data, within Snowflake’s platform. This integration is expected to expand use cases and deepen wallet share with customers.
CFO Mike Scarpelli acknowledged that macro pressures still influence some customer segments, but also noted increasing contributions from AI-native businesses. These companies are growing their consumption faster and could become a larger revenue driver over time.
In short, this was a quarter where the fundamentals held steady—but the vision pushed forward even more aggressively.
Key Highlights

- Product Revenue: $996.8M (+26% YoY)
- Total Revenue: $1.04B
- RPO: $6.7B (+34% YoY)
- Net Revenue Retention: 124%
- Customers with >$1M TTM Product Revenue: 606 (up from 485 YoY)
- Non-GAAP Operating Margin: 9%
- GAAP Operating Loss: $447M
- Stock Buybacks: $491M for 3.2M shares
- Cash & Equivalents: $4.9B
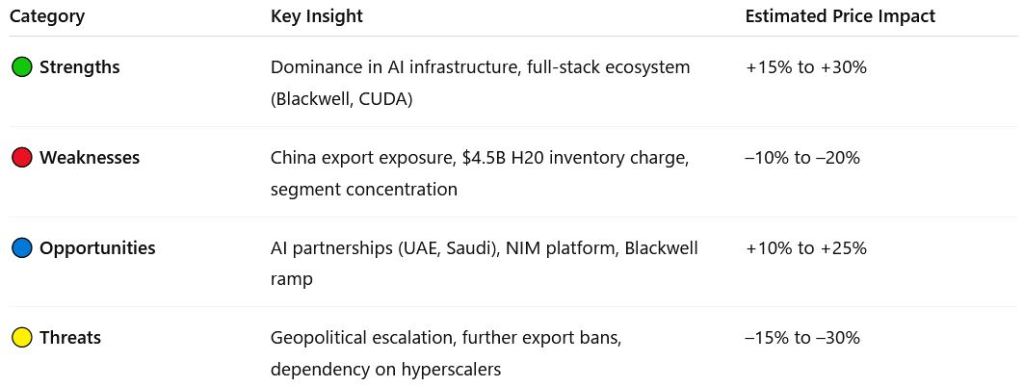
What’s Working, What’s Risky – A Closer Look Through SWOT
Snowflake is a stock that forces investors to weigh long-term platform optionality against short-term valuation concerns. Here’s a structured breakdown of what’s unfolding beneath the headline figures.

Strengths
Snowflake’s product revenue growth remains strong, and its customer expansion—especially among those spending over $1 million annually—is accelerating. Net revenue retention of 124% underscores the stickiness and expanding utility of its platform. This kind of enterprise engagement doesn’t happen by accident; it’s driven by real product need and trust.
Stock price impact estimate: +$15–20 if this strength remains consistent and margin discipline improves.
Weaknesses
Despite strong topline growth, Snowflake still posted a $447 million GAAP operating loss. Stock-based compensation remains a drag on profitability. And while buybacks support the stock, they also reduce cash flexibility if market conditions tighten.
Stock price impact: –$5–10 as margins and profitability concerns limit upward re-rating in the near term.
Opportunities
The company is betting big on AI. Cortex could become a high-margin differentiator if widely adopted. Snowflake also benefits from developer ecosystem momentum and the expanding Data Marketplace. If it becomes the default AI+data platform for enterprises, the upside could be meaningful.
Stock price upside estimate: +$25–40 if Cortex monetization scales successfully over the next 12–18 months.
Threats
Competition in this space is no joke. AWS, Google Cloud, and Databricks are all investing heavily in adjacent technologies. Additionally, Snowflake’s premium valuation leaves little room for error—any slowdown in growth or delay in AI execution could lead to multiple compression.
Risk-adjusted downside: –$20–30 if growth cools or AI monetization underwhelms.

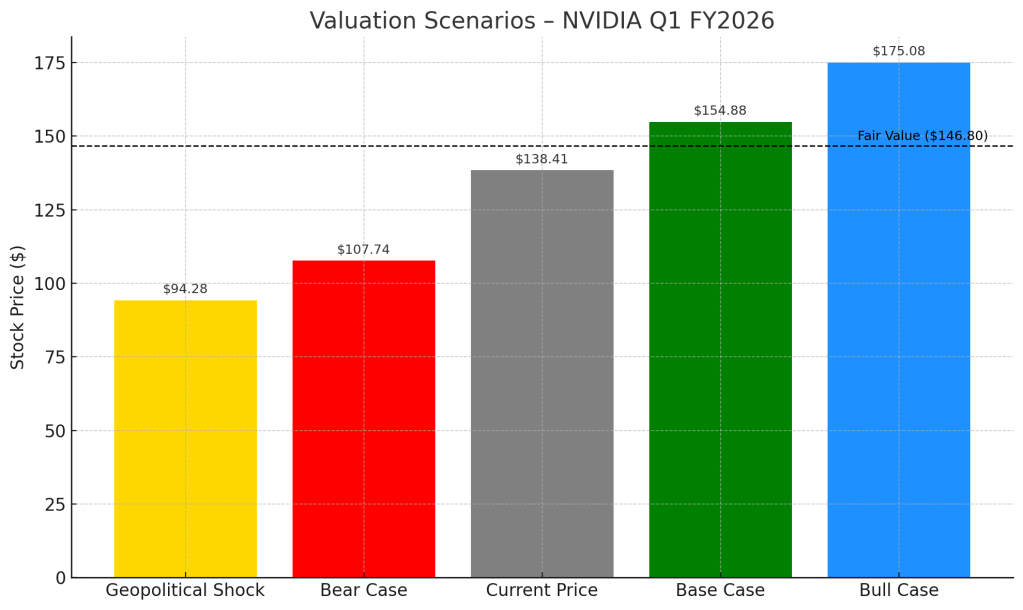
Valuation Scenarios – What’s Priced In, and What’s Not
With Snowflake closing at $203.18 post-earnings, investors are clearly pricing in confidence in long-term platform growth. But how realistic is that pricing under different conditions?

Base Case
- Summary: Continued 25%+ product revenue growth, stable margin trajectory, Cortex adoption builds gradually
- Estimated Fair Value: $150
- Probability: 60%
Bull Case
- Summary: Accelerated AI adoption, operating leverage unlocks quickly, free cash flow turns sustainably positive
- Valuation: $240
- Probability: 25%
Bear Case
- Summary: Macro slowdown, AI workloads fail to monetize, continued margin drag
- Valuation: $110
- Probability: 15%
Weighted Average Fair Value
(150×0.6)+(240×0.25)+(110×0.15) = $157.50
At $203, the stock is pricing in the bull case—or close to it.
Verdict – Hold for Believers, Wait for Better Entry for Everyone Else
Snowflake is undeniably a category-defining company. Its platform moat is real, and its long-term relevance in enterprise AI looks promising. But the valuation today assumes a lot—particularly that Cortex and related AI monetization will ramp fast and wide.
If you’re already long and believe in the vision, it’s a Hold. If you’re looking to initiate a position, it may be wiser to wait for a pullback or more concrete signs of AI revenue contribution.
Want More Candid, Analyst-Style Stock Breakdowns?
Subscribe to our newsletter and follow us for deeper, data-driven takes on the biggest names in tech and AI. No hype, no noise—just strategy and substance.
Disclaimer
This article is based solely on Snowflake’s official Q1 FY2026 earnings report and call transcript. It is not financial advice. Always do your own due diligence before investing.


Leave a comment