

TL;DR: Baidu’s AI Cloud Is Booming, But Ad Weakness Lingers
Goldman Sachs reaffirmed its Buy rating on Baidu despite trimming its price target. Beneath the drag of declining ad revenue lies a fast-growing AI cloud engine and deep integration into China’s AI strategy. In Q1 2025, Baidu’s cloud grew over 40%, outpacing peers like Alibaba and Tencent. While earnings dipped, strategic investments in ERNIE AI and Apollo Go are gaining traction. At ~$84, Baidu trades at a 20–25% discount to its estimated fair value.

Quick Risk Snapshot
Top 3 Risks at a Glance
- Export Controls: U.S. chip curbs may limit Baidu’s model training capabilities
- Regulatory Crackdown: Surprise data or AI rules in China could cut valuations overnight
- Monetization Gap: ERNIE is technically impressive—but where’s the revenue?
Q1 2025 Recap: AI is Surging, but Ads Still Weigh on Profitability
Baidu delivered a mixed but forward-looking quarter. Revenue rose 3% YoY to ¥32.45 billion, beating expectations, driven by a 42% jump in AI Cloud services. However, its core advertising revenue declined 6%, pulling EPS down by 7%.
Management emphasized that Baidu is no longer just an ad business. CFO Junjie He called AI Cloud a “structural growth engine,” with new pricing strategies designed to build market share quickly.
Why it matters: This quarter signals that Baidu is chasing scale and infrastructure leadership—not just short-term margins.

Key Highlights
- Revenue: ¥32.45B (+3% YoY)
- Adjusted EPS: ¥18.54 (–7% YoY)
- AI Cloud: ¥9.4B (+42% YoY)
- Ad Revenue: ¥16.0B (–6%)
- ERNIE AI: Free-tier and Turbo upgrades launched
- Apollo Go: Overseas ops launched in UAE and Switzerland
- Buybacks: $445M in Q1; $2.1B total
- Ratings: Goldman, Benchmark maintain Buy

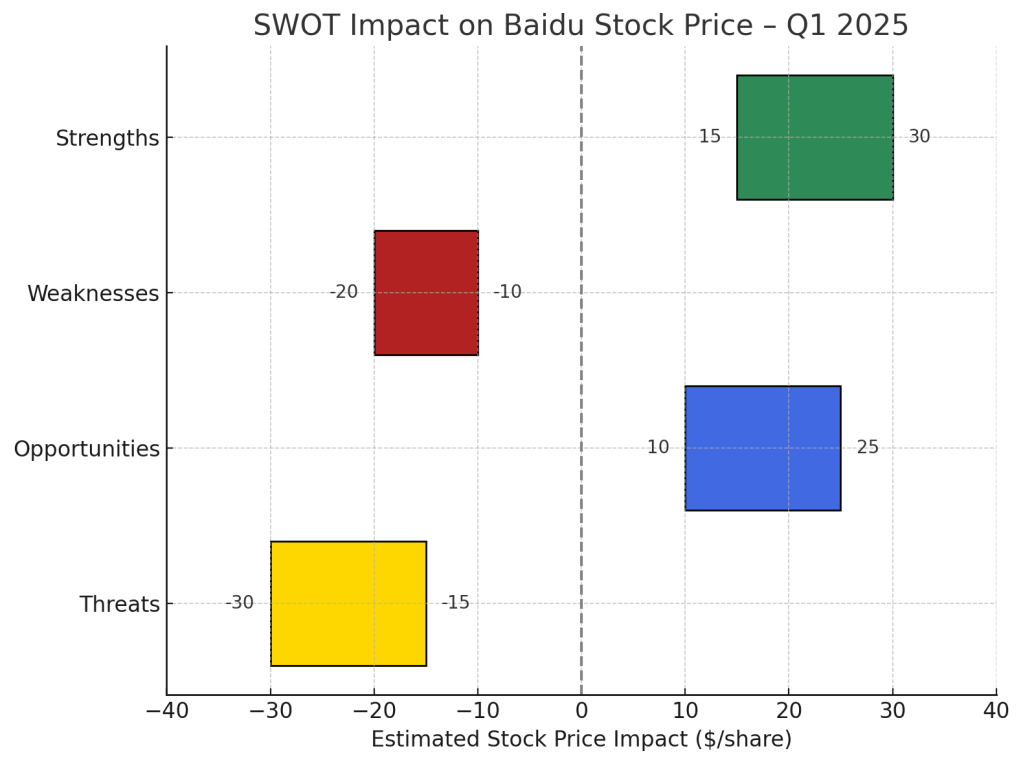
SWOT Analysis: A High-Potential Pivot With Limited Room for Error
Let’s break it down using the SWOT framework—what’s working, what’s not, where upside lies, and what could derail the story.
Strengths
- AI Cloud Outperformance: 42% growth beats Alibaba (+18%) and Tencent (+5%)—suggests Baidu’s architecture is gaining real-world adoption.
- ERNIE Model Pipeline: Free, open-access models with advanced reasoning (X1) and multimodal capability (4.5) aim to build developer lock-in.
- Backed by Big Names: Goldman and Benchmark keeping Buy ratings provides institutional cover.
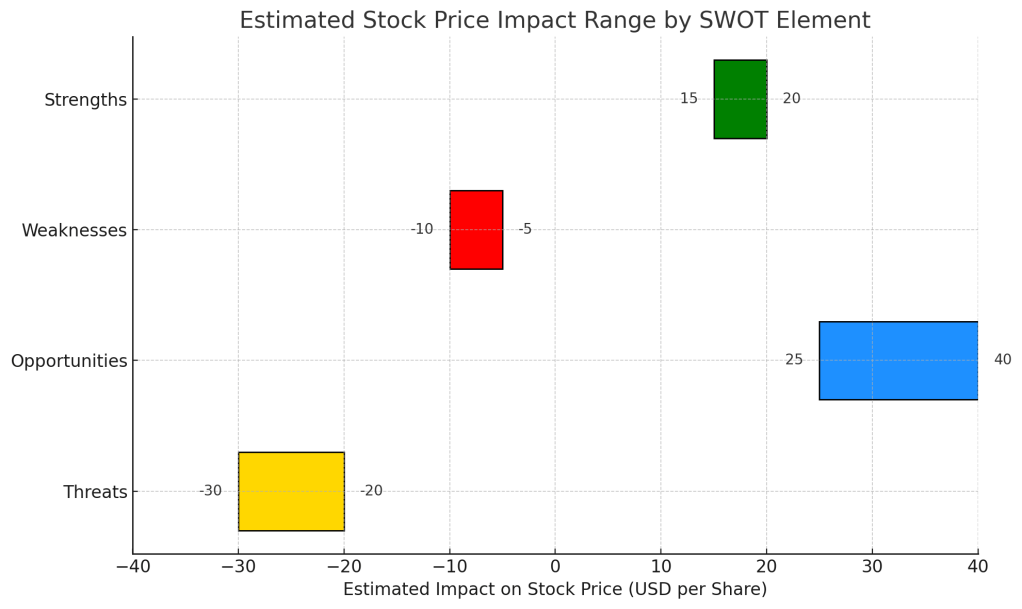
+ Price Impact: +$15 to +30
Weaknesses
- Ad Revenue Shrinkage: 6% drop in core advertising weakens cash flow reliability.
- Earnings Pressure: Margin compression from free tools, price cuts, and rising AI compute costs.
- Transparency: Baidu’s upbeat tone feels disconnected from profitability trends—investors may question reporting quality.
– Price Impact: –$10 to –20
Opportunities
- China AI Policy Tailwinds: Backed by a ¥60B national AI fund, Baidu is well-positioned as a state-aligned infrastructure play.
- Apollo Go Global: Early mover in robotaxis beyond China borders—may attract sovereign or enterprise partnerships.
- AI Monetization Path: If Baidu can convert ERNIE from R&D to revenue via enterprise tools or cloud inference APIs, re-rating likely.
+ Price Impact: +$10 to +25
Threats
- Tech Export Curbs: U.S. chip bans on Nvidia/AMD AI hardware limit model training capacity.
- Rising Domestic Competition: Alibaba’s Tongyi Qianwen and Tencent’s Hunyuan are growing fast with commercial APIs.
- Delisting/Regulatory Risk: ADR structure, CCP data controls, or surprise regulation could drastically change valuation environment.
- Currency Volatility: RMB depreciation adds an FX layer to Baidu’s dollar-denominated shares.
– Price Impact: –$15 to –30
| Factor | Range Impact | Notes |
|---|---|---|
| Strengths | +15 to +30 | Cloud & ERNIE momentum |
| Weaknesses | –10 to –20 | Ad reliance, earnings fade |
| Opportunities | +10 to +25 | Policy & mobility tailwinds |
| Threats | –15 to –30 | Geopolitical and regulatory |
Implied Range: $69 – $114 vs current price ~$84
Valuation Scenarios: How It Could Play Out
Valuation = EPS forward × P/E
Base Case – 7.00 × 15 = $105
Cloud keeps scaling, ads stabilize
Probability: 60%
Bull Case – 7.75 × 18 = $140
Enterprise AI lands, Apollo Go JV, margin gains
Probability: 25%
Bear Case – 5.00 × 15 = $75
AI stalls, chip blocks hit hard, new China policy drop
Probability: 15%
Weighted Average Estimate: $106.25 → +26% upside
(105×0.6)+(140×0.25)+(75×0.15)=106.25

Verdict: Cautiously Optimistic, AI-Led Rerating Is Possible
Baidu’s execution is improving, even as its earnings lag. AI Cloud is clearly working. ERNIE shows potential. Apollo Go is going international. Still, transparency, monetization, and policy remain wildcards.
If you believe China is serious about tech independence, Baidu is its AI bet. The risk/reward is no longer binary—but still asymmetric.
Our Take: Slightly undervalued. Buy/accumulate with a long-term AI view.
What Would Change Our View?
Upside Triggers
- AI monetization evidence (cloud APIs, enterprise adoption)
- Positive shift in U.S.-China chip policy
- Robotaxi revenue in H2
Downside Red Flags
- Surprise AI regulation in China
- Margin compression without revenue pickup
- Negative audit news or delisting pressure
Call to Action
Want more AI-powered investment breakdowns—without the hype? Follow @SWOTstock and get the next big move before the headlines hit.
Disclaimer
This post is based solely on Baidu’s official financial report, earnings call, and verified analyst commentary. It is not investment advice. Please do your own research.


Leave a comment