💳 American Express Q2 2025: Still Premium, But Fairly Valued?

American Express (AXP) Q2 2025 earnings analysis: record revenue, 3.1M new cards, and strong fee growth offset by rising costs. SWOT analysis, valuation scenarios, and price outlook for value investors.

TL;DR Summary

American Express (AXP) posted record revenue and beat EPS expectations, yet shares dipped slightly as investors digested rising costs and macro risk. Despite strong cardholder engagement and new card growth, the current valuation leaves little margin of safety. AXP looks like a “Hold” — with better buying potential under $290.


Q2 2025 Recap: Resilient Premium Growth, Margin Watch

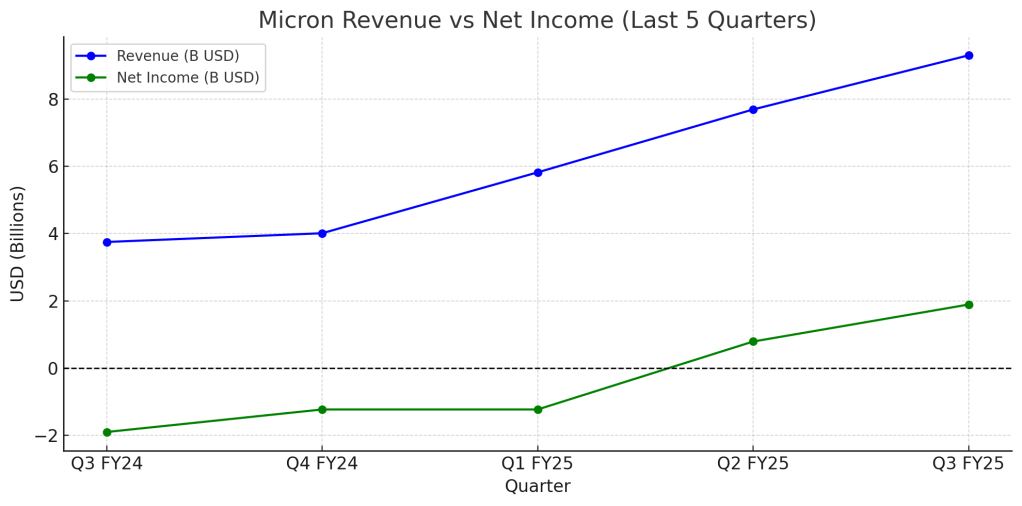
AXP reported $17.9B in revenue (+9% YoY) and EPS of $4.08, beating consensus estimates. Spending in premium categories stayed strong, with +10% in business-class travel and +9% in luxury lodging. The company added 3.1 million new cards, a majority in fee-paying tiers.

Despite strong revenue, expenses grew 14% YoY, primarily due to investments in the Platinum platform, Centurion Lounge expansion, and digital infrastructure. Management reaffirmed full-year guidance and expressed confidence in monetizing these investments starting Q4.


Key Highlights

  • Record revenue: $17.9B (+9% YoY)
  • EPS: $4.08 (vs. $3.87 est.)
  • Fee revenue: +20% YoY
  • Luxury spend: +10% (biz class), +9% (lodging > $5K)
  • New cards: 3.1M (majority fee-based)
  • Expenses: +14% YoY
  • Guidance reaffirmed: EPS $15.0–15.5 for FY25

📈 Revenue vs Net Income (Past 5 Quarters)
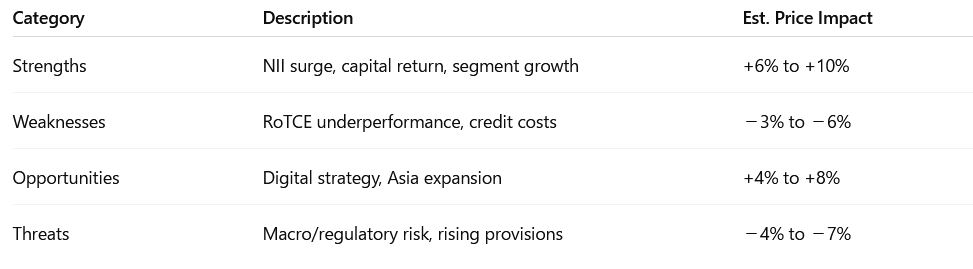
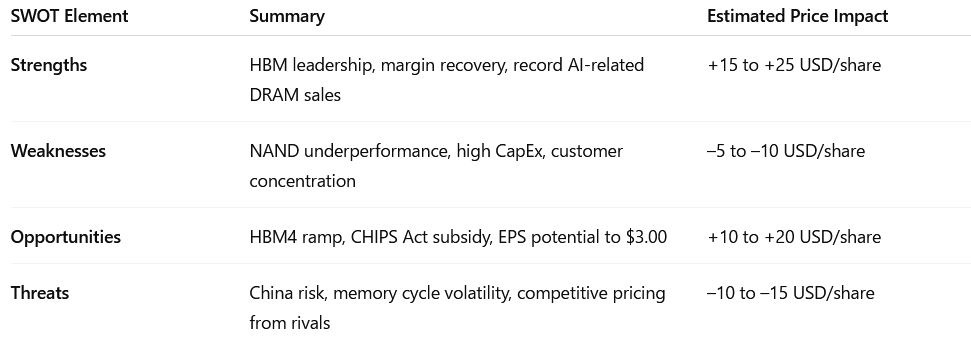
Line chart showing American Express revenue and net income trends over the past five quarters from Q2 2024 to Q2 2025

SWOT Analysis

In Q2 2025, American Express showed strong fundamentals with growing revenue and customer engagement, but rising expenses and macro uncertainty created a more balanced risk-reward profile.

Strengths

  • Consistent top-line growth
  • Strong brand and pricing power
  • EPS beat and stable credit metrics
  • High-spend user base remains sticky
    → Impact: +$10 to +$15

Weaknesses

  • Operating costs growing faster than revenue
  • Near-term margin pressure
    → Impact: –$5 to –$10

Opportunities

  • Upside from monetizing Platinum & lounges
  • Rising NII and strong card acquisition
    → Impact: +$8 to +$12

Threats

  • Valuation premium (~21× P/E)
  • Macro risk: spending could slow
    → Impact: –$10 to –$15
SWOT table summarizing price impact estimates for American Express Q2 2025 including Strengths, Weaknesses, Opportunities, and Threats

📊 SWOT Price Impact Chart
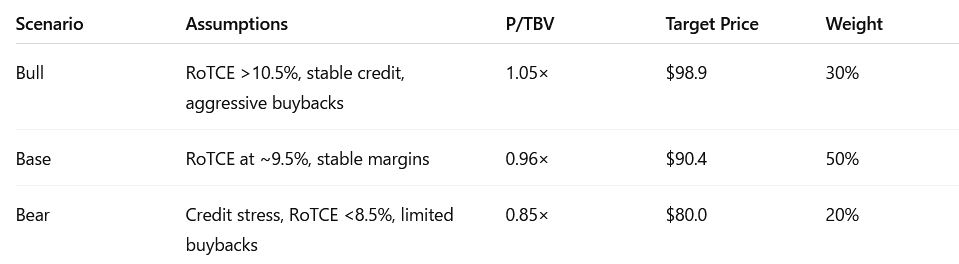
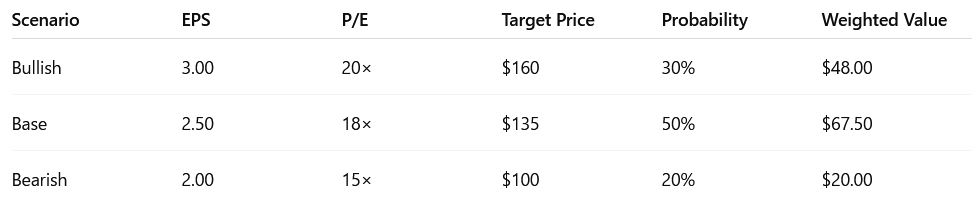
Bar chart showing estimated price impacts of Strengths, Weaknesses, Opportunities, and Threats for American Express

Valuation Scenarios

To gauge where American Express stock could head next, we modeled three valuation scenarios based on management’s full-year EPS guidance and current market conditions. These scenarios—bull, base, and bear—reflect different assumptions about earnings performance and valuation multiples. By assigning probabilities to each case, we arrive at a fair value estimate to help long-term investors assess risk and reward more objectively.

Valuation scenarios table showing bull, base, and bear cases for American Express Q2 2025 with price targets and EPS assumptions

🎯 Fair Value = $307 (probability-weighted)

Visual 3: 📐 Valuation Scenario Chart

Vertical bar chart comparing bull, base, bear valuation targets and current price of AXP

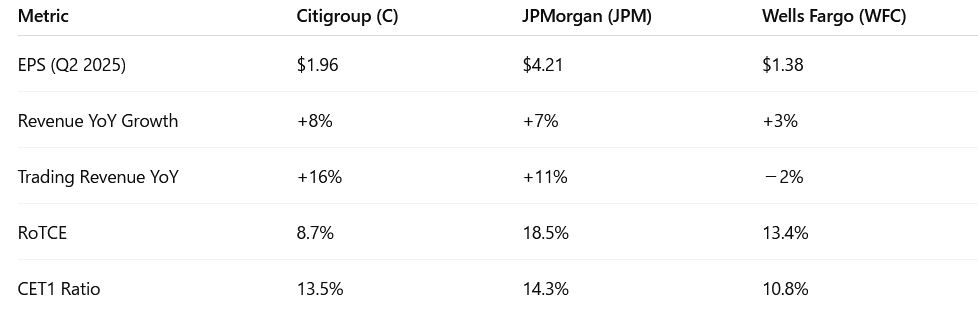
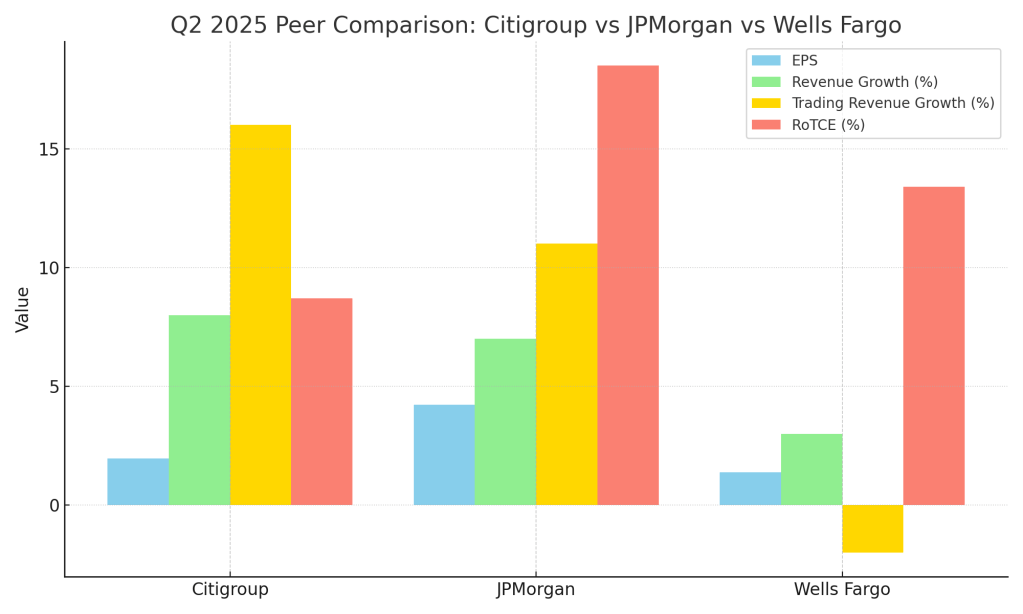
Peer Comparison: How Does AXP Stack Up?

Before deciding whether to hold or accumulate more shares, it’s helpful to see how American Express stacks up against similar financial giants. While AXP excels in card fee growth and premium customer acquisition, competitors like Visaand Capital One offer different strengths—whether it’s higher scale or better short-term valuation. Here’s a snapshot comparing key financial metrics from Q2 2025 across the three companies:

Table comparing American Express to Visa and Capital One on EPS growth, revenue growth, operating expenses, dividend yield, and forward P/E ratio in Q2 2025

Verdict: Hold For Now — But Watch That $290 Line

American Express is still executing at a high level, but the stock looks fully priced for now. With fair value near $307, the market isn’t offering a discount. For long-term investors, a dip to the $280–290 range could create a more attractive setup.

📌 Current View: Hold
📉 Buy Zone: Under $290
📈 Re-evaluate: Over $325


Call to Action

Enjoying SWOTstock’s clean, earnings-driven breakdowns?
Follow us for investor-focused insights on earnings season.
No hype. Just data, discipline, and decisions that work.


Disclaimer

This analysis is for informational purposes only and does not constitute investment advice. All data is sourced from American Express’s official Q2 2025 earnings release and call transcript.


Leave a comment


🏦 Citigroup Q2 2025: Resilient Earnings, But Has the Turnaround Arrived?

Citigroup Q2 2025 earnings beat expectations with strong trading revenue and capital returns. See our SWOT analysis, fair value estimate, and how Citi stacks up against JPMorgan and Wells Fargo.

TL;DR Summary

Citigroup posted a robust Q2 beat, with EPS up 29% YoY and trading revenue surging in volatile markets. Its RoTCE improved to 8.7%, but still trails its 2026 target. With a tangible book value of $94.16 and a fair value estimate of $90.87, the stock appears fairly priced — but global expansion and capital return plans could drive future upside.


Q2 2025 Earnings Recap

Citigroup reported net income of $4.0B and EPS of $1.96, exceeding consensus expectations. Revenue rose 8% YoY to $21.7B, driven by double-digit growth in Markets and US Personal Banking. Trading desks thrived amid tariff-related volatility, while the firm continued to pare down non-core operations and reinvest in digital.

Line chart showing Citigroup’s revenue and net income over the past five quarters from Q2 2024 to Q2 2025.

Key Metrics:

  • Revenue: $21.7B (+8% YoY)
  • Net Interest Income: +12% YoY
  • RoTCE: 8.7%
  • Tangible Book Value (TBV): $94.16
  • CET1 ratio: 13.5%
  • Capital Returned: $3.1B via buybacks and dividends

Management Highlights & Macro Context

On the earnings call, management reiterated its goal to reach 10–11% RoTCE by 2026, noting that simplification and technology modernization are key levers. Management acknowledged macro uncertainties but emphasized a strong capital position and stable consumer credit trends.

Meanwhile, markets benefited from tariff-induced volatility, boosting trading revenue by 16% YoY — the highest since 2020. Consumer banking remained steady, and Citi’s global diversification shielded it from regional slowdowns.


Strategic Growth: Asia in Focus

Citigroup is doubling down on Asia. The firm increased its Japan investment banking headcount by 15%, and reported a 140% YoY rise in institutional banking fees from Japan alone. This aligns with its plan to boost international dealmaking and fee-based income amid soft domestic lending margins.


Peer Comparison: How Did Citi Stack Up?

Compared to JPMorgan and Wells Fargo, Citigroup still lags on profitability metrics like RoTCE (8.7% vs. JPM’s 18.5% and WFC’s 13.4%). However, Citi outperformed both in revenue growth (+8%) and trading revenue (+16%), indicating strength in capital markets and global diversification. Its CET1 ratio of 13.5% also reflects robust capital flexibility—positioning it well for continued buybacks and selective growth investments. The key gap remains consistent shareholder return and operational efficiency, which Citi is still working to close.

Q2 2025 financial comparison table of Citigroup, JPMorgan, and Wells Fargo showing EPS, revenue growth, trading performance, RoTCE, and CET1 ratios.
Grouped bar chart comparing Citigroup, JPMorgan, and Wells Fargo for Q2 2025: EPS, revenue growth (%), trading revenue growth (%), and RoTCE (%).

🧠 SWOT Analysis

Strengths

Resilient earnings growth and capital return.
Citigroup delivered strong YoY net income growth (+25%) and EPS of $1.96, with over $3B in capital returned via buybacks and dividends. Net interest income surged +12%, with double-digit revenue growth in key segments (Markets, Services, US Personal Banking). CET1 ratio at 13.5% gives capital flexibility.

💰 Estimated Price Impact: +6 to +10%
If sustainable RoTCE > 9% is priced in with buybacks continuing, target valuation rises toward tangible book.

Weaknesses

Still below RoTCE target, cost pressure lingers.
At 8.7%, RoTCE is still short of management’s 10–11% 2026 target. Expenses rose 2% YoY (3% adj.), and cost of credit rose +16%. Execution risk remains on strategic transformation.

📉 Estimated Price Impact: −3 to −6%
Market may discount earnings quality or raise concerns about future margin compression.

Opportunities

Strategic repositioning + digital scale-up.
Management reiterated restructuring plans, exited non-core markets, and emphasized digital growth (incl. tokenized asset initiatives and credit cards). These efforts aim to lift RoTCE structurally.

🚀 Estimated Price Impact: +4 to +8%
If digital scale materializes and operating leverage improves, upward re-rating to 0.95–1.05x TBV is possible.

Threats

Macro risk + regulatory shifts.
Loan reserves were built up in response to macro uncertainty and higher charge-offs in cards. Also, potential regulatory capital rule changes (Basel Endgame) could pressure CET1 deployment.

⚠️ Estimated Price Impact: −4 to −7%
Any credit deterioration or CET1 squeeze could limit upside from capital return plans.


📊 Summary SWOT Table (Price Impact Ranges)

SWOT analysis table for Citigroup Q2 2025 showing strengths, weaknesses, opportunities, and threats with estimated stock price impact ranges.
Horizontal bar chart showing Citigroup’s Q2 2025 SWOT price impact ranges: Threats (-7% to -4%), Opportunities (+4% to +8%), Weaknesses (-6% to -3%), and Strengths (+6% to +10%), with a vertical dashed line at 0%

📈 Valuation Scenarios Based on SWOT

Assume current price = $90, Tangible Book Value (TBV) = $94.16, base-case P/TBV target = 0.95×–1.00×


Valuation scenarios table for Citigroup Q2 2025 showing bull, base, and bear cases with P/TBV multiples, target prices, and probability weights.

Fair Value=(98.9×0.3)+(90.4×0.5)+(80.0×0.2)=$90.87

Vertical bar chart showing Citigroup’s Q2 2025 valuation scenarios: Bull case ($98.9, green), Base case ($90.4, gray), Bear case ($80.0, red), and Current Price ($90.0, black), with a dotted blue line at Fair Value ($90.87).

Fair Value & Verdict

At $90, Citigroup trades near our fair value estimate of $90.87. The stock reflects Q2’s upside already, and future gains depend on the bank hitting its RoTCE goals and expanding fee-based revenues abroad.

Investor Verdict:
Neutral near-term outlook. Value investors should monitor credit trends and execution on transformation. Accumulate if price dips closer to TBV ($94.16) with upside potential from Asia growth and capital return.


📬 Call to Action

Want to compare Citi’s Q2 against JPMorgan and Wells Fargo?
Check out our SWOTstock posts on those banks and subscribe for updates after every major U.S. bank report.


⚠️ Disclaimer

This article is for informational purposes only and not investment advice. All analysis is based on Citigroup’s official Q2 2025 financial report and earnings call. No external analyst projections or third-party commentary were used.


Leave a comment


Micron Is Back in the Game: Q3 2025 Proves AI Demand Is Real — But Is the Stock Still a Buy?

Micron’s Q3 FY2025 earnings reveal a strong AI-driven rebound with record DRAM sales, margin expansion, and rising profitability. Explore our SWOT analysis, valuation scenarios, and stock price outlook based solely on official financials and management commentary.

TL;DR Summary

Micron (NASDAQ:MU) reported blockbuster Q3 FY2025 earnings, fueled by explosive growth in AI memory demand — especially for high-bandwidth memory (HBM), which exceeded $1 billion for the quarter and is already sold out for 2025. With EPS of $1.91 and Q4 guidance pointing even higher, Micron is making a strong case for a rerating. Our updated fair value estimate is $135.50, implying modest upside from current levels, but more importantly, confirming Micron’s transition from cyclical to structural relevance in the AI build-out.


Quarter Recap: A Turning Point in the Cycle

For years, Micron has lived and died by the memory cycle. But Q3 FY2025 feels different. The company reported its highest-ever quarterly revenue at $9.3 billion, a 37% year-over-year increase. DRAM led the charge, generating $7.1 billion, while HBM demand — largely driven by AI servers — grew over 50% quarter-over-quarter and surpassed $1 billion for the first time. Management confirmed that all HBM supply is committed through the end of 2025, signaling not just demand, but pricing power.

Gross margin came in at 39% (non-GAAP), and EPS surged to $1.91, up from a loss just one year ago. More importantly, free cash flow turned decisively positive at $1.95 billion, providing flexibility for both investment and shareholder return.

Micron also reaffirmed its long-term strategic positioning with a $200 billion commitment to U.S. manufacturing and R&D under the CHIPS Act. This isn’t just a bounce-back quarter — it looks like a foundation for a new phase of sustained growth.

Line chart showing Micron’s revenue and net income over the past five quarters. Revenue steadily rises from $3.75 billion in Q3 FY24 to $9.30 billion in Q3 FY25. Net income starts at –$1.9 billion, remains negative until Q1 FY25, then turns positive in Q2 FY25 and reaches $1.89 billion in Q3 FY25. The chart includes a horizontal dashed line at zero to mark the breakeven point.

What’s Fueling the Momentum?

The key driver is unmistakably AI. As hyperscalers expand their infrastructure to support large language models and enterprise AI deployments, demand for advanced memory — particularly HBM and DDR5 — has exploded. Micron’s unique position as one of just a few players in this space is enabling it to lock in customers at strong margins.

But it’s not just the top line that’s improving. Operating leverage is finally kicking in. Inventory days are falling, CapEx is normalizing, and the company’s balance sheet is healthy with over $27.9 billion in total liquidity. For growth investors watching this space, Micron is beginning to look like a structurally profitable company, not just a cyclical memory supplier.

Stacked bar chart showing Micron’s DRAM and NAND revenue over the last five quarters. DRAM revenue increases from $2.75 billion in Q3 FY24 to $7.10 billion in Q3 FY25. NAND revenue grows from $1.00 billion to $2.20 billion over the same period. DRAM consistently contributes the larger share of total revenue, with a noticeable acceleration starting in Q1 FY25

SWOT Analysis: Breaking Down the Fundamentals

Rather than relying on sentiment or social media buzz, let’s unpack the key forces driving Micron’s stock — both good and bad — based on official data and management commentary.

Bar chart showing estimated stock price impact ranges for Micron Q3 FY2025 by SWOT category. From top to bottom: Strengths range from +15 to +25 USD, Weaknesses from –10 to –5 USD, Opportunities from +10 to +20 USD, and Threats from –15 to –10 USD. Bars are color-coded green, red, blue, and yellow respectively. The x-axis ranges from –20 to 25 USD per share, indicating estimated contribution to Micron’s stock price from each factor.

Strengths (+$15 to +25/share)

Micron’s execution in AI memory is the real story. HBM revenue not only topped $1B but is fully booked through next year. The 1-gamma DRAM node — with 30% density and 20% power improvements — is entering early production, providing a margin and performance edge.

Weaknesses (–$5 to –10/share)

Despite DRAM’s strength, NAND continues to underperform (+4% YoY), and high CapEx levels weigh on near-term cash conversion. There’s also concentration risk — a handful of cloud customers drive a significant portion of revenue.

Opportunities (+$10 to +20/share)

With CHIPS Act funding unlocking domestic capacity and HBM4 set to launch, Micron has multiple ways to extend its lead. If FY26 EPS trends toward $3.00, the market may rerate MU toward a higher earnings multiple.

Threats (–$10 to –15/share)

AI cycles are notoriously hard to predict. Any slowdown in server buildouts, export restrictions to China, or aggressive pricing from Samsung and SK Hynix could compress Micron’s margins and reduce upside.

📊 Micron Q3 FY2025 SWOT Summary

SWOT summary table for Micron Q3 FY2025 showing four categories: Strengths include HBM leadership and margin recovery with an estimated impact of +15 to +25 USD/share; Weaknesses include NAND underperformance and high CapEx with an impact of –5 to –10 USD/share; Opportunities highlight the HBM4 ramp and CHIPS Act subsidy with +10 to +20 USD/share impact; Threats note China risk and competitive pricing pressure with –10 to –15 USD/share impact.

Valuation Scenarios: Calculating What It’s Worth

Based on Micron’s own forward guidance, historical multiples, and a fair risk-adjusted outlook, here’s how we frame the valuation:

Valuation scenarios table for Micron Q3 FY2025. The bullish case assumes $3.00 EPS and 20× P/E for a $160 target, with 30% probability and $48 weighted value. The base case uses $2.50 EPS and 18× P/E for a $135 target, with 50% probability and $67.50 weighted value. The bearish case assumes $2.00 EPS and 15× P/E for a $100 target, with 20% probability and $20 weighted value. The probability-weighted fair value estimate is $135.50 per share.

🎯 Fair Value Estimate:

$48.00 + $67.50 + $20.00 = → $135.50/share
📉 Current Price (as of June 26): ~$127.25
📈 Implied Upside: ~6.5%

Bar chart showing Micron’s Q3 FY2025 valuation scenarios. Bear case target is $100 (red), base case is $135 (gray), bull case is $160 (green), and current stock price is $127 (black). A dotted blue line marks the calculated fair value at $136. The chart illustrates relative upside potential under different earnings scenarios.

Peer Context: How Does Micron Stack Up?

Micron’s 39% gross margin now rivals Samsung’s memory division but still trails SK Hynix’s HBM-focused business, which has hit margins north of 45%. However, Micron’s consistent EPS acceleration — paired with a cleaner balance sheet and U.S. production capacity — could justify a premium multiple in future quarters.

Bar chart comparing gross margins of major memory players for Q3 FY2025. Micron has a 39% gross margin, SK Hynix leads with 45%, and Samsung’s memory division reports 40%. The chart highlights Micron’s competitive positioning, slightly behind its Korean peers in profitability.

What to Watch Next Quarter

  1. HBM4 Ramp-Up: Will Micron maintain pricing power as next-gen chips hit production?
  2. CapEx Discipline: Is investment tapering enough to keep FCF positive?
  3. AI Demand Stickiness: Does server spending hold up into year-end?

Verdict: Hold to Accumulate

Micron is no longer just a cyclical memory stock — it’s emerging as a core infrastructure provider for the AI era. At today’s price around $127, the stock offers a balanced risk-reward profile with clear near-term momentum and longer-term optionality. For tech-savvy growth investors, this is a name to hold and continue accumulating on dips — not chase blindly, but don’t look away either.


Call to Action

If you’re tracking AI infrastructure plays and want insights backed only by the official data — not clickbait — follow SWOTstock or subscribe for the next update.


Disclaimer

This post is for informational purposes only. All analysis is based solely on Micron’s official Q3 FY2025 financial report and earnings call transcript. No third-party data or analyst commentary was used.


Leave a comment