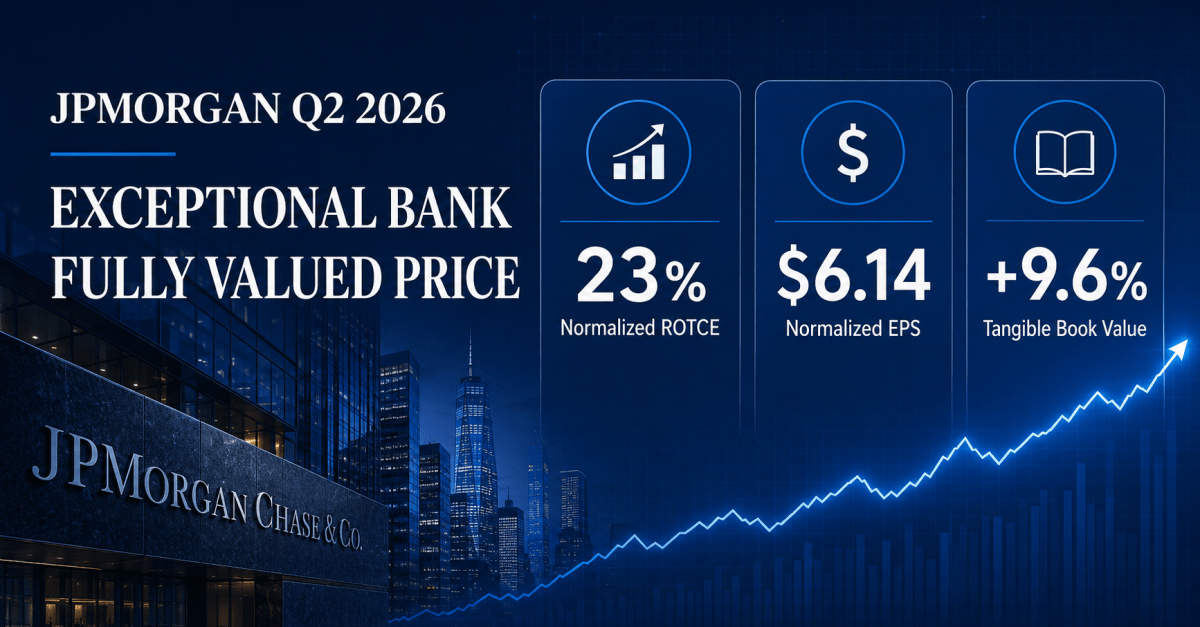
JPMorgan Q2 2026: An Exceptional Bank at a Fully Valued Price

JPMorgan Chase reported a strong Q2 2026, with net income of $21.2 billion and a normalized ROTCE of 23%. Despite impressive growth across various sectors, the stock trades at a high valuation, raising concerns for value investors. The current price offers limited upside, suggesting further caution before investing.

TL;DR

JPMorgan Chase (NYSE: JPM) delivered another powerful quarter, with broad revenue growth, resilient credit quality and a normalized return on tangible common equity of 23%. Even after removing substantial one-time investment gains, underlying net income increased 13% year over year.

The issue for value investors is price. At $338.87, JPMorgan trades at approximately 3.0 times tangible book value and 13.8 times annualized normalized earnings. Our probability-weighted valuation is approximately $339, suggesting that the shares already reflect much of JPMorgan’s superior franchise quality.

This is an excellent bank, but not currently an obvious bargain.

Quarter Recap

JPMorgan reported Q2 2026 net income of $21.2 billion, equivalent to diluted EPS of $7.70. Managed revenue increased 27% year over year to $58.0 billion, while reported ROTCE reached 29%.

However, headline earnings included a $3.4 billion after-tax gain on Visa shares and $776 million of gains on other equity investments. Excluding these items, JPMorgan reported normalized net income of $16.9 billion, EPS of $6.14 and ROTCE of 23%.

That distinction matters. The investment gains created genuine shareholder capital, but they should not be treated as recurring operating earnings. On the normalized numbers, the quarter remained exceptionally strong without overstating the bank’s sustainable earnings power.

Revenue growth was broad:

  • Consumer & Community Banking revenue increased 8% to $20.3 billion.
  • Commercial & Investment Bank revenue rose 27% to $24.9 billion.
  • Asset & Wealth Management revenue increased 19% to $6.9 billion.

Net interest income reached $25.6 billion, up 10%, while managed noninterest revenue increased 45% to $32.4 billion. Management now expects approximately $105.5 billion of net interest income for 2026.

Credit conditions remained manageable. The retained-loan net charge-off rate declined to 0.66%, compared with 0.73% a year earlier, while the card net charge-off rate was broadly stable at 3.33%. JPMorgan recorded a modest $149 million reserve build during the quarter.

The principal area requiring attention was spending. Noninterest expense rose 15% to $27.3 billion, and management expects approximately $107.5 billion of adjusted expense for the full year.

Sources: JPMorgan’s Q2 2026 earnings releaseearnings presentation and financial supplement.

Market Reaction

The market’s initial reaction was surprisingly cautious. JPMorgan opened at $327.00 on July 14, down 2.25% from its pre-earnings close of $334.53, and briefly fell to $325.75.

The selling did not last. Shares reversed sharply, reached $344.73 and closed at $342.89—up 2.50% from the previous close and near the top of the day’s range. Trading volume was approximately double the previous session’s level.

The stock gained another 1.17% on July 15, closing at $346.91, before giving back part of the advance. By July 20, JPMorgan had closed at $338.87, leaving it approximately 1.3% above its pre-earnings price.

The price action suggests that the results initially generated a convincing positive reassessment, but the market did not preserve the full earnings-day gain. That is consistent with a quarter that strengthened confidence in the business while providing less clarity on additional valuation upside.

Key Highlights

JPMorgan’s most important achievement was not the $7.70 headline EPS. It was the bank’s ability to generate a 23% normalized ROTCE while maintaining strong capital, manageable credit losses and growth across all three major operating businesses.

Tangible book value per share increased 9.6% year over year to $113.35. The bank maintained a 14.1% standardized CET1 ratio while returning approximately $10.2 billion to shareholders through dividends and net share repurchases during the quarter.

Commercial & Investment Bank was particularly strong. Investment-banking fees increased 30%, while Markets revenue rose 35%. Equity Markets revenue surged 86%, although investors should not assume that pace can be repeated every quarter.

Asset & Wealth Management also continued to develop into a larger recurring earnings engine. Assets under management increased 18% to $5.14 trillion, supported by $50 billion of long-term net inflows and $22 billion of liquidity inflows.

The quarter therefore reinforces JPMorgan’s competitive strength. The question is whether those strengths can continue producing enough tangible-book and earnings growth to justify a valuation approaching three times tangible book value.

SWOT Analysis

Strengths

Exceptional underlying profitability: +4% to +8%

A normalized ROTCE of 23% demonstrates that JPMorgan continues to earn substantially above a reasonable cost of equity. Sustaining returns above 20% would support continued tangible-book growth and justify a premium valuation relative to an ordinary large bank.

Diversified earnings engines: +2% to +5%

Consumer banking, commercial and investment banking, and asset and wealth management all produced meaningful revenue growth. This diversification reduces dependence on any single earnings source and makes JPMorgan’s overall franchise more resilient.

Capital generation and tangible-book growth: +6% to +9%

Tangible book value per share grew 9.6% year over year, even as JPMorgan returned substantial capital to shareholders. Continued tangible-book growth of approximately 6% to 9% would create a similar amount of underlying shareholder value if the valuation multiple remained stable.

Weaknesses

Rapid expense growth: −3% to −6%

Noninterest expense increased 15%, and the annual expense outlook has reached approximately $107.5 billion. JPMorgan can currently absorb that spending because revenue is strong, but a larger cost base increases the risk of negative operating leverage when markets slow.

Headline earnings overstate recurring performance: 0% to −4%

The Visa and equity-investment gains contributed $1.56 to quarterly EPS. These gains added real capital, but annualizing the reported $7.70 would understate JPMorgan’s recurring earnings multiple. The normalized EPS of $6.14 provides a more appropriate valuation baseline.

A demanding starting valuation: −7% to −10%

At $338.87, the stock trades at approximately 2.99 times tangible book value. Even modest multiple compression to between 2.69 and 2.79 times tangible book value could reduce the share price by approximately 7% to 10%, without any decline in book value.

Opportunities

Expansion of recurring wealth-management income: +3% to +6%

JPMorgan’s $5.14 trillion of assets under management and continued client inflows provide a growing source of fee income that does not require the same balance-sheet capital as traditional lending. Further scale could improve both earnings durability and the quality of the overall revenue mix.

Broader investment-banking recovery: +3% to +7%

Investment-banking fees increased 30%, complementing the exceptional Markets performance. A sustained recovery in advisory, underwriting and payments would broaden growth beyond unusually strong equity trading.

Further net-interest-income and loan growth: +2% to +5%

Management’s $105.5 billion NII outlook still leaves room for upside if loan growth remains healthy and deposit pricing develops favorably. A 2% to 4% positive variance could add roughly $0.60 to $1.19 to annual EPS.

Threats

Credit normalization: −4% to −9%

Current credit trends remain controlled, but provisions are already running at approximately $10 billion on an annualized basis. A 25% to 50% increase in credit provisions could reduce normalized earnings by approximately 3% to 6%, with a potentially larger share-price effect if investors also reduce the valuation multiple.

Interest-rate and deposit-cost pressure: −5% to −8%

Net interest income accounts for approximately 44% of managed quarterly revenue. Lower asset yields, faster deposit repricing or weaker loan demand could pressure one of JPMorgan’s most important earnings streams.

Higher regulatory capital requirements: −4% to −8%

Additional capital requirements could reduce repurchases and lower future ROTCE. Because JPMorgan already trades at a substantial premium, even a modest deterioration in capital efficiency could have an outsized effect on its valuation.

These SWOT ranges are independent sensitivities and should not be added together.

Valuation Scenarios

Bear Case: $270

The bear case assumes weaker net interest income, higher credit provisions and continued pressure from the enlarged expense base. Normalized EPS falls to approximately $21.50, while tangible book value grows only 4% to around $118 per share.

Applying 2.3 times tangible book value and 12.5 times normalized earnings produces an indicated value of approximately $270.

This represents roughly 20% downside from $338.87. Importantly, this scenario does not require a financial crisis—only ordinary credit normalization accompanied by the loss of part of JPMorgan’s premium valuation.

Base Case: $343

The base case assumes that JPMorgan keeps normalized earnings close to the current run rate, although unusually strong trading revenue moderates. Expenses remain broadly within management’s outlook, and credit conditions stay manageable.

Normalized EPS reaches approximately $24.50, while tangible book value increases around 7% to $121.30. Applying 2.83 times tangible book value and 14 times normalized earnings produces a value of approximately $343.

This offers only around 1% price appreciation. Including an annualized dividend of approximately $6.00 per share, the indicative total return would be close to 3%.

Bull Case: $398

The bull case assumes that investment banking remains strong, wealth-management inflows continue, net interest income meets or exceeds guidance and credit quality does not deteriorate materially.

Normalized EPS rises to approximately $27.50, while tangible book value grows 10% to about $124.70. Applying 3.2 times tangible book value and approximately 14.4 times normalized earnings produces a target near $398.

That would represent approximately 17% price upside, or roughly 19% total return including the indicated dividend. It requires both strong execution and continued investor willingness to pay an exceptional-quality premium.

Using probabilities of 25% for the bear case, 50% for the base case and 25% for the bull case produces a probability-weighted fair value of approximately $339 per share.

Verdict

JPMorgan’s Q2 results strengthen the case that it remains one of the highest-quality large banks in the world. Its 23% normalized ROTCE, diversified earnings base, strong capital generation and expanding wealth-management platform are difficult to replicate.

But quality and value are not the same thing.

At nearly three times tangible book value, the market is already assuming that JPMorgan will sustain exceptional profitability. The shares appear close to fair value, with a bear-case downside of approximately 20% and bull-case upside of around 17% before dividends.

For existing shareholders, the business fundamentals remain supportive. For a new value investor, however, the current price offers limited margin of safety. The investment proposition would become more attractive in the high-$200s, where the valuation would provide greater protection against ordinary credit, expense or multiple normalization.

Call to Action

Would you buy JPMorgan at today’s premium valuation, or wait for a wider margin of safety?

Share your view in the comments, and follow SWOTstock for more independent, earnings-based SWOT and valuation analysis.

Disclaimer

This article is for informational and educational purposes only and does not constitute investment, legal or tax advice. The valuation scenarios and price-impact ranges are estimates based on stated assumptions, not predictions or guarantees of future performance. Investors should conduct their own research and consider their financial circumstances and risk tolerance before making investment decisions.


Goldman Sachs Q2 2026: Record Earnings, but Is a 23% ROE Already Priced In?

Goldman Sachs reported remarkable Q2 results, with net revenue up 39% to $20.34 billion and EPS rising 92% to $20.98. While strong across various sectors, the current valuation appears high at $1,152.07, trading at 3.13 times book value. The fair value estimate is around $920, reflecting limited investment safety.

TL;DR Summary

Goldman Sachs (NYSE:GS) delivered an exceptional second quarter. Net revenue rose 39% to a record $20.34 billion, EPS increased 92% to $20.98, and annualized return on equity reached 23.5%. The strength extended across investment banking, FICC, Equities and Asset & Wealth Management, while operating leverage and capital returns also improved.

The market responded decisively. Goldman shares advanced 9.0% on the earnings day, from $1,045.91 to $1,140, and closed the following session at $1,152.07.

The business momentum is real, but valuation is the central issue. At $1,152.07, Goldman trades at approximately 3.13 times book value and 3.42 times tangible book value. Our probability-weighted fair value is approximately $920. The current price effectively requires Goldman to sustain an ROE close to 23%—almost equal to the exceptional Q2 result.

  • SWOTstock fair value: approximately $920
  • Reasonable fair-value range: $850–$950
  • Bear scenario: $505
  • Base scenario: $860
  • Bull scenario: $1,390
  • Verdict: Excellent operating performance, but limited margin of safety at the post-earnings price

Quarter Recap

Goldman Sachs reported net revenue of $20.34 billion and net earnings of $6.63 billion for the quarter ended June 30, 2026. Diluted EPS reached $20.98, compared with $10.91 a year earlier and $17.55 in the first quarter.

Profitability improved substantially. Annualized ROE reached 23.5%, annualized ROTE reached 25.5%, and the efficiency ratio improved to 57.4%. Revenue grew faster than expenses, producing a 73% increase in pre-tax earnings.

The market reaction reflected the scale of that improvement. Goldman closed at $1,045.91 before the release and $1,140 afterward, a gain of 9.0%. This article does not use analyst estimates or news commentary to explain the move. The interpretation is based on Goldman’s official results: earnings increased sharply, the improvement was broad, and several indicators pointed to continued activity beyond the quarter.

The important question for investors is no longer whether Q2 was strong. It is whether the quarter represents a new sustainable level of profitability or a particularly favorable point in the capital-markets cycle.

Key Highlights

Goldman’s results were led by Global Banking & Markets, but the strength was not limited to one business.

  • Global Banking & Markets revenue increased 53% to $15.52 billion. The segment produced pre-tax earnings of $7.50 billion and a 27.5% ROE.
  • Investment-banking fees increased 55% to $3.40 billion. Equity underwriting rose 130%, debt underwriting rose 75%, and the investment-banking backlog increased sequentially.
  • FICC revenue increased 32% to $4.59 billion. Financing revenue reached a record, supported by mortgages and structured lending.
  • Equities revenue increased 72% to a record $7.42 billion. Both intermediation and financing reached record levels.
  • Asset & Wealth Management revenue increased 20% to $4.60 billion. Management and other fees reached a record $3.36 billion.
  • Assets under supervision reached a record $4.04 trillion. Goldman recorded $230 billion of total net inflows and its 34th consecutive quarter of long-term fee-based inflows.
  • Alternative-investment fundraising reached a quarterly record of $59 billion. Alternative assets under supervision increased to $459 billion.
  • Operating expenses increased 26% to $11.67 billion. Although substantial, this remained below the 39% increase in revenue.
  • Credit-loss provisions declined to $102 million. This supported earnings but should not automatically be treated as a permanent run rate.
  • Goldman returned $5.36 billion to common shareholders. The company repurchased $4.00 billion of shares and increased its quarterly dividend by 11% to $5.00.
  • Book value reached $367.67 per share. Tangible book value was $336.61 per share.

SWOT Analysis

Goldman’s strengths are visible in its franchise breadth, operating leverage and expanding recurring fee base. Its weaknesses are concentrated in the cyclicality of the record results and the premium valuation now assigned to them. The estimated price impacts below describe the potential one-year effect if each factor becomes the dominant incremental driver. They should not be added together because several factors overlap.

Strengths

  • Exceptional profitability and operating leverage: estimated impact +6% to +12%. Q2 ROE reached 23.5%, while revenue growth outpaced expense growth by 13 percentage points.
  • Broad strength across the core franchise: estimated impact +5% to +10%. Investment banking, FICC, Equities and Asset & Wealth Management all expanded.
  • Growing recurring fee base: estimated impact +4% to +8%. Record assets under supervision and 34 consecutive quarters of long-term fee-based inflows improve revenue durability.
  • Strong capital and liquidity: estimated impact +2% to +5%. The standardized CET1 ratio increased to 12.9%, average global core liquid assets reached $555 billion, and the dividend increased.

Weaknesses

  • Dependence on an exceptional Equities quarter: estimated impact −10% to −18%. Equities generated approximately 36% of firmwide revenue and grew 72%.
  • Demanding price-to-book valuation: estimated impact −15% to −30%. The stock trades above three times book value, leaving limited protection if ROE returns to the mid-teens.
  • Limited tangible-book accumulation: estimated impact −3% to −7%. Tangible book value increased only $0.33 sequentially despite $20.98 of EPS, partly because of substantial capital distributions.
  • Residual Platform Solutions weakness: estimated impact −2% to −5%. Revenue declined 64%, and the segment recorded a $48 million pre-tax loss.
  • Pressure on private-banking margins: estimated impact −2% to −4%. Private banking and lending revenue declined 13% as lower Marcus deposit margins offset higher balances.

Opportunities

  • Conversion of the investment-banking backlog: estimated impact +6% to +12%. Higher completed M&A and underwriting activity could extend the earnings recovery.
  • Scaling alternative investments: estimated impact +4% to +9%. Record fundraising and growing alternative assets could produce higher recurring and performance-related fees.
  • Expansion of financing and net-interest income: estimated impact +3% to +7%. Net-interest income increased 27%, while FICC and Equities financing reached record levels.
  • Further efficiency gains: estimated impact +3% to +6%. Continued revenue growth without equivalent fixed-cost expansion could keep the efficiency ratio below 60%.

Threats

  • Capital-markets normalization or economic contraction: estimated impact −15% to −25%. Weaker markets could affect trading, underwriting, M&A, investment gains and managed assets simultaneously.
  • Failure of the backlog to convert: estimated impact −4% to −8%. Goldman warns that backlog transactions may be delayed, modified or abandoned.
  • Regulatory and capital constraints: estimated impact −5% to −12%. The supplementary leverage ratio declined from 4.7% to 4.3%, and higher requirements could restrict balance-sheet growth or capital returns.
  • Credit normalization: estimated impact −5% to −10%. Q2 provisions were unusually low, leaving earnings exposed to higher wholesale, real-estate or consumer-related losses.
  • Premium-priced repurchases: estimated impact −3% to −7%. Goldman repurchased shares at an average $984.57, substantially above reported book value.

Valuation Scenarios

For Goldman, sustainable ROE and book value provide a better valuation foundation than mechanically multiplying one record quarter. We use reported book value of $367.67 and value the company under different assumptions for sustainable ROE, growth and shareholder return requirements.

Bear Scenario — $505

The bear case assumes that Q2 represents a favorable cyclical peak rather than a durable earnings level.

  • Probability: 20%
  • Sustainable ROE: 14%
  • Long-term book-value growth: 3%
  • Required shareholder return: 11%
  • Justified price-to-book ratio: 1.375 times
  • Calculated value: approximately $506
  • Rounded target: $505
  • Change from $1,152.07: approximately −56%

This outcome would be consistent with weaker trading and underwriting activity, slower backlog conversion and a return to mid-teens profitability.

Base Scenario — $860

The base case gives Goldman credit for a structurally improved franchise but normalizes the record Q2 performance.

  • Probability: 55%
  • Sustainable ROE: 18%
  • Long-term book-value growth: 4%
  • Required shareholder return: 10%
  • Justified price-to-book ratio: approximately 2.33 times
  • Calculated value: approximately $858
  • Rounded target: $860
  • Change from $1,152.07: approximately −25%

An 18% sustainable ROE is already a strong assumption. It recognizes the growth of Asset & Wealth Management, financing and recurring fees without assuming that every quarter matches Q2.

Bull Scenario — $1,390

The bull case assumes that Goldman can sustain returns close to its first-half 2026 performance.

  • Probability: 25%
  • Sustainable ROE: 22%
  • Long-term book-value growth: 5%
  • Required shareholder return: 9.5%
  • Justified price-to-book ratio: approximately 3.78 times
  • Calculated value: approximately $1,389
  • Rounded target: $1,390
  • Change from $1,152.07: approximately +21%

This requires continued banking-pipeline conversion, strong trading and financing activity, expanding recurring fees and a market willing to treat the earnings as more durable.

Probability-Weighted Fair Value

Applying the scenario probabilities produces a value of approximately $920 per share:

  • Bear contribution: $505 × 20% = $101
  • Base contribution: $860 × 55% = $473
  • Bull contribution: $1,390 × 25% = $347.50
  • Probability-weighted value: approximately $920

The percentage distinction is important. A $1,152 stock price is approximately 25% above a $920 fair value, but the shares would need to decline approximately 20% to reach that value.

Verdict

Goldman’s Q2 results justify a positive reassessment of the business. The firm generated record revenue, improved operating efficiency, expanded its banking backlog and continued building a larger recurring Asset & Wealth Management franchise. This was not a weak business temporarily rescued by one accounting adjustment.

Nevertheless, the post-earnings price already assumes an unusually favorable outcome. At $1,152.07, Goldman trades at approximately 3.13 times book value, 3.42 times tangible book value and 17.8 times trailing EPS.

Using a 10% required return and 4% long-term growth, the current price implies sustainable ROE of approximately 22.8%. That is almost identical to Q2’s 23.5% result. Investors are therefore being asked to treat an exceptional quarter as something close to Goldman’s durable earning power.

Our final fair value is $920 per share, with a reasonable range of $850 to $950. That valuation gives Goldman a substantial premium for franchise quality and improved profitability. It does not treat the company as an ordinary bank or assume a return to book value.

For a value investor, $920 represents fair value—not a fat-pitch price. At the current price, Goldman may continue rising if the bull case develops, but the margin of safety is limited and the downside becomes material if ROE normalizes.

Call to Action

Would you pay more than three times book value for Goldman Sachs if maintaining that valuation requires a sustainable ROE close to 23%?

The next quarters should answer three questions:

  • Does the investment-banking backlog convert into completed transactions and revenue?
  • Can Equities and financing remain strong without another exceptional market environment?
  • Can Asset & Wealth Management continue expanding recurring fees fast enough to reduce Goldman’s earnings cyclicality?

Follow SWOTstock for earnings analysis, independent valuation scenarios and updates as those assumptions are tested.

Disclaimer

This article is for informational and educational purposes only and does not constitute investment advice, a recommendation or an offer to buy or sell securities. The valuation scenarios depend on assumptions about sustainable profitability, growth and required returns. Actual results may differ materially. Investors should conduct their own research and consider their financial objectives, risk tolerance and circumstances before making investment decisions.

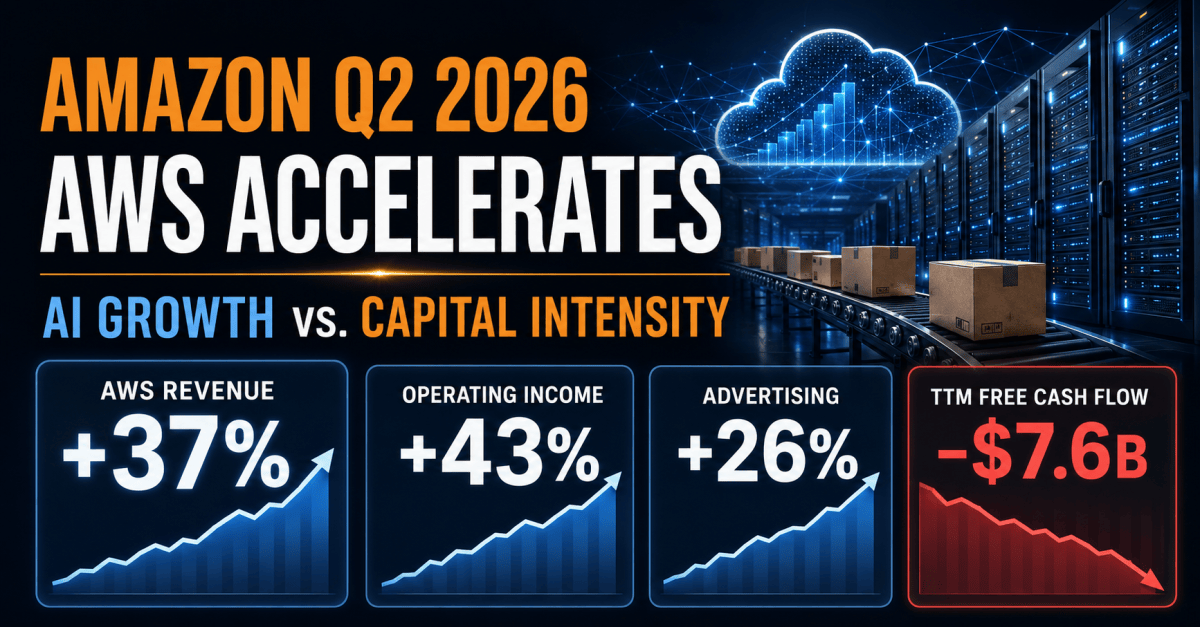
Amazon Q1 2026 Earnings: AI Growth Is Real — But So Is the Cost

Amazon’s Q1 2026 report highlights strong AWS growth (28% YoY) and improved operating income, solidifying its role in AI infrastructure. However, increased capital expenditures have compressed free cash flow, raising investor concerns. Stock valuation is near fair value, with future returns dependent on successful AI monetization. Caution remains essential.

TL;DR Summary

Amazon (AMZN:NASDAQ) delivered a strong Q1 2026 with accelerating AWS growth and expanding operating income, reinforcing its position as a core AI infrastructure player. However, massive AI-driven capex has compressed free cash flow, creating a key tension for investors. The stock is trading near fair value, with upside dependent on whether AI investments translate into durable returns.


Quarter Recap

Amazon reported a solid Q1 2026, with revenue growing 17% year-over-year to $181.5 billion. The standout was AWS, which accelerated to 28% growth, marking a clear inflection after several quarters of slower expansion.

Operating income increased significantly, reflecting both stronger cloud profitability and continued efficiency improvements in the retail segment. However, net income was boosted by a large non-operating gain related to Amazon’s investment in Anthropic, which means headline earnings should be interpreted with caution.

At the same time, Amazon sharply increased capital expenditures, particularly in AI infrastructure, which led to free cash flow falling close to breakeven despite strong operating performance.


Key Highlights

Amazon’s quarter reinforces a structural shift in its business model. AWS and advertising continue to scale as high-margin engines, while retail is becoming more efficient and less of a drag on profitability.

The most important signal is AWS re-acceleration. A 28% growth rate suggests enterprise demand is returning, particularly driven by AI workloads. This positions Amazon firmly in the AI infrastructure race alongside its largest competitors.

However, the cost of that growth is rising. The surge in capital expenditure reflects an aggressive push to build out data centers, chips, and AI capacity. This creates a near-term tradeoff between growth and cash generation that investors cannot ignore.


SWOT Analysis

Amazon’s current positioning is defined by a simple dynamic: strong growth drivers are clearly visible, but the path to monetizing those drivers efficiently is still uncertain.

Strengths

  • AWS re-acceleration (28% YoY growth) confirms strong AI-driven demand
    Estimated price impact: +6% to +10%
  • High-margin businesses (AWS + Advertising) continue to scale, improving overall mix
    Estimated price impact: +4% to +7%
  • Operating income expansion shows improving efficiency across segments
    Estimated price impact: +3% to +5%

Weaknesses

  • Free cash flow is compressed due to heavy AI-related capital expenditure
    Estimated price impact: -5% to -8%
  • Earnings quality is partially distorted by non-operating investment gains
    Estimated price impact: -2% to -4%

Opportunities

  • AI monetization across AWS and enterprise services could unlock long-term pricing power
    Estimated price impact: +8% to +15%
  • Continued logistics and retail efficiency improvements can drive margin expansion
    Estimated price impact: +3% to +6%

Threats

  • AI infrastructure arms race could lead to overinvestment and margin pressure
    Estimated price impact: -6% to -10%
  • AWS growth remains exposed to enterprise spending cycles
    Estimated price impact: -3% to -6%

Valuation Scenarios

Amazon’s valuation now hinges on whether its aggressive AI investment cycle will translate into sustained earnings growth or prolonged margin pressure.

Bear Case

AWS growth slows and AI investments fail to generate near-term returns, while margins come under pressure from continued infrastructure spending.

Estimated price: $220–$240


Base Case

AWS maintains strong growth, AI investments begin to show early monetization, and margins expand gradually over time.

Estimated price: $260–$290


Bull Case

AI demand accelerates further, AWS growth strengthens, and Amazon achieves meaningful operating leverage from its high-margin segments.

Estimated price: $300–$340


Probability-Weighted Fair Value

Combining these scenarios, the estimated fair value is approximately $275, placing the current price near fair value with limited margin of safety.


Verdict

Amazon is no longer just an e-commerce and cloud company — it is now firmly positioned as an AI infrastructure platform. The growth story is real, but so is the cost of building that future.

At current levels, the stock reflects cautious optimism. Investors are willing to believe in the long-term AI opportunity, but they are waiting for clearer evidence that these investments will translate into sustainable cash flow.

This is not a deep value opportunity. It is a conviction-driven growth investment that requires confidence in management’s ability to convert scale into returns.


Call to Action

If you believe Amazon can successfully monetize its AI investments, the current valuation offers a reasonable entry point. If you are concerned about capital efficiency and cash flow, it may be worth waiting for clearer signs of return on investment.

Follow SWOTstock for more structured, investor-focused earnings analysis grounded in official company data.


Disclaimer

This analysis is for informational purposes only and does not constitute financial advice. Always conduct your own research and consult with a licensed financial advisor before making investment decisions.