JPMorgan Q4 2025 Earnings — When a Fortress Becomes the Benchmark

JPMorgan Chase reported solid Q4 results, showcasing strong underlying profitability despite reserve increases. Its resilient earnings and capital strength position it as a benchmark in the financial sector, although expenses and regulatory risks loom. While the stock is no longer cheap, it remains attractive for long-term investors seeking stability and steady returns.

TL;DR Summary

JPMorgan Chase (JPM:NYSE) delivered another strong quarter, reinforcing its position as the most durable banking franchise in the U.S. While headline earnings were affected by higher reserves, underlying profitability, capital strength, and return metrics remain exceptional. At around $313 per share, the stock is no longer cheap — but it is not mispriced. JPM is now valued as a benchmark financial compounder, where upside depends on regime stability rather than re-rating.


Quarter Recap

JPMorgan Chase reported solid Q4 results that once again highlighted the strength of its franchise. Adjusted earnings remained resilient despite reserve builds tied to the Apple Card portfolio, while net interest income continued to demonstrate durability even as rate expectations evolved. Markets and trading provided meaningful support, offsetting continued softness in investment banking fees.

Management reiterated confidence in the resilience of the U.S. consumer and emphasized ongoing productivity gains from technology and AI investments. At the same time, expense growth and regulatory uncertainty remained important considerations heading into 2026.


Key Highlights

  • Adjusted earnings remained strong despite higher reserves
  • Net interest income continued to show structural resilience
  • Trading and markets performance offset weaker investment banking activity
  • Capital levels remained robust, preserving flexibility for buybacks and dividends
  • Regulatory and policy risks emerged as a more visible medium-term consideration

SWOT Analysis

JPMorgan’s Q4 results reinforce a familiar conclusion: this is not simply the strongest bank in the system — it is increasingly the reference point by which other financial institutions are judged.

Strengths

JPMorgan continues to generate industry-leading returns, with ROE and ROTCE far exceeding peers. Its fortress balance sheet, diversified revenue base, and disciplined risk management provide earnings durability across cycles. Technology and AI investments are already contributing to efficiency and control, reinforcing long-term competitiveness.

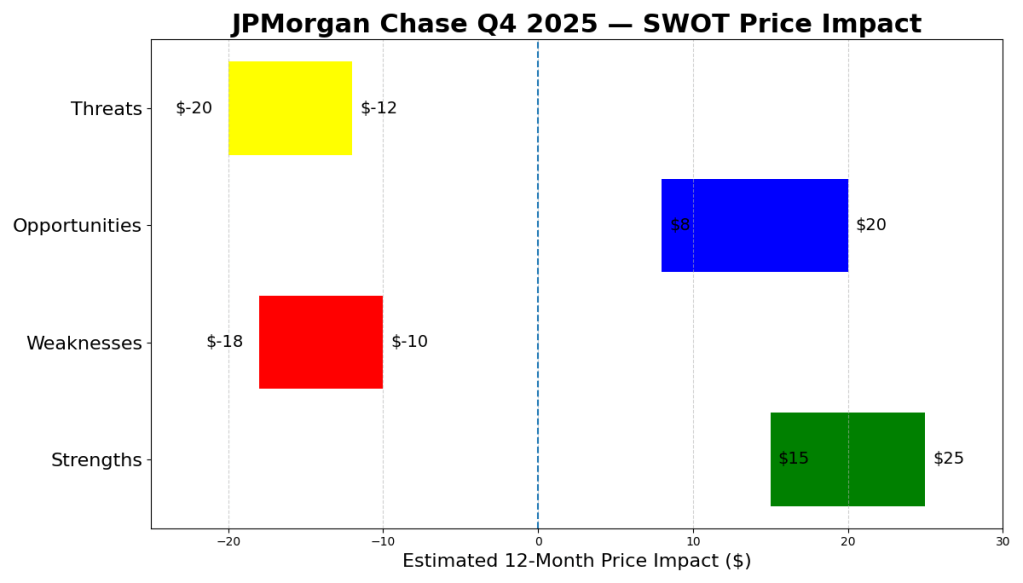
Estimated price impact: +$15 to +$25

Weaknesses

Rising expenses and reserve builds weighed on reported earnings, and investment banking activity remains below cycle peaks. Deposit costs have risen faster than loan yields, signaling that net interest income growth may plateau rather than accelerate.

Estimated price impact: −$10 to −$18

Opportunities

Continued share gains in payments, wealth management, and consumer banking offer long-term growth optionality. Efficiency gains from AI and automation could sustain mid-single-digit EPS growth through 2026, while capital returns remain a powerful support for shareholder value.

Estimated price impact: +$8 to +$20

Threats

Regulatory intervention — particularly around consumer credit — represents the most significant structural risk. Basel III Endgame requirements and macro volatility could also pressure returns if conditions deteriorate meaningfully.

Estimated price impact: −$12 to −$20

Horizontal bar chart showing JPMorgan Chase Q4 2025 SWOT price impacts over the next 12 months. Strengths add approximately $15–25, Opportunities add $8–20, while Weaknesses subtract $10–18 and Threats subtract $12–20, highlighting the balance between fortress fundamentals and regulatory risk.

Valuation Scenarios

JPMorgan should not be valued using a generic mid-cycle bank framework. Its sustained high returns, capital strength, and systemic importance justify a premium valuation anchored to returns on equity rather than mean reversion.

Bear Scenario

This scenario assumes a meaningful regulatory or policy shock that compresses consumer banking profitability and forces a re-rating toward lower multiples.

  • Assumptions: Credit-card regulation intensifies; ROE compresses; valuation reverts toward traditional bank levels
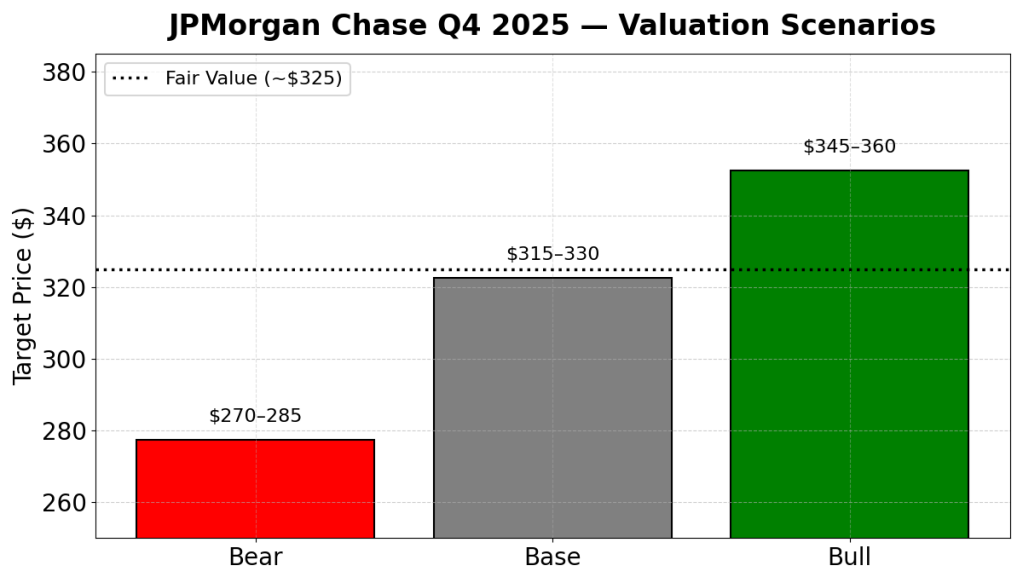
  • Implied value: ~$270–285

Base Scenario

This reflects the current market view: JPMorgan sustains high-teens returns, credit normalizes gradually, and regulation remains manageable.

  • Assumptions: Stable ROE near 18–20%; continued capital returns; no structural disruption
  • Implied value: ~$315–330

Bull Scenario

This scenario assumes continued earnings durability, strong capital returns, and benign regulation that allows JPM to further differentiate itself from peers.

  • Assumptions: EPS growth supported by efficiency gains and capital return; premium valuation sustained
  • Implied value: ~$345–360

Probability-Weighted Fair Value

Taking these scenarios together, JPMorgan’s fair value clusters around:

~$320–330 per share

Valuation scenarios chart for JPMorgan Chase Q4 2025 showing Bear case at $270–285, Base case at $315–330, and Bull case at $345–360, with a dashed fair-value line around $325 reflecting the market-implied structural valuation regime.

Verdict

JPMorgan has evolved beyond being simply a fortress bank. It is now a benchmark asset within financials — valued not for upside surprise, but for durability, discipline, and resilience.

At current levels, the stock offers limited re-rating potential but remains highly attractive as a long-term compounder for investors seeking stability, capital preservation, and steady returns. The primary risk is no longer execution, but regime risk: regulatory or political shifts that could challenge the premium valuation.

For long-term value investors, JPMorgan remains a cornerstone holding — not because it is cheap, but because few institutions can match its consistency when conditions become uncertain.


Call to Action

If you hold JPMorgan, the question is no longer whether it is well run — that is already proven. The real question is whether its valuation regime remains intact. For investors building resilient portfolios, this remains one of the highest-quality financial assets available.


Disclaimer

This analysis is for informational purposes only and does not constitute investment advice. Always conduct your own research and consider your financial situation before making investment decisions.

Citigroup Q4 2025: Execution Is Improving, But the Valuation Still Depends on Delivery

Citigroup’s Q4 2025 results indicate improvement in core businesses despite profitability challenges due to restructuring costs. While investment banking fees rebounded and net interest income rose, returns on tangible equity remain below targets. The stock, anchored to tangible book value, offers potential upside if management executes consistently, appealing to patient value investors.

TL;DR Summary

Citigroup’s (NYSE: C) Q4 2025 results show real progress in core businesses like Services and Banking, but reported returns are still weighed down by restructuring costs and one-time items. The stock remains anchored to tangible book value, making this a classic execution-driven value story. Upside exists if management delivers on its 10–11% RoTCE target, but patience is required.


Quarter Recap

Citigroup reported Q4 2025 earnings that reflect a bank still in transition. Reported profitability declined year over year due largely to a Russia-related exit charge, but underlying operating trends were more constructive. Revenue held up across key businesses, investment banking activity rebounded sharply, and management emphasized that major geopolitical overhangs are now largely behind the company.


Key Highlights

  • Net income of approximately $2.47 billion, impacted by a sizable one-time Russia exit loss
  • Reported EPS of $1.19, with underlying performance stronger when adjusting for notable items
  • Investment banking fees rose sharply year over year, signaling a recovery in deal activity
  • Net interest income increased year over year, supported by higher average rates
  • CET1 capital ratio of 13.2%, comfortably above regulatory requirements
  • Tangible book value per share of $97.06 provides a clear valuation anchor

SWOT Analysis

Citigroup’s investment case remains centered on whether management can convert improving operating trends into sustainably higher returns on tangible equity. The quarter reinforced both the opportunity and the risks embedded in that thesis.

Strengths

  • Services and institutional businesses continue to scale, improving the quality and durability of earnings (estimated price impact: +4% to +10%)
  • Strong rebound in investment banking fees highlights Citi’s relevance in large, complex transactions (+3% to +8%)
  • Capital strength and ongoing share buybacks provide downside support and optionality (+4% to +9%)
  • Clear tangible book value base gives value investors a concrete reference point (+2% to +6%)

Weaknesses

  • Reported RoTCE remains well below management’s 10–11% target, limiting valuation re-rating (−6% to −12%)
  • Expense growth and a high efficiency ratio continue to pressure near-term profitability (−4% to −10%)
  • Earnings remain vulnerable to one-time items during the restructuring phase (−2% to −6%)

Opportunities

  • Achieving the stated RoTCE target could justify a meaningful re-rating toward tangible book value or above (+8% to +18%)
  • Operating leverage from simplification and productivity initiatives could improve margins over time (+4% to +12%)
  • Excess capital above regulatory requirements supports continued capital return (+3% to +9%)

Threats

  • A turn in the credit cycle could quickly erode earnings and capital flexibility (−6% to −15%)
  • Rate and macro sensitivity remain meaningful, particularly for net interest income (−3% to −10%)
  • Execution risk persists if cost reductions fail to materialize as planned (−5% to −12%)
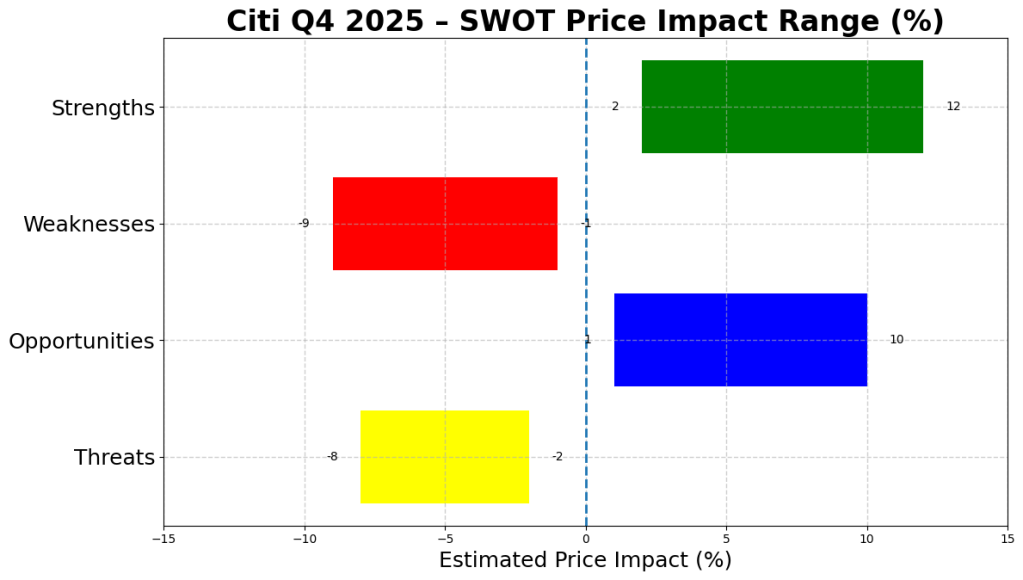
Citigroup Q4 2025 SWOT price impact chart showing estimated percentage upside and downside from strengths, weaknesses, opportunities, and threats for value investors.
Citigroup Q4 2025 SWOT price impact range. Estimated upside and downside drivers based on management commentary and valuation sensitivity around tangible book value.

Valuation Scenarios

For Citi, valuation is best framed using price-to-tangible book value, as returns on tangible equity are the primary driver of long-term multiple expansion. With TBVPS at $97.06, the range of outcomes depends largely on execution.

Bear Case

  • Assumes sub-par returns persist and credit or expense pressures rise
  • Valuation at ~0.8× tangible book
  • Implied value: ~$78

Base Case

  • Assumes steady progress toward management’s RoTCE target without full re-rating
  • Valuation at ~1.0× tangible book
  • Implied value: ~$97

Bull Case

  • Assumes credible delivery of 10–11% RoTCE with visible operating leverage
  • Valuation at ~1.2× tangible book
  • Implied value: ~$116

Probability-weighted fair value: approximately $95

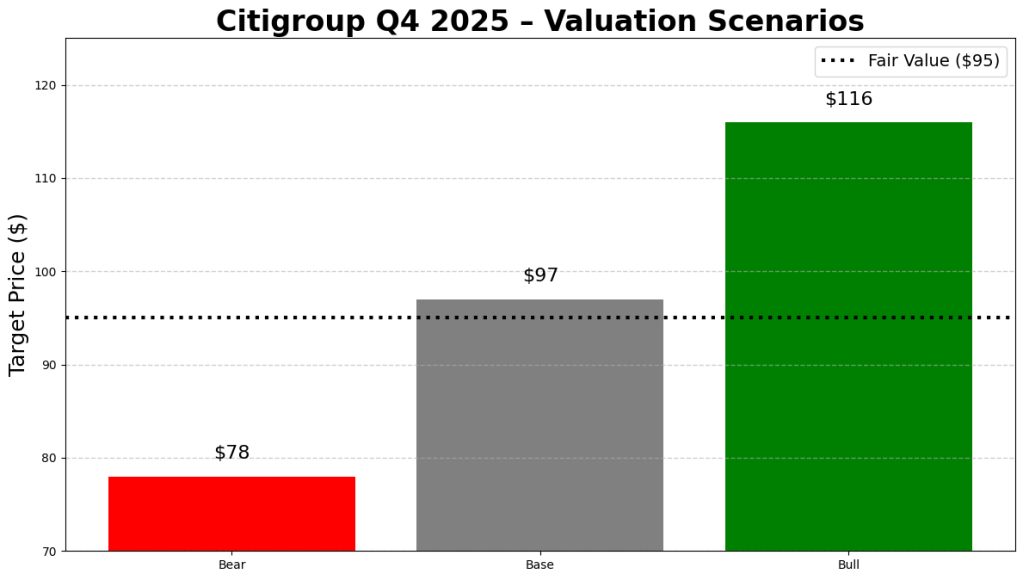
Citigroup Q4 2025 valuation scenarios chart showing bear, base, and bull target prices with a dashed fair value line for value investors.
Citigroup Q4 2025 valuation scenarios. Bear, base, and bull price targets derived from tangible book value multiples and return-on-tangible-equity assumptions, with probability-weighted fair value highlighted.

Verdict

Citigroup remains a value investor’s execution bet. The stock is no longer distressed, but it is not yet priced for success. If management delivers on returns and expense discipline, today’s valuation leaves room for upside. If execution stalls, the stock risks remaining range-bound around tangible book value. For patient investors, Citi offers asymmetry — but not certainty.


Call to Action

If you’re tracking large U.S. banks from a value perspective, follow SWOTstock for earnings-driven breakdowns that focus on fundamentals, valuation discipline, and execution — not hype.


Disclaimer

This article is for informational purposes only and does not constitute investment advice. All analysis is based on publicly available company disclosures and reflects estimates and opinions at the time of writing. Investors should conduct their own research before making investment decisions.


Bank of America Q3 2025 — “Steady Hands in a Choppy Cycle”

Bank of America demonstrated strong Q3 2025 results with an EPS of $1.06 and a net interest income of $15.2 billion, alongside a 43% rise in investment-banking fees. Management’s increased Q4 guidance reflects confidence. The bank’s stability positions it as a reliable choice for value investors amid economic uncertainty.

TL;DR

Bank of America reported a steady and resilient Q3 2025: EPS came in at $1.06, net interest income rose to $15.2 billion, and investment-banking fees jumped 43%. Management also raised Q4 NII guidance, signaling confidence heading into year-end. After the release, the stock traded roughly 2–3% higher, reflecting a market that values stability in a choppy macro environment. For DIY value investors, this quarter underscores BofA’s role as a dividend-reliable, moderately undervalued financial anchor rather than a high-beta trade.


Quarter Recap

Bank of America delivered a steady and confident performance in Q3 2025, leaning more on disciplined execution than dramatic surprises. Net income reached $8.5 billion, translating to $1.06 per share, comfortably above expectations and supported by $15.2 billion in net interest income that remained resilient despite shifting rate dynamics. Management emphasized that positive operating leverage reflected tighter cost control and continued investment in risk management and technology. Capital markets activity added a welcome boost, with investment-banking fees rising 43% as dealmaking and underwriting improved from last year’s lows. Importantly for long-term investors, the bank’s CET1 ratio stayed above 12%, reinforcing its capacity to maintain dividends and pursue selective buybacks even in a more uncertain macro backdrop. Overall, the quarter underscored BofA’s ability to produce stable, repeatable earnings at a time when many peers are navigating more uneven conditions.


Key Highlights

  • EPS: $1.06, above internal targets and analyst expectations.
  • Net Interest Income: $15.2B, maintaining upward momentum.
  • Investment-Banking Fees: +43% YoY, continued rebound in capital markets.
  • Operating Leverage: Positive, reflecting disciplined expense control.
  • Credit Costs: Stable, no significant deterioration in consumer or commercial books.
  • Capital Position: CET1 above 12%, supporting sustained shareholder returns.
  • Guidance: Q4 NII raised to $15.6–15.7B, signaling management confidence.

SWOT Analysis

Strengths (+3% → +7%)

• Strong NII performance and EPS beat

• Well-managed expenses and positive operating leverage

• Dividend raised earlier this year, supported by capital strength

Weaknesses (–5% → –2%)

• Slower loan growth compared to peers

• Slight margin compression in wealth management

• Tech and compliance investments increasing non-interest expense

Opportunities (+4% → +10%)

• Investment-banking recovery (+43% YoY)

• Stable credit trends with room for normalization upside

• Rate-cycle normalization in 2026 may boost loan demand

Threats (–10% → –5%)

• CRE and credit-card segments remain watch-list risks

• Potential capital-rule tightening limiting buybacks

• Prolonged macro uncertainty affecting NII trajectory

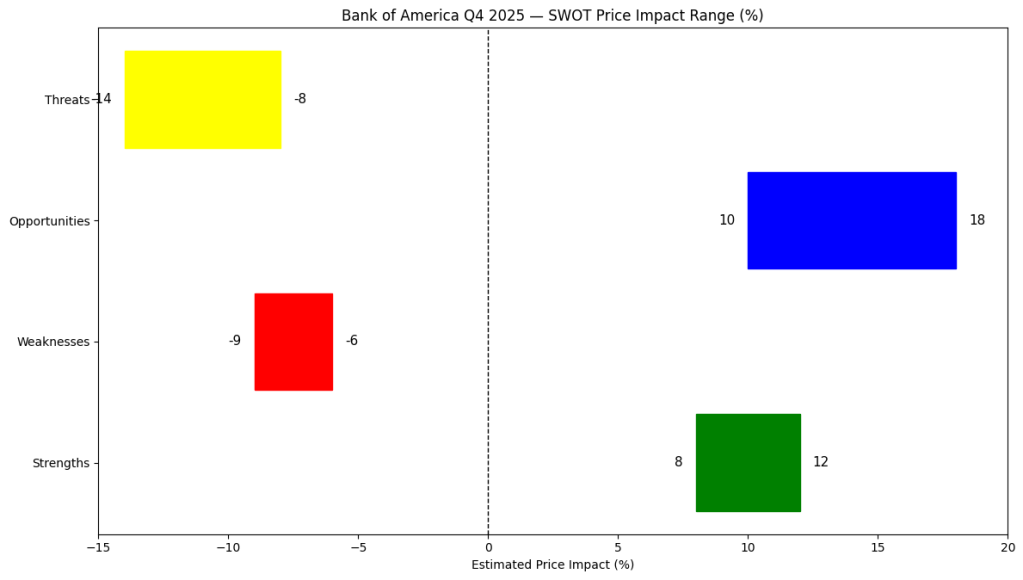
Horizontal bar chart showing Bank of America Q3 2025 SWOT price impact ranges. Strengths (+3 to +7 %), Weaknesses (–5 to –2 %), Opportunities (+4 to +10 %), and Threats (–10 to –5 %). The chart uses green for strengths, red for weaknesses, blue for opportunities, and yellow for threats, with a dashed vertical line at zero indicating neutral impact.

Valuation Scenarios (12-Month Outlook)

Using official Q3 performance, NII guidance, and credit commentary:

Bull Case – $56 (+15%)

• Sustained NII strength

• Continued recovery in investment banking

• Flat credit losses into 2026

Base Case – $51.3 (+5%)

• Stable NII

• Moderate fee growth

• Expense discipline maintained

Bear Case – $44 (–10%)

• Margin compression from declining rates

• Credit costs rise toward the historical mean

• CRE pockets worsen

Probability-Weighted Fair Value:

(0.3 x 56) + (0.5 x 51.3) + (0.2 x 44) = approx. $51.1

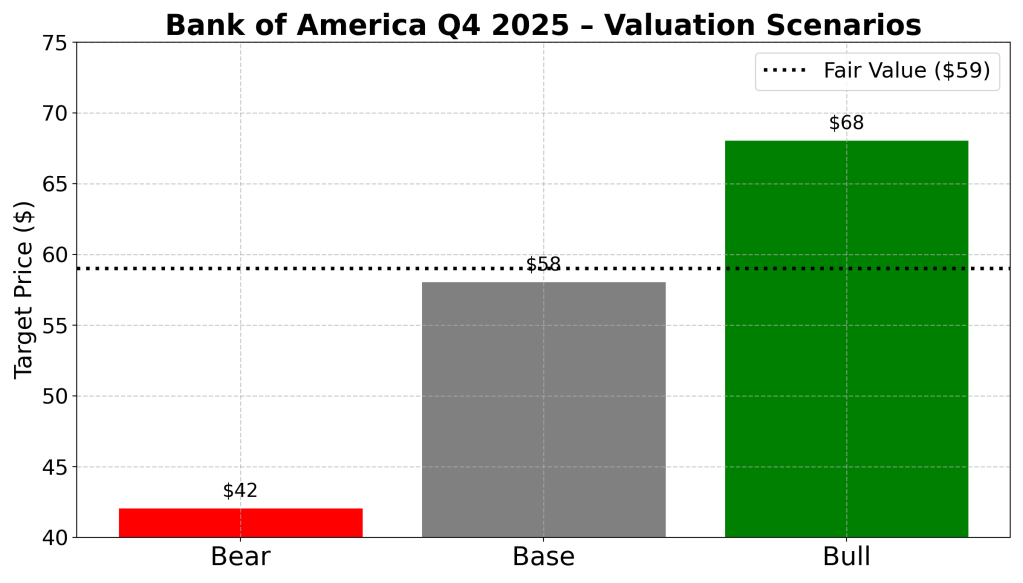
Vertical bar chart illustrating Bank of America Q3 2025 valuation scenarios. Bear case $44 (20 %), Base case $51.3 (50 %), and Bull case $56 (30 %). A dashed horizontal line marks the calculated fair value at about $51 per share. Bars are color-coded red, gray, and green respectively.

Verdict

Bank of America continues to deliver what value-focused investors want: predictable earnings, conservative capital management, and a stable dividend.

This quarter didn’t redefine the company—but it didn’t need to.

Instead, it reinforced that BofA’s risk-reward profile is built on durability rather than excitement.

At around $50–51 post-earnings, shares sit close to their $51 fair value, leaving modest upside but strong downside support. For long-term investors comfortable with financial-cycle volatility, BofA remains a hold with opportunistic accumulation on dips below $48.


Call to Action

If you find this style of earnings-driven, valuation-based analysis helpful, follow SWOTstock for more breakdowns across banks, tech, and industrials—always grounded in official filings and management commentary.


Disclaimer

This article is for informational and educational purposes only. It does not constitute investment advice or a recommendation to buy or sell any securities. All analysis is based solely on Bank of America’s official Q3 2025 financial results and publicly available management commentary. Investors should conduct their own research or consult a licensed advisor before making investment decisions.