Vertiv Q4 2025 Earnings: AI Infrastructure Momentum Is Real — But Is the Stock Ahead of It?

Vertiv reported strong Q4 2025 results with 23% revenue growth, a 252% increase in orders, and a $15 billion backlog, demonstrating solid AI infrastructure demand. Despite rising expectations and high valuation sensitivity, the company’s operational momentum and expanding margins present a favorable risk-reward profile for growth investors at prices around $150.

TL;DR Summary

Vertiv (VRT:NYSE) delivered a strong Q4 2025 with 23% revenue growth, massive order acceleration (+252% YoY), and a $15B backlog that reinforces AI infrastructure demand. Margins expanded and free cash flow remained robust.

However, expectations are now extremely high.

Using management’s official 2026 EPS guidance of ~$6.02 and a disciplined 25x multiple, fair value sits near $150 per share. Investors must now decide: is Vertiv an AI compounder — or an expectations trap?


Quarter Recap

Vertiv closed FY2025 with clear operational momentum.

Q4 net sales reached $2.88B, up roughly 23% year-over-year. Adjusted EPS came in at $1.36, while GAAP EPS was $1.14. The key driver was demand — not cost cutting.

Organic orders surged approximately +252% YoY, pushing backlog to nearly $15B. That backlog is critical. It provides visibility into 2026 and reflects hyperscaler and AI-related infrastructure demand.

Full-year 2025 revenue reached $10.23B, and adjusted EPS was $4.20. Operating cash flow exceeded $2.1B, and adjusted free cash flow totaled $1.89B.

Balance sheet leverage remains modest at approximately 0.5x net leverage.

Management guided for 2026:

  • Revenue: $13.25B – $13.75B
  • Adjusted EPS: $5.97 – $6.07
  • Operating margin: 22–23%
  • Free cash flow: $2.1B – $2.3B

This implies continued double-digit top-line growth and ~40%+ earnings growth at midpoint.


Key Highlights

• Revenue growth remains strong at 23% YoY

• Orders exploded +252% YoY

• Book-to-bill near 2.9x

• Backlog ~$15B

• Adjusted operating margin 23.2%

• 2026 EPS guidance midpoint ~$6.02

The real story is demand visibility, not just quarterly earnings.
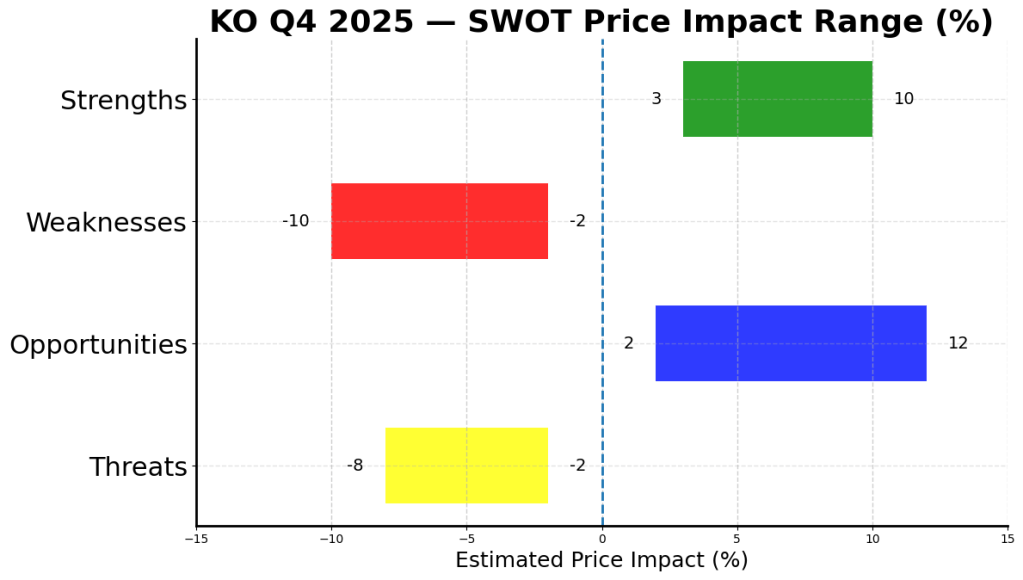
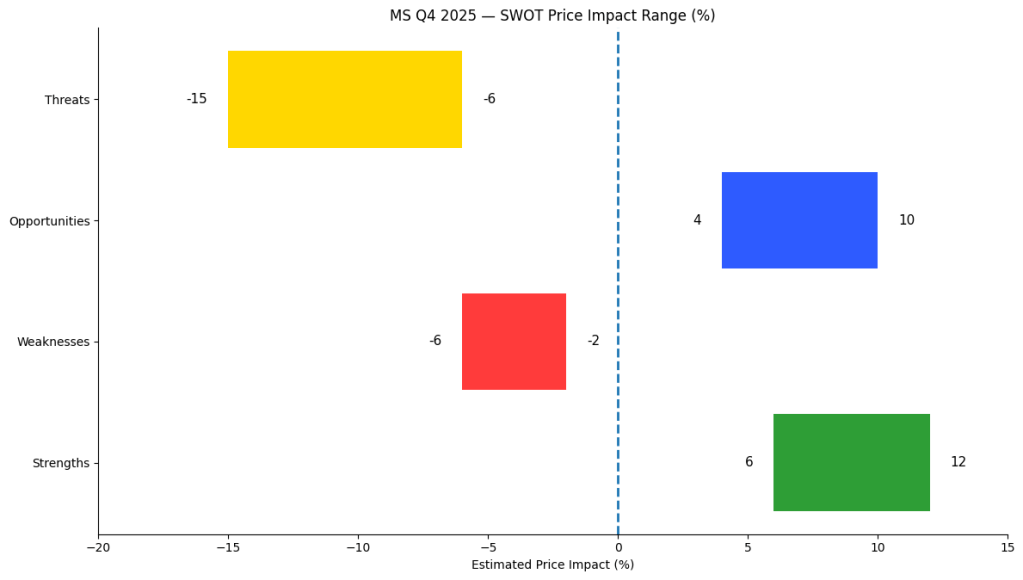

SWOT Analysis

Vertiv is no longer being evaluated as a recovery industrial. It is being priced as a structural AI infrastructure enabler. That changes the risk profile entirely.
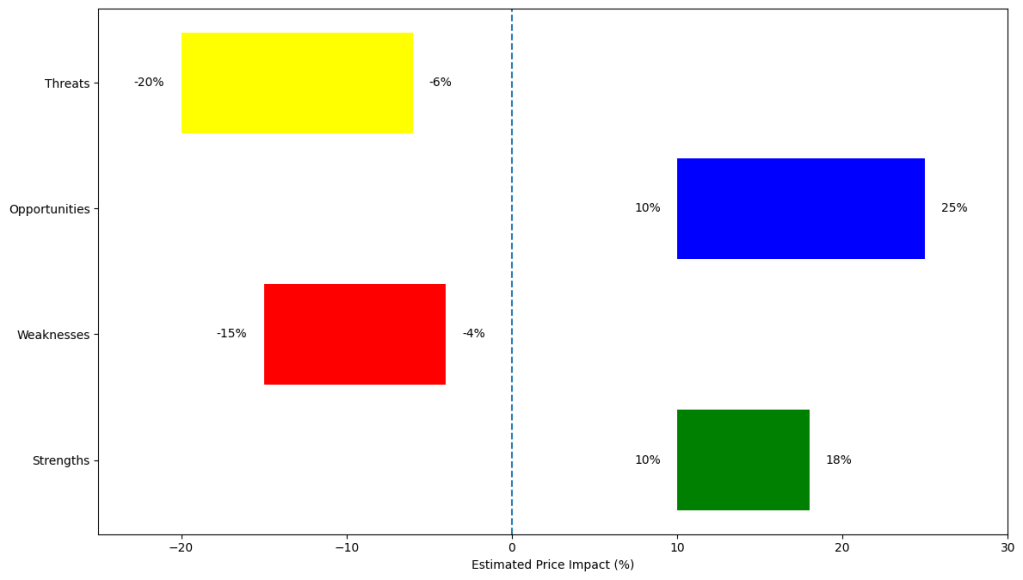
Strengths

• Massive order acceleration and backlog visibility

Estimated price impact: +10% to +18%

• Margin expansion and operational leverage

Estimated price impact: +6% to +10%

• Strong free cash flow and low leverage

Estimated price impact: +4% to +8%

Weaknesses

• GAAP EPS slight miss vs expectations

Estimated price impact: –4% to –7%

• High embedded expectations in valuation

Estimated price impact: –8% to –15% if growth moderates

Opportunities

• AI data-center density shift (liquid cooling, high power racks)

Estimated price impact: +15% to +25% over 12–24 months

• 2026 guidance execution driving multiple support

Estimated price impact: +10% to +20%

Threats

• Hyperscaler capex cyclicality

Estimated price impact: –12% to –20%

• Competitive margin pressure

Estimated price impact: –6% to –12%
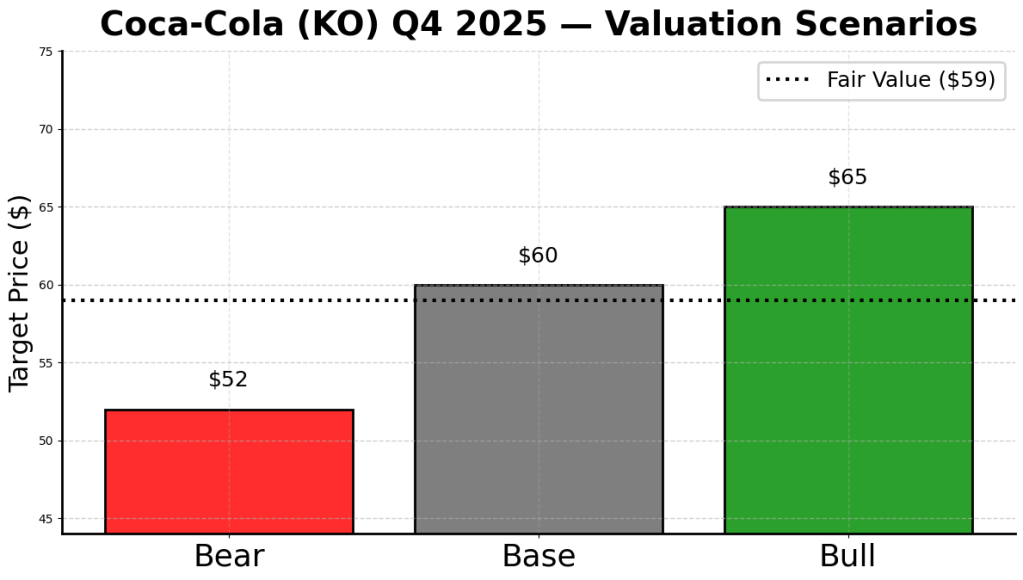
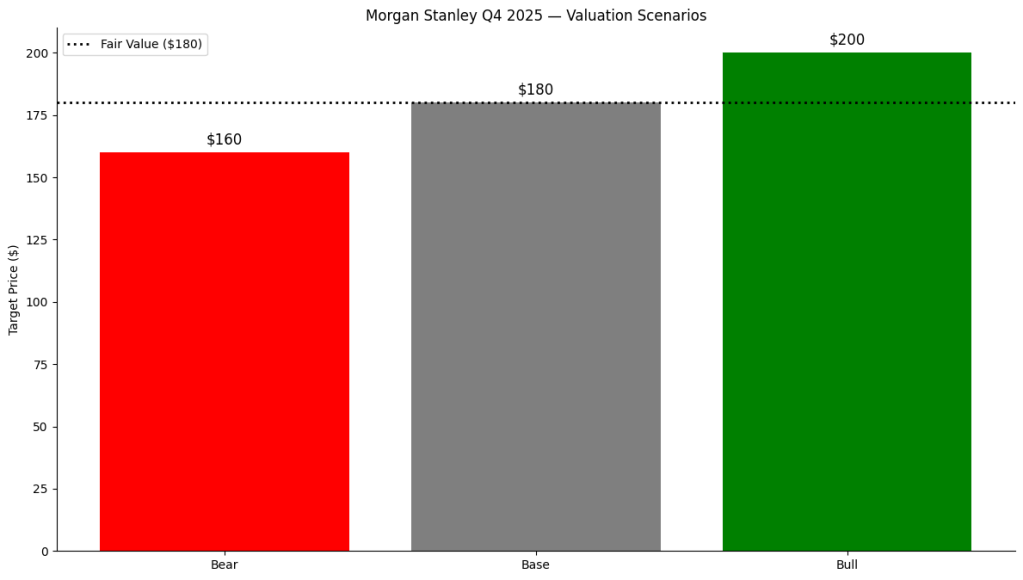
Horizontal SWOT price impact chart for Vertiv Q4 2025 earnings showing estimated stock price impact ranges: Strengths +10% to +18%, Opportunities +10% to +25%, Weaknesses –15% to –4%, and Threats –20% to –6%, with X-axis ranging from –25% to +30%.
Vertiv Q4 2025 SWOT analysis showing estimated price impact ranges across strengths, weaknesses, opportunities, and threats, reflecting AI infrastructure demand, backlog strength, and valuation sensitivity.

Valuation Scenarios

Vertiv guided to approximately $6.02 adjusted EPS for FY2026. Valuation sensitivity now revolves around multiple sustainability.
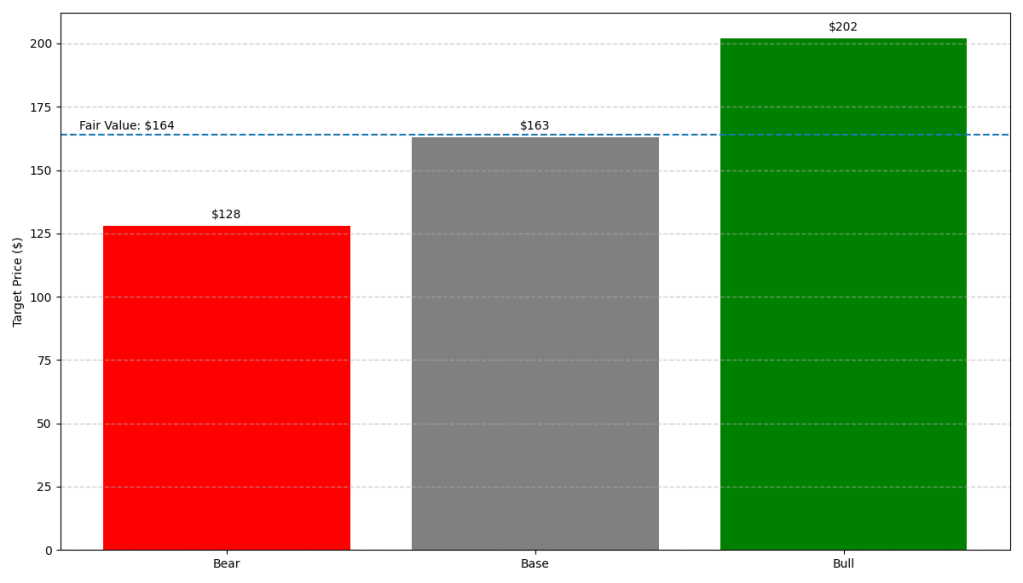
Bear Case

EPS: $5.80

Multiple: 22x

Price Target: $128

Base Case

EPS: $6.02

Multiple: 27x

Price Target: $163

Bull Case

EPS: $6.30

Multiple: 32x

Price Target: $202

Probability-Weighted Fair Value

Fair value ≈ $164

Disciplined fair value using only management guidance and a conservative 25x multiple: ~$150

Vertical valuation scenarios chart for Vertiv Q4 2025 earnings showing Bear case price target of $128, Base case $163, Bull case $202, with a dashed fair value line at $164.
Vertiv Q4 2025 valuation scenarios illustrating Bear ($128), Base ($163), and Bull ($202) price targets based on 2026 EPS guidance, with a probability-weighted fair value of approximately $164.

Verdict

Vertiv is executing.

Demand is real. Backlog is strong. Margins are expanding.

The risk is no longer operational — it’s valuation compression if AI capex momentum slows or if execution stumbles even slightly.

At prices near or below $150, the stock offers a reasonable risk-reward profile for growth investors.

Above that range, it becomes increasingly expectation-driven.


Call to Action

If you found this breakdown helpful, follow SWOTstock for disciplined earnings analysis that separates fundamentals from narrative.

We focus on what the numbers say — not what the hype suggests.


Disclaimer

This analysis is for informational purposes only and does not constitute financial advice. Always conduct your own research before making investment decisions.


Coca-Cola (KO) Q4 2025 Earnings: Steady Compounder or Fully Priced Defensive?

Coca-Cola reported stable Q4 and full-year 2025 results, with modest revenue growth and solid EPS. Guidance for 2026 points to mid-single-digit revenue growth and high-single-digit EPS growth. Valuation remains crucial, with fair value estimated between $60–$64. Investors must weigh the stock’s durability against its premium pricing.

TL;DR Summary

Coca-Cola delivered stable Q4 and full-year 2025 results, but nothing that changes the long-term thesis. Revenue slightly missed expectations, EPS was solid, and 2026 guidance points to mid-single-digit organic growth and high-single-digit EPS growth.

For DIY value investors, this remains a quality compounder — but valuation discipline matters. My fair value estimate sits around $60–$64, suggesting limited upside unless growth accelerates.


Quarter Recap

The Coca-Cola Company reported Q4 and full-year 2025 earnings on February 10, 2026.

Key takeaways from the quarter:

  • Q4 revenue grew modestly year-over-year but slightly missed consensus expectations
  • Global unit case volume increased ~1%
  • Net income rose modestly, reflecting stable margins
  • Full-year organic revenue growth was around ~5%
  • 2026 guidance calls for ~4–5% organic revenue growth and ~7–8% adjusted EPS growth

Nothing broke. Nothing accelerated dramatically either.

This is exactly what Coca-Cola has become: a steady, predictable, cash-flow-driven business.


Key Highlights

  • Volume resilience: Global volumes still growing despite mature markets
  • Pricing power intact: Revenue growth supported by pricing and mix
  • Margin stability: Operating discipline preserved profitability
  • Defensive profile maintained: Cash flow strength supports dividends and capital returns
  • Guidance steady, not exciting: Mid-single-digit organic growth outlook

The market reaction was mildly negative — largely due to the revenue miss and lack of upside surprise.


SWOT Analysis

Coca-Cola remains one of the most durable consumer franchises globally. However, valuation is the key variable. For a Type 2 value investor, the debate is not about survival — it is about growth durability versus multiple compression.

Strengths

  • Global brand dominance and pricing powerEstimated price impact: +5% to +10%
  • Strong free cash flow and dividend profileEstimated price impact: +4% to +8%
  • Stable operating marginsEstimated price impact: +3% to +6%

Weaknesses

  • Low organic volume growth (~1%)Estimated price impact: -3% to -6%
  • Premium valuation relative to growth rateEstimated price impact: -5% to -10%
  • Currency exposure from global footprintEstimated price impact: -2% to -5%

Opportunities

  • Expansion of zero-sugar and premium offeringsEstimated price impact: +4% to +9%
  • Emerging market per-capita consumption growthEstimated price impact: +5% to +12%
  • Operational acceleration under new leadershipEstimated price impact: +2% to +6%

Threats

  • Sugar taxes and regulatory pressuresEstimated price impact: -4% to -8%
  • Consumer trade-down in weaker macroEstimated price impact: -3% to -7%
  • Commodity cost volatilityEstimated price impact: -2% to -6%
SWOT price impact range chart for Coca-Cola (KO) Q4 2025 earnings showing estimated stock price impact ranges: Strengths +3% to +10%, Weaknesses -10% to -2%, Opportunities +2% to +12%, and Threats -8% to -2%, with X-axis starting at -15%.
Coca-Cola (KO) Q4 2025 SWOT price impact analysis. Strengths and Opportunities provide upside support of up to +10–12%, while valuation risk and growth limitations create downside exposure of -8% to -10%. Estimated fair value remains near current trading levels, suggesting limited multiple expansion without growth acceleration.

Valuation Scenarios

Coca-Cola is not a high-growth stock. It is a defensive compounder. That means valuation depends primarily on earnings durability and acceptable multiple range.

Assumptions:

  • 2025 adjusted EPS ≈ $2.60
  • 2026 expected EPS ≈ $2.80 (midpoint growth assumption)
  • Historical defensive P/E range: 20x–26x

Bear Case

  • Growth slows to ~3%
  • Multiple compresses to ~20x
  • Target price ≈ $52
  • Probability: 30%

Base Case

  • Organic growth ~4–5%
  • Multiple stabilizes around ~23x
  • Target price ≈ $60
  • Probability: 50%

Bull Case

  • EPS growth accelerates to ~9–10%
  • Multiple expands to ~25x
  • Target price ≈ $65
  • Probability: 20%

Probability-Weighted Fair Value

Estimated fair value: ~$58–$62

Valuation scenarios chart for Coca-Cola (KO) Q4 2025 showing Bear case target price of $52, Base case $60, and Bull case $65, with a dotted fair value line at $59.
Coca-Cola (KO) Q4 2025 valuation scenarios. The Bear case assumes multiple compression and slower growth ($52), the Base case reflects steady compounding ($60), and the Bull case assumes modest acceleration and premium valuation ($65). Probability-weighted fair value is approximately $59, indicating limited upside without growth acceleration.

Verdict

Coca-Cola remains one of the safest consumer franchises globally. But at today’s valuation, investors are paying for stability, not acceleration.

For value investors:

  • Below $58 → Attractive entry
  • Around $60 → Fair value
  • Above $65 → Fully priced defensive

This is no longer a turnaround story. It is a disciplined compounding story.


Call to Action

If you are a DIY value investor, the key question is simple:

Are you buying durability at a reasonable price — or paying a premium for safety?

Follow SWOTstock for structured, valuation-driven analysis on quality businesses.


Disclaimer

This analysis is for informational and educational purposes only and does not constitute investment advice. Always conduct your own research and consult a financial professional before making investment decisions.


Morgan Stanley Q4 2025 Earnings: Investment Banking Is Back, but Is the Stock Fully Priced?

Morgan Stanley’s Q4 2025 earnings surpassed expectations, driven by investment banking recovery and stable wealth management. The firm achieved record profits, with an estimated fair value of $180 per share, indicating limited upside post-rally. Despite strengths in diversified revenue, the stock appears fairly valued against market risks and economic conditions.

TL;DR Summary

  • Morgan Stanley (MS:NYSE) delivered a strong Q4 2025, driven by a sharp rebound in investment banking and steady wealth management growth.
  • Full-year profitability and returns remain well above cost of capital, reinforcing MS as a high-quality franchise.
  • However, after a post-earnings rally, the stock looks close to fair value rather than clearly cheap.
  • Fair value estimate: around $180 per share, implying limited upside at current levels unless the deal cycle stays strong.

Quarter Recap

Morgan Stanley reported Q4 2025 results that clearly exceeded market expectations. Net revenues rose meaningfully year-over-year, with earnings boosted by a recovery in advisory and underwriting activity. Wealth Management continued to provide a stable backbone, while Institutional Securities re-accelerated as capital markets activity improved into year-end.

The earnings release confirmed that FY2025 was a record year for the firm in terms of revenues and earnings, validating the long-term strategy of building a more balanced, fee-driven business alongside cyclical market activities.


Key Highlights

  • Q4 net revenues: $17.9B, up solidly year-over-year
  • Q4 EPS: $2.68
  • FY2025 EPS: $10.21 (record)
  • ROTCE: ~22%, firmly above historical averages
  • CET1 capital ratio: ~15%, supporting dividends and buybacks
  • Wealth Management revenues: $8.4B in Q4, reflecting durable fee income
  • Investment Banking revenues: sharply higher year-over-year, signaling a deal-cycle rebound

SWOT Analysis

Morgan Stanley’s Q4 results highlight the strength of its integrated model: a resilient wealth management base combined with cyclical upside from investment banking. The following SWOT translates these drivers into estimated valuation impacts.

Strengths

  • High-quality earnings power and profitability driven by diversified businesses and ~22% ROTCE. (Estimated impact: +6% to +12%)
  • Wealth Management scale and stickiness, with large fee-based assets providing earnings stability. (+5% to +10%)
  • Clear rebound in investment banking, supporting upside to normalized earnings. (+4% to +9%)
  • Strong capital position (CET1 ~15%), enabling consistent capital returns. (+2% to +5%)

Weakness

  • Earnings remain market-sensitive, particularly in trading and underwriting. (−2% to −6%)
  • Rising technology and execution costs, which could pressure margins if they become structural. (−2% to −5%)
  • Isolated credit noise, including CRE-related charge-offs, reminds investors of tail risks. (−1% to −3%)

Opportunities

  • Sustained deal-cycle recovery could keep Institutional Securities returns elevated. (+4% to +10%)
  • Further shift toward fee-based wealth revenues enhances durability and valuation quality. (+3% to +8%)
  • Operating leverage, as incremental revenues flow through at higher margins. (+2% to +6%)

Threats

  • A reversal in capital markets sentiment could quickly compress revenues and multiples. (−6% to −15%)
  • Regulatory or capital rule changes that reduce returns on equity. (−3% to −8%)
  • Cost inflation becoming structural, limiting valuation re-rating. (−2% to −7%)
SWOT price impact chart for Morgan Stanley Q4 2025, illustrating strengths, weaknesses, opportunities, and threats with estimated share price impact ranges from −20% to +15%.
Morgan Stanley Q4 2025 SWOT analysis showing estimated price impact ranges. Strengths and opportunities reflect investment banking recovery and wealth management durability, while weaknesses and threats capture market cyclicality and downside risks.

Valuation Scenarios

For Morgan Stanley, valuation is best anchored on tangible book value and returns on equity. With tangible book value per share around $50, different P/TBV multiples reflect how much premium the market assigns to a ~20%+ ROTCE franchise.

Bear case (~$160)

  • Deal activity cools and market conditions soften.
  • Valuation compresses toward a more conservative quality-bank multiple.

Base case (~$180)

  • Wealth Management remains stable and investment banking normalizes.
  • MS sustains premium returns without further multiple expansion.

Bull case (~$200)

  • Deal momentum persists and the integrated-firm narrative strengthens.
    • Market assigns a top-tier multiple to durable earnings power.

Probability-weighted fair value: ~$180 per share.

Valuation scenarios chart for Morgan Stanley Q4 2025 with three bars showing bear case at $160, base case at $180, and bull case at $200, alongside a dotted fair value line at $180.
Morgan Stanley Q4 2025 valuation scenarios showing bear, base, and bull price targets. The probability-weighted fair value centers around $180 per share, highlighting limited upside after the post-earnings rally.

Verdict

Morgan Stanley remains a best-in-class financial franchise, and Q4 2025 confirms that its diversified model works when markets recover. However, after the post-earnings rally, the stock appears fairly valued rather than obviously undervalued.

For long-term, value-oriented investors:

  • Above ~$190: upside looks limited unless the deal cycle stays unusually strong.
  • Around ~$180: valuation is reasonable for a high-quality compounder.
  • Below ~$165: the stock would begin to offer a more compelling margin of safety.

Call to Action

If you found this breakdown useful, follow SWOTstock for clear, fundamentals-driven earnings analysis that cuts through the noise and focuses on valuation, risk, and long-term returns.


Disclaimer

This article is for informational purposes only and does not constitute investment advice. All analysis is based on publicly available company disclosures. Investors should conduct their own research or consult a financial professional before making investment decisions.