Berkshire Hathaway Q3 2025 — Earnings Strength, Record Cash, and a Market That Shrugged

Berkshire Hathaway reported strong Q3 2025 earnings, with $13.5B in operating profits and a record cash reserve of $381B. Despite excellent insurance gains, the stock’s reaction was muted, reflecting cautious investor sentiment and no share buybacks. The outlook remains stable, but without capital deployment, the stock appears fairly valued.

TL;DR Summary

Berkshire delivered one of its strongest operating quarters in years: $13.5B in operating earnings (+34% YoY)$30.8B in net income, and a record $381B cash pile. Insurance posted exceptional underwriting profits and float grew to $176B. Yet the stock barely reacted on Nov 3 — reflecting Buffett’s continued caution, no buybacks, and heavy cash positioning. Berkshire looks fairly valued, with modest upside if capital deployment improves.


Quarter Recap

Berkshire reported Q3 2025 earnings on Saturday, November 1. The results showcased the strength of its core businesses:

  • Operating earnings surged to $13.485B, driven by rebounding insurance profitability.
  • Net income came in at $30.796B, boosted by mark-to-market investment gains.
  • Insurance underwriting delivered $2.369B in profit — nearly triple YoY.
  • Berkshire Hathaway Energy earned $1.489B; BNSF generated $1.449B.
  • The company ended the quarter with $305B in U.S. Treasury bills and $381.7B in total cash and equivalents — a historic record.

Despite these results, Berkshire again did not repurchase shares and was a net seller of equities during the quarter — a message that did not go unnoticed by the market.


Key Highlights

1. A Massive Cash Wall
Berkshire now holds one of the largest cash positions in its history — a sign of both discipline and a lack of compelling opportunities.

2. Insurance Delivered Its Best Quarter in Years
Underwriting profit and investment income both rose sharply, supported by higher rates and disciplined pricing.

3. Apple Exposure Remains High
Apple continues to dominate the equity portfolio, though Berkshire reduced its position earlier in the year.

4. No Buybacks in 2025
Management chose not to repurchase shares for the first nine months — a strong signal that Buffett does not view Berkshire as undervalued at current levels.

5. Market Reaction Was Muted
On Nov 3 (first trading day after earnings), BRK.B closed near $476, showing almost no reaction to the strong quarter — reflecting cautious investor sentiment and the sense that Berkshire is in a holding pattern.
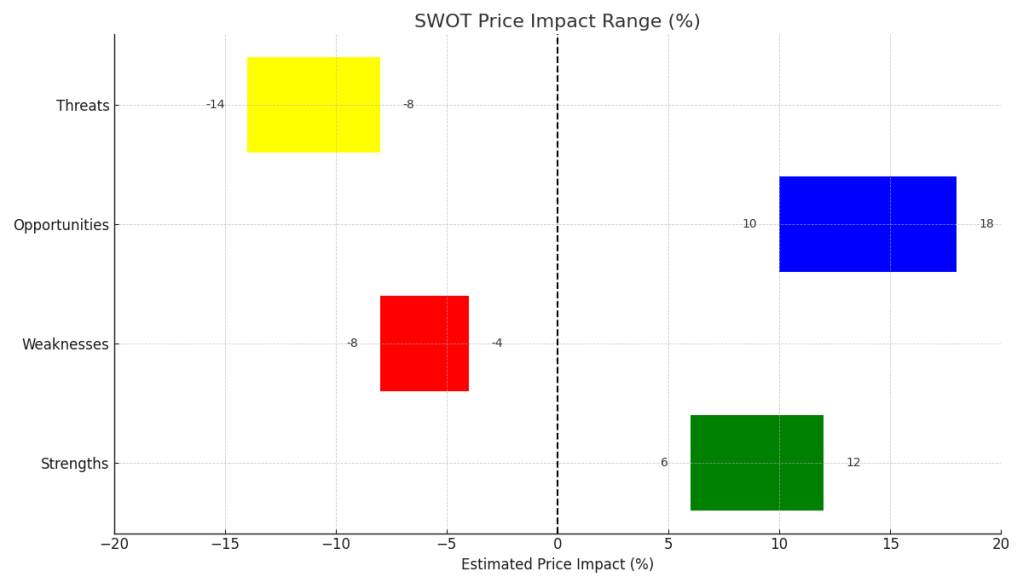

SWOT Analysis

Strengths (+6% to +12%)

  • Record cash levels
  • Strong underwriting performance
  • Diversified, resilient businesses
  • Significant float growth

Weaknesses (–4% to –8%)

  • Sluggish revenue growth
  • No buybacks YTD
  • Heavy reliance on Apple

Opportunities (+8% to +15%)

  • Capital deployment potential
  • Treasury valuation upside
  • Insurance pricing cycle

Threats (–10% to –18%)

  • Succession transition
  • Market downturn exposure
  • Catastrophe risk
Berkshire Q3 2025 earnings SWOT analysis horizontal bar chart showing Strengths (+6 to +12%), Weaknesses (–8 to –4%), Opportunities (+10 to +18%), and Threats (–14 to –8%) with all labels outside the bars, a vertical dashed zero line, and x-axis from –20 to +20.

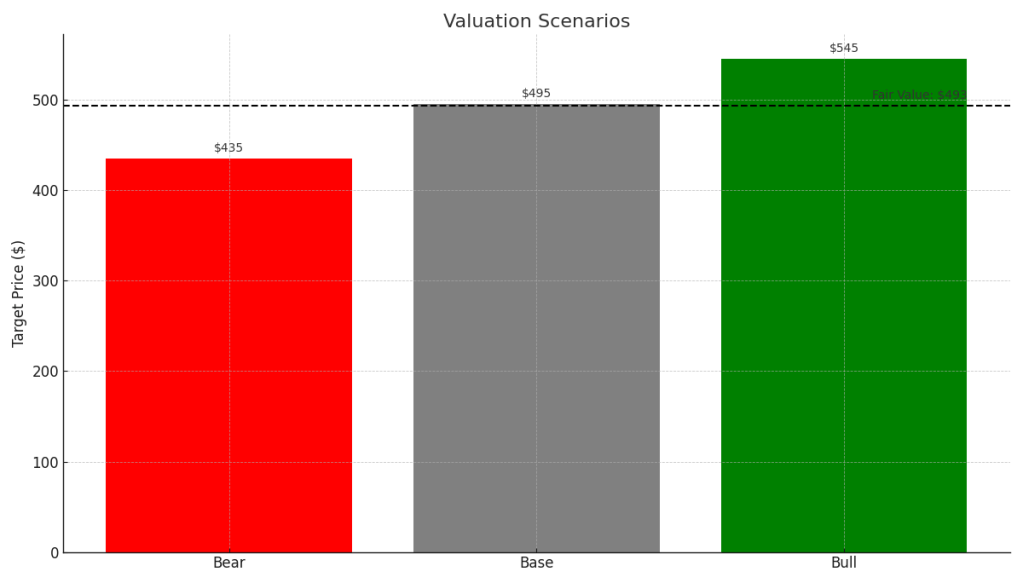
Valuation Scenarios (Bull / Base / Bear)

Bear Case — $435 (25%)

  • Uses mid-threat impact
  • No buybacks, leadership uncertainty
  • Market correction risk
    Fair value: $476 × (1 – 9%) ≈ $435

Base Case — $495 (50%)

  • Balanced strengths/weaknesses
  • Stable operating earnings
  • Treasury yield support
    Fair value: $476 × (1 + 4%) ≈ $495

Bull Case — $545 (25%)

  • Strong insurance profitability
  • Opportunistic capital deployment
  • Rate cuts boosting Treasury book
    Fair value: $476 × (1 + 14.5%) ≈ $545

Probability-Weighted Fair Value

= (0.25 × 435) + (0.50 × 495) + (0.25 × 545)
$493

Final Fair Value: $493

≈ 3.6% above current price → Fairly Valued

Valuation scenarios bar chart for Microsoft Q1 FY2026 showing Bear case at $435, Base case at $495, and Bull case at $545, with a dashed Fair Value line at $493 fully visible across the chart.

Verdict

Berkshire remains a fortress — high-quality, resilient, and disciplined. But with such a massive cash position and no buybacks, the market is waiting for a catalyst. Q3 shows strength, but until Berkshire deploys capital or signals undervaluation with buybacks, the stock likely stays range-bound.

For long-term value investors, Berkshire remains a low-risk compounder — but not yet a bargain.


Call to Action

If you found this analysis helpful, follow SWOTstock for more breakdowns of major earnings, fair-value scenarios, and investor-focused research. Share this post with another DIY value investor who follows Berkshire closely.


Disclaimer

This article is for informational and educational purposes only and is not investment advice. All analysis is based solely on Berkshire Hathaway’s official Q3 2025 financial report and management disclosures.


Meta Q3 2025 — AI Momentum, Ad Strength, and a $505 Fair Value

Meta’s Q3 2025 report showed strong results, with AI enhancements driving user engagement and advertising success on Facebook and Instagram. Stock surged +7.7%, affirming confidence in future earnings. Key points included improved cost management, narrowing Reality Labs losses, and an optimistic outlook for 2026, maintaining a fair value estimate of $505 per share.

TL;DR Summary

Meta delivered a strong Q3 2025, with AI ranking models boosting engagement and ad yield across Facebook and Instagram. Management highlighted that “AI continues to be the primary driver of incremental time spent,” and capex is stabilizing after two years of heavy investment. The stock jumped +7.7% as results reinforced confidence in Meta’s 2026 earnings trajectory. Our fair value estimate remains $505 per share.


Quarter Recap

Meta’s third quarter demonstrated a well-balanced combination of product and financial execution. Advertising remained robust, driven by stronger pricing and an uptick in Reels engagement. Management emphasized that “Reels is now contributing positively to overall revenue growth,” confirming the format’s successful maturation.

Operating discipline also played a meaningful role in the quarter. CFO Susan Li noted that “the largest wave of AI infrastructure investment is now behind us,” which reassured investors concerned about multi-year capex drag. Reality Labs continued to operate at a loss, but management highlighted improved efficiency, saying “we’re seeing meaningful progress in reducing the cost structure of our AR/VR portfolio.”

Together, these factors contributed to the stock’s sharp post-earnings move.


Key Highlights

  • AI-driven engagement increased time spent across apps; management reiterated “AI ranking improvements remain one of the biggest drivers of ad performance.”
  • Advertising trends improved heading into the Q4 holiday season.
  • Capex expected to stabilize; CFO confirmed “2026 capex growth will be significantly more measured compared to prior years.”
  • Reality Labs losses narrowed on better cost controls.
  • Market responded with a +7.7% surge after results.

SWOT Analysis

Meta’s competitive edge lies in its ability to compound engagement, monetization, and AI-enabled product velocity. Management’s commentary reinforced this dynamic, noting that “AI is improving every major surface of the Family of Apps,” setting up continued momentum into 2026.

Strengths (+8% to +15%)

  • AI-driven ranking systems improving engagement and ad yield.
  • Massive 3.4B+ global daily active users.
  • Margin expansion supported by cost discipline.
  • Llama ecosystem adds strategic AI optionality.

Weaknesses (–6% to –12%)

  • Heavy reliance on ads as the primary revenue source.
  • Reality Labs remains a multi-year drag on profitability.
  • Regulation and safety compliance add structural costs.
  • High capex slows free cash flow near-term.

Opportunities (+10% to +18%)

  • Messaging monetization—WhatsApp and Messenger ads still early-day.
  • Generative AI-powered features improving content creation and engagement.
  • Ray-Ban Meta showing early AR/VR traction.
  • Retail and SMB ad recovery accelerating into 2026.

Threats (–10% to –20%)

  • Fierce competition from TikTok and YouTube.
  • Regulatory challenges in the EU and U.S.
  • Hardware adoption uncertainty.
  • Emerging market volatility affecting ad budgets.
META Q3 2025 SWOT analysis chart showing estimated stock price impact ranges for strengths, weaknesses, opportunities, and threats from –20% to +18%.

Valuation Scenarios

Management’s commentary around costs, engagement, and AI infrastructure aligns well with our modeled ranges. As Zuckerberg noted, “We’re entering a more efficient phase of our AI investments,” supporting a healthier earnings trajectory.

Bear Case — $420 (Prob. 25%)

  • Formula: $18.50 EPS × 22.7×
  • Slower ad growth; monetization plateaus
  • Elevated capex persists
  • Slight margin compression
  • Reality Labs losses widen

Base Case — $510 (Prob. 50%)

  • Formula: $19.80 EPS × 25.8×
  • Strong engagement; Reels + messaging push up monetization
  • Margin expansion from cost discipline
  • Stabilizing capex
  • AI ranking improvements continue to enhance ad yield

Bull Case — $580 (Prob. 25%)

  • Formula: $20.70 EPS × 28×
  • Strong retail ad cycle
  • Messaging monetization ramps
  • Faster cost improvement in Reality Labs
  • Strong AI-driven ad performance

Probability-Weighted Fair Value: $505

META Q3 2025 valuation scenarios chart showing Bear ($420), Base ($510), and Bull ($580) target prices with a fair value line at $505.

Verdict

Meta’s Q3 performance reinforces the company’s position as the most scaled and monetization-efficient AI-driven social platform. With engagement and ad yield rising, capex stabilizing, and incremental AI products rolling out across apps, the long-term setup remains attractive. Our fair value of $505 per share offers a balanced, grounded view for long-term growth investors.


Call to Action

If you enjoy these breakdowns, follow SWOTstock on LinkedIn and explore more analyses at SWOTstock.com.


Disclaimer

This content is for informational purposes only and is not investment advice. Investors should conduct their own research or consult a licensed financial advisor.


Bank of America Q3 2025 — “Steady Hands in a Choppy Cycle”

Bank of America demonstrated strong Q3 2025 results with an EPS of $1.06 and a net interest income of $15.2 billion, alongside a 43% rise in investment-banking fees. Management’s increased Q4 guidance reflects confidence. The bank’s stability positions it as a reliable choice for value investors amid economic uncertainty.

TL;DR

Bank of America reported a steady and resilient Q3 2025: EPS came in at $1.06, net interest income rose to $15.2 billion, and investment-banking fees jumped 43%. Management also raised Q4 NII guidance, signaling confidence heading into year-end. After the release, the stock traded roughly 2–3% higher, reflecting a market that values stability in a choppy macro environment. For DIY value investors, this quarter underscores BofA’s role as a dividend-reliable, moderately undervalued financial anchor rather than a high-beta trade.


Quarter Recap

Bank of America delivered a steady and confident performance in Q3 2025, leaning more on disciplined execution than dramatic surprises. Net income reached $8.5 billion, translating to $1.06 per share, comfortably above expectations and supported by $15.2 billion in net interest income that remained resilient despite shifting rate dynamics. Management emphasized that positive operating leverage reflected tighter cost control and continued investment in risk management and technology. Capital markets activity added a welcome boost, with investment-banking fees rising 43% as dealmaking and underwriting improved from last year’s lows. Importantly for long-term investors, the bank’s CET1 ratio stayed above 12%, reinforcing its capacity to maintain dividends and pursue selective buybacks even in a more uncertain macro backdrop. Overall, the quarter underscored BofA’s ability to produce stable, repeatable earnings at a time when many peers are navigating more uneven conditions.


Key Highlights

  • EPS: $1.06, above internal targets and analyst expectations.
  • Net Interest Income: $15.2B, maintaining upward momentum.
  • Investment-Banking Fees: +43% YoY, continued rebound in capital markets.
  • Operating Leverage: Positive, reflecting disciplined expense control.
  • Credit Costs: Stable, no significant deterioration in consumer or commercial books.
  • Capital Position: CET1 above 12%, supporting sustained shareholder returns.
  • Guidance: Q4 NII raised to $15.6–15.7B, signaling management confidence.

SWOT Analysis

Strengths (+3% → +7%)

• Strong NII performance and EPS beat

• Well-managed expenses and positive operating leverage

• Dividend raised earlier this year, supported by capital strength

Weaknesses (–5% → –2%)

• Slower loan growth compared to peers

• Slight margin compression in wealth management

• Tech and compliance investments increasing non-interest expense

Opportunities (+4% → +10%)

• Investment-banking recovery (+43% YoY)

• Stable credit trends with room for normalization upside

• Rate-cycle normalization in 2026 may boost loan demand

Threats (–10% → –5%)

• CRE and credit-card segments remain watch-list risks

• Potential capital-rule tightening limiting buybacks

• Prolonged macro uncertainty affecting NII trajectory

Horizontal bar chart showing Bank of America Q3 2025 SWOT price impact ranges. Strengths (+3 to +7 %), Weaknesses (–5 to –2 %), Opportunities (+4 to +10 %), and Threats (–10 to –5 %). The chart uses green for strengths, red for weaknesses, blue for opportunities, and yellow for threats, with a dashed vertical line at zero indicating neutral impact.

Valuation Scenarios (12-Month Outlook)

Using official Q3 performance, NII guidance, and credit commentary:

Bull Case – $56 (+15%)

• Sustained NII strength

• Continued recovery in investment banking

• Flat credit losses into 2026

Base Case – $51.3 (+5%)

• Stable NII

• Moderate fee growth

• Expense discipline maintained

Bear Case – $44 (–10%)

• Margin compression from declining rates

• Credit costs rise toward the historical mean

• CRE pockets worsen

Probability-Weighted Fair Value:

(0.3 x 56) + (0.5 x 51.3) + (0.2 x 44) = approx. $51.1

Vertical bar chart illustrating Bank of America Q3 2025 valuation scenarios. Bear case $44 (20 %), Base case $51.3 (50 %), and Bull case $56 (30 %). A dashed horizontal line marks the calculated fair value at about $51 per share. Bars are color-coded red, gray, and green respectively.

Verdict

Bank of America continues to deliver what value-focused investors want: predictable earnings, conservative capital management, and a stable dividend.

This quarter didn’t redefine the company—but it didn’t need to.

Instead, it reinforced that BofA’s risk-reward profile is built on durability rather than excitement.

At around $50–51 post-earnings, shares sit close to their $51 fair value, leaving modest upside but strong downside support. For long-term investors comfortable with financial-cycle volatility, BofA remains a hold with opportunistic accumulation on dips below $48.


Call to Action

If you find this style of earnings-driven, valuation-based analysis helpful, follow SWOTstock for more breakdowns across banks, tech, and industrials—always grounded in official filings and management commentary.


Disclaimer

This article is for informational and educational purposes only. It does not constitute investment advice or a recommendation to buy or sell any securities. All analysis is based solely on Bank of America’s official Q3 2025 financial results and publicly available management commentary. Investors should conduct their own research or consult a licensed advisor before making investment decisions.