ASML posted a solid Q3 with €7.5 billion in sales and €2.1 billion in net income, leading to a positive stock reaction. Despite a projected decline in Chinese demand for 2026, management remains optimistic, maintaining a fair valuation of approximately $1,190 per share, indicating significant growth potential driven by AI advancements.
🔎 TL;DR Summary
ASML (AMSL:NASDAQ) just delivered another steady quarter: €7.5 billion in sales, €2.1 billion net income, and margins holding above 51 %. The stock reacted positively in pre-market, climbing ~3 %, as investors looked beyond a cautious China outlook to renewed confidence in ASML’s long-term AI-driven roadmap. Our fair-value model points to ~ $1,190 per share, ≈ 25 % upside.
🧭 Quarter Recap
Management called Q3 “in line with guidance.” Bookings hit €5.4 billion, supported by continued momentum in EUV and early shipments of High-NA EUV systems. The company also highlighted its new AI partnership with Mistral AI, aiming to embed machine-learning control into yield and productivity.
The only dark cloud: ASML expects a “significant decline in China demand in 2026.” Still, management does not foresee overall sales falling below 2025 levels — a sign of resilience amid geopolitical shifts.
💡 Key Highlights
Net sales: €7.52 billion | Gross margin: 51.6 %
Net income: €2.13 billion | EPS: €5.49
Bookings: €5.4 billion | Service revenue: €1.96 billion
ASML Q3 2025 Valuation Scenarios: Target prices under Bear, Base, and Bull cases.
🧠 Verdict
ASML remains the “picks-and-shovels” play for the AI era. Even as near-term demand wobbles, its EUV and High-NA roadmap locks in a multi-year growth path few companies can match. For tech-savvy growth investors, the setup still favours accumulation on dips.
💬 Investor Takeaway
Market reaction shows confidence in ASML’s long-term story: from chipmaker orders to AI co-design tools, it continues to define the semiconductor future. Short-term noise aside, the firm’s monopoly position and AI-linked flywheel justify a premium valuation — and our $1,190 fair price reflects that potential.
Disclaimer: This post is for informational purposes only and not financial advice. Please do your own research before investing.
Autodesk (ADSK) beats Q1 FY2026 estimates and raises guidance, but is the stock already priced for perfection? Dive into our AI-focused SWOT analysis, valuation breakdown, and investor verdict.
TL;DR – Solid Beat, Upgraded Guidance, But Market Unmoved
Autodesk (NASDAQ: ADSK) beat expectations in Q1 with 15% revenue growth, expanding margins, and strong free cash flow. Management raised full-year guidance and highlighted its AI platform roadmap. Still, the stock stayed flat—suggesting the optimism may be fully priced in.
Financial Overview – Growth That Converts to Cash
Autodesk reported:
Revenue: $1.63B (+15% YoY)
EPS (Non-GAAP): $2.29
Operating Margin: 37% (+300bps YoY)
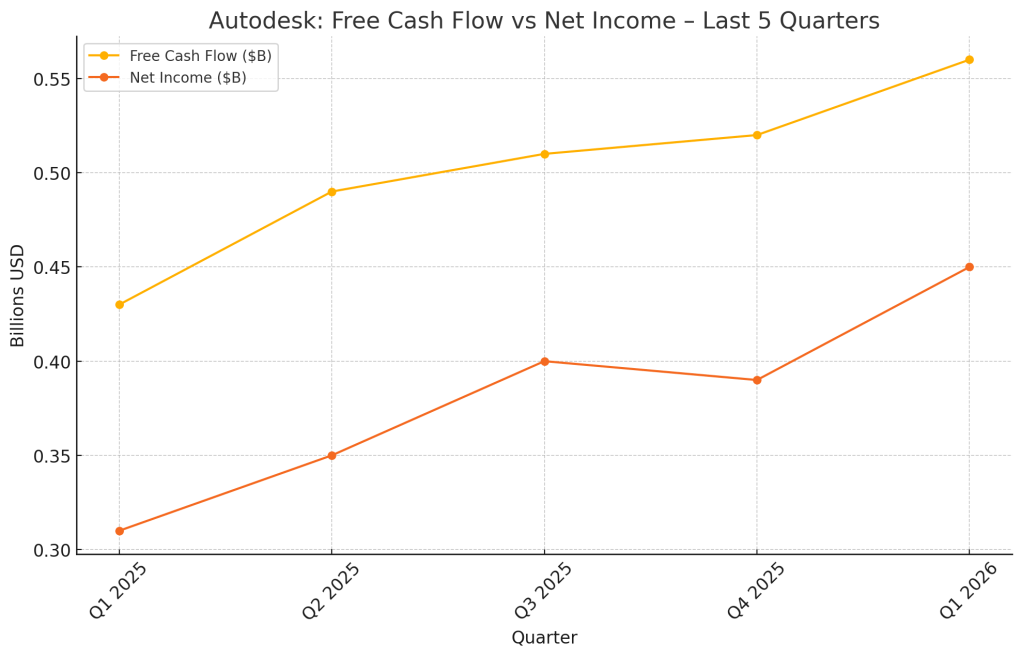
Free Cash Flow: $556M (+14%)
Billings: $1.43B (+29%)
FY2026 guidance raised for revenue and EPS
What sets Autodesk apart isn’t just strong revenue—it’s the ability to consistently convert earnings into cash flow.
Where the Growth Is Coming From
Revenue isn’t growing evenly across all business lines. Autodesk’s AEC (architecture, engineering, and construction) segment remains dominant, but Manufacturing and “Others” are catching up.
Also critical is the mix of recurring revenue. Subscription ARR is expanding steadily, which supports long-term valuation multiples.
Management’s Outlook – Confidence Backed by Upward Revisions
Autodesk has shown a pattern of raising guidance, reinforcing investor confidence in leadership and execution.
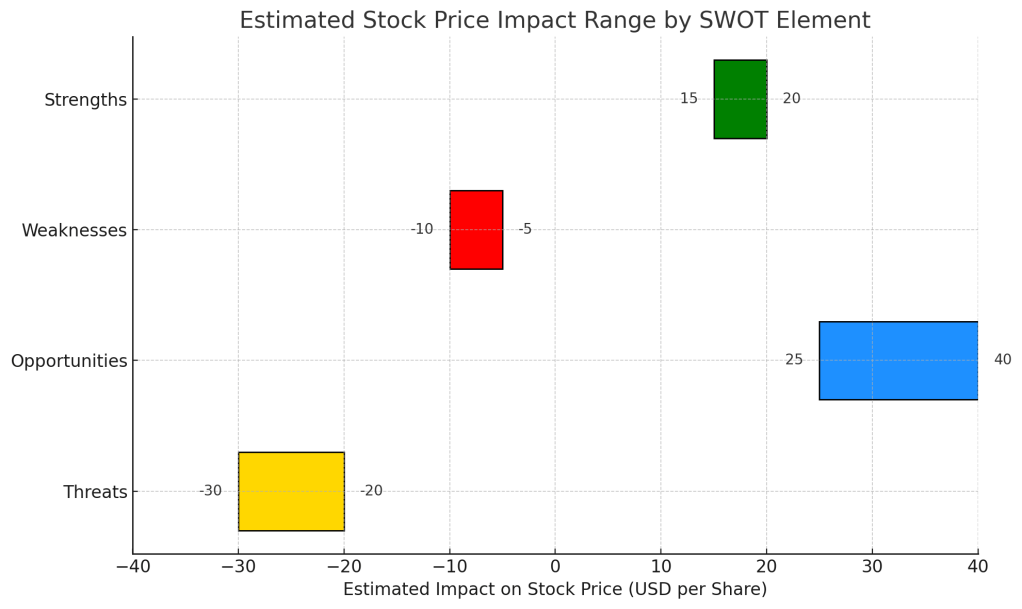
SWOT Breakdown – What’s Working, What’s Not, and Where We Go Next
Let’s break it down using SWOT—strengths, weaknesses, opportunities, and threats—with estimated stock price impact for each:
Despite the strong report, Autodesk’s closing price after earning released ($295.35 as of May 23, 2025) implies a ~30.7x forward P/E. Here’s how that compares to valuation scenarios based on official EPS guidance and fair multiples:
That’s nearly double our base case. Investors are pricing in:
Premium for platform dominance and design ecosystem
Long-term AI monetization potential
Confidence in 3–5 year growth, not just FY2026
Let’s check historical valuation to see if this premium is new.
Verdict – Fully Valued. Wait for Dip.
Autodesk’s vision is impressive. The stock is too. But at current prices, the upside may already be realized—at least in the short term. Long-term investors may want to hold. Opportunists should consider waiting for a pullback below $250 to improve margin of safety.
Call to Action
Want no-hype, investor-friendly breakdowns like this? Subscribe to SWOTstock to stay ahead of the curve—no fluff, just fundamentals.
Disclaimer
This post is based solely on Autodesk’s official financial report and earnings call transcript. It does not constitute investment advice. Please do your own research.
Walmart reported strong Q1 FY2026 results, with sales rising to $165.61 billion and e-commerce profitability achieved globally. Despite these positives, stock prices remained flat due to inflation, pricing pressures, and a lack of EPS guidance. While Walmart presents growth opportunities, macroeconomic risks traditionally temper investor enthusiasm.
Quick Take: Steady Growth, But Macro Risks Keep a Lid on the Rally
Walmart (NYSE: WMT) delivered a strong Q1 with rising sales, expanding operating income, and—most importantly—e-commerce profitability. Yet the stock barely moved. Why? Inflation, pricing pressure, and the decision to withhold EPS guidance signal near-term caution. For long-term, low-risk growth seekers, Walmart still looks like a solid bet, but now’s the time to watch execution closely.
Quarter Recap: A Landmark Quarter, But Tariff Warnings Weigh Heavily
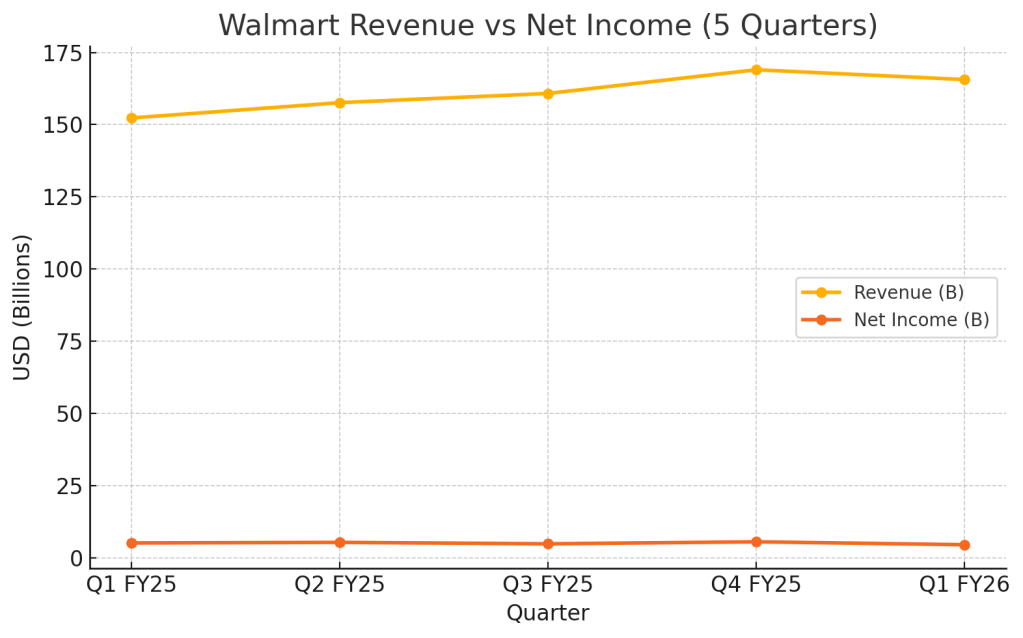
Walmart’s Q1 FY2026 (calendar Q1 2025) showed revenue of $165.61 billion (+2.5% YoY), with operating income up 4.3%. U.S. comparable sales rose 4.5%, driven by strong performance in food and pharmacy. A standout highlight: e-commerce operations became profitable globally—a signal that Walmart’s long-term tech investments are beginning to pay off.
Despite this, the stock dipped –0.5% during regular trading and was down 4% at open, after an initial premarket rise. The reason? CEO Doug McMillon acknowledged that Walmart would raise prices in response to persistent tariffs. And critically, the company withheld EPS guidance, citing economic uncertainty.
Why this quarter matters: Walmart just hit a key profitability milestone in digital—but cost pressures and visibility concerns are limiting investor enthusiasm.
Walmart Q1 2025 – Key Financial Highlights
Revenue: $165.61B (+2.5% YoY)
Net Income: $4.49B (down from $5.10B YoY)
EPS: $0.61 (beat by $0.03)
U.S. Comp Sales: +4.5%
Global E-commerce Sales: +22% YoY
E-commerce Profitability: First time achieved globally
Walmart vs. Amazon vs. Target: Who’s Winning the Retail Transformation?
Metric
Walmart
Amazon
Target
E-commerce Profitability
Achieved (Q1 2025)
Long-established
Still lagging
In-store Sales Growth
+4.5% U.S. comps
Minimal (no store footprint)
Flat to slightly negative
Ad Revenue Monetization
Expanding (Walmart Connect)
Robust (Amazon Ads)
Early stage
Inventory Strategy
AI + automation scaling
Logistics leader
Struggling with excess
Guidance Tone
Cautious, no EPS given
Confident
Defensive, cost-cutting
Takeaway: Walmart is the only large-format retailer with profitable e-commerce and store traffic momentum. It lags Amazon in tech monetization but is clearly outpacing Target in operational agility.
SWOT Breakdown: Walmart’s Digital Wins Meet Margin Headwinds
Let’s break it down using a simple SWOT framework—what’s going well, what’s not, where the upside lies, and what risks could derail the story.
Strengths
Walmart is scaling e-commerce profitably while growing in-store comps. Fulfillment efficiency and automation are boosting operating income.
Stock Price Impact Estimate: Could support a +$3 to +$5 upside if this continues.
Weaknesses
Margins remain pressured. Net income declined, and the decision not to issue EPS guidance raises questions about confidence in short-term forecasting.
Stock Price Impact Estimate: Could cap the stock by –$1 to –$3 per share.
Opportunities
Automation, Walmart+, advertising, and health services offer high-margin growth channels. AI integration in logistics and demand planning could unlock additional EPS upside.
Stock Price Impact Estimate: If scaled well, could add +$4 to +$6 to valuation.
Threats
Tariffs, inflation, and pricing action could impact demand—especially in general merchandise. Management’s caution suggests macro risk isn’t fully priced in.
Stock Price Impact Estimate: Worst-case downside of –$4 to –$6.
SWOT Table Summary
Category
Key Takeaways
Est. Stock Impact
Strengths
Solid comp growth, e-commerce profitability
+$3 to +$5
Weaknesses
Margin pressure, EPS visibility unclear
–$1 to –$3
Opportunities
Monetization of tech, AI, memberships, ad platform
+$4 to +$6
Threats
Tariffs, inflation, pricing backlash
–$4 to –$6
Valuation Scenarios: How Walmart Stock Could Play Out from Here
Let’s revisit Walmart’s valuation in light of its solid operational execution, profitability in e-commerce, and the macro risks it faces. With the current stock price at $96.35, here’s how the stock could move in three realistic scenarios.
Base Case (Most Likely – 50%)
Summary: Walmart maintains low-single-digit revenue growth, keeps e-commerce profitable, and stabilizes margins with the help of automation and better inventory management. However, wage inflation and tariffs continue to pressure near-term earnings. EPS growth remains modest, and valuation multiples stay flat.
Fair Value Estimate: $100
Probability: 50%
Bull Case (Optimistic – 30%)
Summary: Walmart’s automation and AI-driven efficiencies begin to show stronger results, driving margin expansion. Advertising and subscription revenue accelerate, and general merchandise demand rebounds despite pricing headwinds. The company regains multiple expansion as investors price in stronger long-term profitability.
Fair Value Estimate: $110
Probability: 30%
Bear Case (Downside – 20%)
Summary: Consumer demand weakens as inflation and tariff-related pricing continue to rise. Walmart is forced to absorb more costs to maintain competitiveness, leading to margin compression. EPS flattens or declines. Valuation contracts slightly due to uncertainty around macro execution.
Fair Value Estimate: $85
Probability: 20%
Weighted Average Fair Value Calculation
(64×0.5)+(72×0.3)+(52×0.2)=$64.00
Valuation Verdict
With the current price at $96.35 (as of May 15, 2025), Walmart appears slightly undervalued based on its fundamental performance and risk-balanced outlook. For long-term, growth-conscious investors seeking resilience and scalable upside, Walmart may offer a reasonable entry point—especially if the company can maintain its digital momentum while defending margins.
Call to Action
Want focused stock breakdowns like this for every major earnings report? Subscribe now for no-jargon, data-backed posts you can trust.
Disclaimer
This analysis is based solely on Walmart’s official Q1 FY2026 financial report and earnings call transcript. It is not investment advice. Please do your own research before investing.


Leave a comment