ASML posted a solid Q3 with €7.5 billion in sales and €2.1 billion in net income, leading to a positive stock reaction. Despite a projected decline in Chinese demand for 2026, management remains optimistic, maintaining a fair valuation of approximately $1,190 per share, indicating significant growth potential driven by AI advancements.
🔎 TL;DR Summary
ASML (AMSL:NASDAQ) just delivered another steady quarter: €7.5 billion in sales, €2.1 billion net income, and margins holding above 51 %. The stock reacted positively in pre-market, climbing ~3 %, as investors looked beyond a cautious China outlook to renewed confidence in ASML’s long-term AI-driven roadmap. Our fair-value model points to ~ $1,190 per share, ≈ 25 % upside.
🧭 Quarter Recap
Management called Q3 “in line with guidance.” Bookings hit €5.4 billion, supported by continued momentum in EUV and early shipments of High-NA EUV systems. The company also highlighted its new AI partnership with Mistral AI, aiming to embed machine-learning control into yield and productivity.
The only dark cloud: ASML expects a “significant decline in China demand in 2026.” Still, management does not foresee overall sales falling below 2025 levels — a sign of resilience amid geopolitical shifts.
💡 Key Highlights
Net sales: €7.52 billion | Gross margin: 51.6 %
Net income: €2.13 billion | EPS: €5.49
Bookings: €5.4 billion | Service revenue: €1.96 billion
ASML Q3 2025 Valuation Scenarios: Target prices under Bear, Base, and Bull cases.
🧠 Verdict
ASML remains the “picks-and-shovels” play for the AI era. Even as near-term demand wobbles, its EUV and High-NA roadmap locks in a multi-year growth path few companies can match. For tech-savvy growth investors, the setup still favours accumulation on dips.
💬 Investor Takeaway
Market reaction shows confidence in ASML’s long-term story: from chipmaker orders to AI co-design tools, it continues to define the semiconductor future. Short-term noise aside, the firm’s monopoly position and AI-linked flywheel justify a premium valuation — and our $1,190 fair price reflects that potential.
Disclaimer: This post is for informational purposes only and not financial advice. Please do your own research before investing.
Micron’s Q3 FY2025 earnings reveal a strong AI-driven rebound with record DRAM sales, margin expansion, and rising profitability. Explore our SWOT analysis, valuation scenarios, and stock price outlook based solely on official financials and management commentary.
TL;DR Summary
Micron (NASDAQ:MU) reported blockbuster Q3 FY2025 earnings, fueled by explosive growth in AI memory demand — especially for high-bandwidth memory (HBM), which exceeded $1 billion for the quarter and is already sold out for 2025. With EPS of $1.91 and Q4 guidance pointing even higher, Micron is making a strong case for a rerating. Our updated fair value estimate is $135.50, implying modest upside from current levels, but more importantly, confirming Micron’s transition from cyclical to structural relevance in the AI build-out.
Quarter Recap: A Turning Point in the Cycle
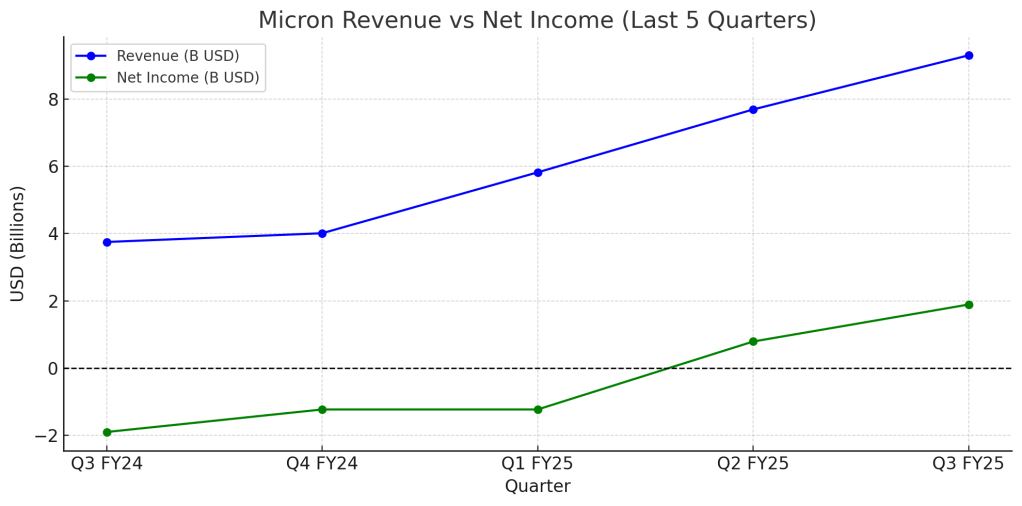
For years, Micron has lived and died by the memory cycle. But Q3 FY2025 feels different. The company reported its highest-ever quarterly revenue at $9.3 billion, a 37% year-over-year increase. DRAM led the charge, generating $7.1 billion, while HBM demand — largely driven by AI servers — grew over 50% quarter-over-quarter and surpassed $1 billion for the first time. Management confirmed that all HBM supply is committed through the end of 2025, signaling not just demand, but pricing power.
Gross margin came in at 39% (non-GAAP), and EPS surged to $1.91, up from a loss just one year ago. More importantly, free cash flow turned decisively positive at $1.95 billion, providing flexibility for both investment and shareholder return.
Micron also reaffirmed its long-term strategic positioning with a $200 billion commitment to U.S. manufacturing and R&D under the CHIPS Act. This isn’t just a bounce-back quarter — it looks like a foundation for a new phase of sustained growth.
What’s Fueling the Momentum?
The key driver is unmistakably AI. As hyperscalers expand their infrastructure to support large language models and enterprise AI deployments, demand for advanced memory — particularly HBM and DDR5 — has exploded. Micron’s unique position as one of just a few players in this space is enabling it to lock in customers at strong margins.
But it’s not just the top line that’s improving. Operating leverage is finally kicking in. Inventory days are falling, CapEx is normalizing, and the company’s balance sheet is healthy with over $27.9 billion in total liquidity. For growth investors watching this space, Micron is beginning to look like a structurally profitable company, not just a cyclical memory supplier.
SWOT Analysis: Breaking Down the Fundamentals
Rather than relying on sentiment or social media buzz, let’s unpack the key forces driving Micron’s stock — both good and bad — based on official data and management commentary.
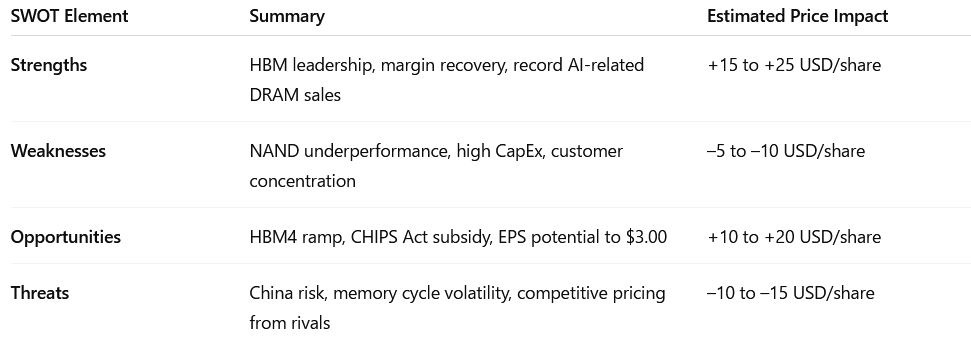
Strengths (+$15 to +25/share)
Micron’s execution in AI memory is the real story. HBM revenue not only topped $1B but is fully booked through next year. The 1-gamma DRAM node — with 30% density and 20% power improvements — is entering early production, providing a margin and performance edge.
Weaknesses (–$5 to –10/share)
Despite DRAM’s strength, NAND continues to underperform (+4% YoY), and high CapEx levels weigh on near-term cash conversion. There’s also concentration risk — a handful of cloud customers drive a significant portion of revenue.
Opportunities (+$10 to +20/share)
With CHIPS Act funding unlocking domestic capacity and HBM4 set to launch, Micron has multiple ways to extend its lead. If FY26 EPS trends toward $3.00, the market may rerate MU toward a higher earnings multiple.
Threats (–$10 to –15/share)
AI cycles are notoriously hard to predict. Any slowdown in server buildouts, export restrictions to China, or aggressive pricing from Samsung and SK Hynix could compress Micron’s margins and reduce upside.
📊 Micron Q3 FY2025 SWOT Summary
Valuation Scenarios: Calculating What It’s Worth
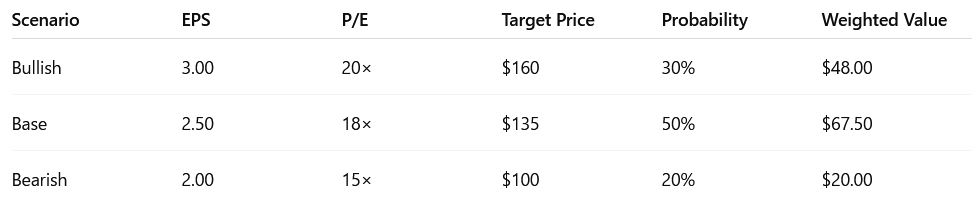
Based on Micron’s own forward guidance, historical multiples, and a fair risk-adjusted outlook, here’s how we frame the valuation:
🎯 Fair Value Estimate:
$48.00 + $67.50 + $20.00 = → $135.50/share 📉 Current Price (as of June 26): ~$127.25 📈 Implied Upside: ~6.5%
Peer Context: How Does Micron Stack Up?
Micron’s 39% gross margin now rivals Samsung’s memory division but still trails SK Hynix’s HBM-focused business, which has hit margins north of 45%. However, Micron’s consistent EPS acceleration — paired with a cleaner balance sheet and U.S. production capacity — could justify a premium multiple in future quarters.
What to Watch Next Quarter
HBM4 Ramp-Up: Will Micron maintain pricing power as next-gen chips hit production?
CapEx Discipline: Is investment tapering enough to keep FCF positive?
AI Demand Stickiness: Does server spending hold up into year-end?
Verdict: Hold to Accumulate
Micron is no longer just a cyclical memory stock — it’s emerging as a core infrastructure provider for the AI era. At today’s price around $127, the stock offers a balanced risk-reward profile with clear near-term momentum and longer-term optionality. For tech-savvy growth investors, this is a name to hold and continue accumulating on dips — not chase blindly, but don’t look away either.
Call to Action
If you’re tracking AI infrastructure plays and want insights backed only by the official data — not clickbait — follow SWOTstock or subscribe for the next update.
Disclaimer
This post is for informational purposes only. All analysis is based solely on Micron’s official Q3 FY2025 financial report and earnings call transcript. No third-party data or analyst commentary was used.
Oracle’s Q4 FY2025 earnings revealed explosive cloud growth and bold AI infrastructure plans. Our analysis breaks down the market reaction, SWOT insights, and valuation scenarios for tech-savvy investors. Is $190 justified — or overextended?
💡 TL;DR – Oracle’s AI Engine is Revving, But Is the Price Already Peaked?
Oracle (NYSE: ORCL) delivered a blockbuster Q4 with cloud revenue up 27% and Infrastructure-as-a-Service (OCI) growing 52%. Management forecasts even stronger acceleration in FY2026 — with 70%+ OCI growth and a $25 billion capex plan focused on GenAI. Investors loved it, bidding up the stock nearly 8% after hours. But with Oracle now trading around $190, the key question is whether the AI-fueled upside is already fully priced in.
📅 Oracle’s Cloud Pivot Is Real — and It’s Speeding Up
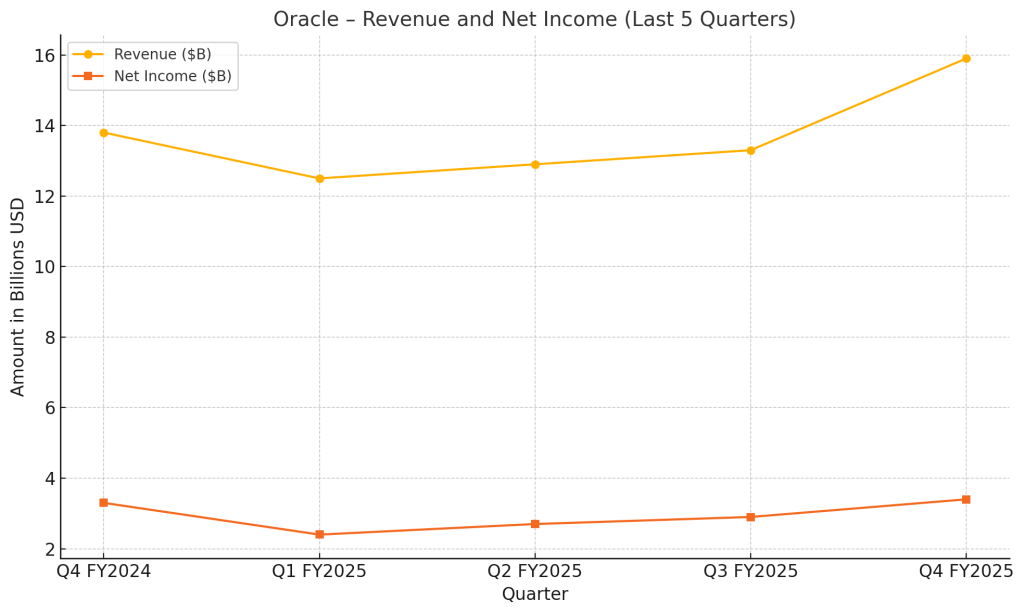
Oracle’s fiscal Q4 FY2025 results (for the quarter ending May 31) showcased a company in transition — and perhaps finally hitting escape velocity from its legacy roots. Total revenue rose 11% YoY to $15.9 billion, fueled by explosive growth in cloud services. Cloud now accounts for over 42% of Oracle’s total revenue base, with the Infrastructure business leading the charge.
Cloud Infrastructure (OCI) revenue surged 52% year-over-year to $3.0 billion. While that slightly missed some analyst whisper numbers, it still handily beat consensus and helped the company deliver a non-GAAP EPS of $1.70. More importantly, management struck an unusually aggressive tone for FY2026, projecting OCI growth of over 70% and overall cloud growth north of 40%.
Investors immediately rewarded the shift in tone — and trajectory. Oracle shares surged from $176.50 to nearly $190 in after-hours trading, reflecting a vote of confidence in the company’s AI roadmap.
🌟 Key Highlights from the Call
Cloud Infrastructure (OCI) revenue grew 52%, and management expects >70% in FY2026.
AI infrastructure: NVIDIA GPU clusters fully sold out; Oracle now trains large LLMs.
Operating cash flow for the year was $20.8B (+12% YoY).
Legacy business drag continues, with hardware down 6% and license support up just 3%.
🔍 What Oracle’s Execs Just Told Us (and Why It Matters)
CEO Safra Catz called FY2025 a “very good year,” but made clear the company sees FY2026 as an inflection point. That’s not just talk — Oracle is backing its vision with capital, planning to invest $25 billion into AI-focused infrastructure, including NVIDIA GPU clusters and new datacenters.
Larry Ellison emphasized that Oracle now trains large-scale language models on OCI superclusters and highlighted that OCI’s AI capacity is already fully sold out. He also touted 115% year-over-year growth in multi-cloud database revenue from hyperscaler partners like Microsoft, Google, and AWS. That stat alone turns heads — and signals that Oracle is more than just a slow-moving enterprise giant.
At the same time, Oracle’s legacy businesses continue to lag. Hardware revenue was down 6%, and traditional license support only grew 3%. But it’s clear where the company’s energy — and investor attention — is going.
🧠 Oracle’s AI Trajectory: What Could Go Right (or Very Wrong)
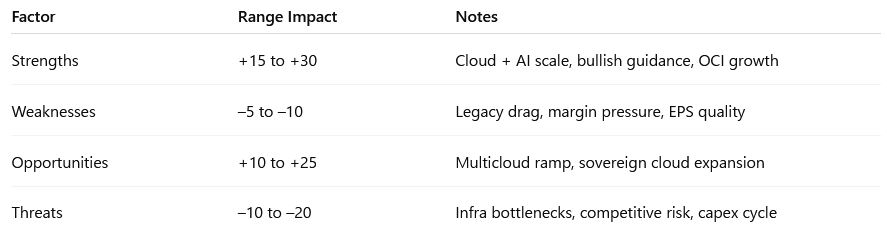
✅ Strengths (+15 to +30 USD/share)
Oracle’s biggest asset right now is momentum. The company isn’t just talking about AI infrastructure — it’s actively deploying it. With OCI consumption revenue up 62% and GPU demand outpacing supply, the company’s pivot into AI cloud infrastructure is both real and scalable. If Oracle delivers on its >70% growth target, investors could reward it with a premium multiple, adding as much as $30/share in upside.
❌ Weaknesses (–5 to –10 USD/share)
Still, legacy Oracle hasn’t disappeared. Low-growth segments like license support and hardware continue to weigh on consolidated performance. Margins remain under pressure, and part of the recent EPS growth came from share buybacks and tax adjustments, not pure operating leverage.
🌱 Opportunities (+10 to +25 USD/share)
Oracle’s MultiCloud strategy — deploying services across AWS, Azure, and Google Cloud — is opening new frontiers. Government workloads, healthcare, and sovereign cloud deployments are becoming high-growth areas. This isn’t just a defensive move; it’s Oracle expanding its addressable market at precisely the right time.
⚠️ Threats (–10 to –20 USD/share)
Of course, scaling infrastructure this aggressively brings risk. The company is committing $25 billion in capex, and any delay in deployment, cost overruns, or demand shortfall could damage margins. On top of that, the competitive threat from hyperscalers like AWS and Microsoft remains fierce.
📊 SWOT Summary Table
💰 Oracle’s Future by the Numbers — How Far Can It Run?
To evaluate Oracle’s investment case, we modeled three potential futures based entirely on official guidance and internal execution assumptions.
Bull Case – $210 (25%)
In the bull case, Oracle delivers on everything. GPU constraints ease, datacenters ramp up smoothly, and OCI’s explosive growth becomes the new norm. FY2026 EPS could reach $8.40, and if the market assigns a 25x multiple, we get a $210/share valuation. That would reflect Oracle’s full transformation into an enterprise AI infrastructure leader. We assign a 25% probability to this outcome.
Base Case – $185 (60%)
The base case, our most likely scenario (60%), assumes that execution remains strong, but not flawless. Some datacenter bottlenecks persist, but cloud revenues grow consistently. EPS lands around $7.40, which supports a $185/share valuation under a stable 25x multiple. This scenario reflects healthy, disciplined growth and is likely already reflected in current investor expectations.
Bear Case – $160 (15%)
In the bear case, execution lags. Capex pressures margins, and OCI growth slows to below expectations. If EPS only reaches $6.40, and multiples remain steady, we get a $160/share valuation. We think the chance of this outcome is about 15%.
Taken together, these scenarios point to a weighted fair value of $187.50/share, which is just about where Oracle is trading after earning released.
🎯 Should You Buy Oracle Now — or Wait for the Dip?
There’s no question Oracle is no longer the conservative enterprise holdout it once was. Its Q4 results and aggressive AI roadmap show that it’s pushing hard to become a core infrastructure layer for the AI economy. If you believe in that future, it may still have room to run — but likely at a steadier pace than the post-earnings rally suggests.
With the stock already trading near our fair value estimate, we think the best move now depends on your position. If you’re a long-term holder, this quarter reinforced your thesis. But if you’re still on the sidelines, a pullback toward $175 may offer a better risk-adjusted entry.
📣 Call to Action
Looking for clear, data-driven earnings insights that cut through the noise? 🟢 Subscribe to SWOTstock for no-hype analysis that follows the money, not the buzzwords.
⚠️ Disclaimer
This article is for informational purposes only and does not constitute financial advice. All data and commentary are based solely on Oracle’s official Q4 FY2025 earnings release and management statements.


Leave a comment