

TL;DR — Should You Buy Accenture Stock After Q3 Earnings?
Accenture (NYSE: ACN) posted a strong Q3 FY2025, delivering 8% revenue growth, 15% EPS growth, and another upward revision to its full-year guidance. Its AI-led transformation is gaining pace, with $1.5 billion in generative AI (GenAI) bookings this quarter alone. Yet the stock pulled back about 4% intraday after the report, as total bookings came in softer than expected, particularly in U.S. public sector work. Our updated valuation suggests fair value around $307 per share. For long-term growth investors, this earnings-driven dip could be an opportunity to accumulate shares.
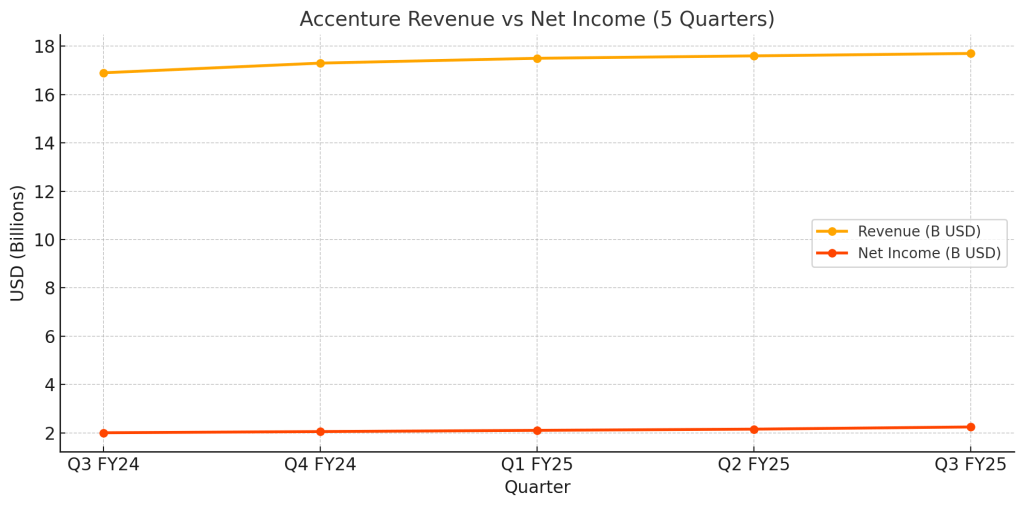
Quarter Highlights — Q3 FY2025
- Revenue: $17.7 billion (+8% YoY)
- EPS: $3.49 (+15% YoY)
- Operating Margin: 16.8% (+80bps YoY)
- Free Cash Flow: $3.5 billion
- Dividend: Increased 15% to $1.48/share
- Share Buybacks: $1.8 billion
- GenAI Bookings: $1.5 billion
- Total Bookings: $19.7 billion (–6% YoY)
- FY25 Guidance (raised): Revenue growth 6–7%, EPS $12.77–12.89, FCF $9.0–9.7 billion
Market Reaction — Why Did ACN Stock Dip?
Despite an otherwise strong quarter, Accenture stock dipped approximately 4% after the report, closing around $298.50 per share. The primary reason was softer total bookings, which declined 6% year-over-year. Management explained that this was due to delays in U.S. federal contract awards — not a sign of broader demand weakness. Given Accenture’s recent rally and premium valuation, the bookings miss triggered near-term profit-taking. The options market had priced in a ±5.3% earnings move, roughly matching the post-report volatility.
AI-Led Transformation Gaining Momentum
The bigger story remains Accenture’s pivot toward AI. The company booked $1.5 billion in GenAI-related deals this quarter, with over 30 major clients scaling adoption. A new “Reinvention Services” unit was launched to drive AI-led business transformation, and more than 500,000 employees have been trained in AI capabilities. Compared to peers such as IBM, Capgemini, and Deloitte, Accenture is moving faster and at greater scale. Management also pointed to a growing multi-year pipeline of AI services heading into FY26.
Analyst Ratings & Market Sentiment
Currently, 8 of 11 analysts covering Accenture stock rate it a “Buy,” with a consensus target of $357 per share. While the bookings softness raised some short-term caution, the long-term bullish case remains intact. Options markets indicate ongoing volatility, but investor confidence in Accenture’s AI strategy is growing.
Regional Trends — Q3 FY25
North America continues to lead, with strong AI and cloud demand driving revenue to approximately $8.9 billion. Europe remains mixed, with public sector softness balanced by growth in the UK and Nordics, contributing around $5.2 billion. Asia Pacific is accelerating, led by AI adoption in Japan and Southeast Asia, reaching about $3.6 billion.
Outlook Beyond FY25
Management expects GenAI revenue growth to accelerate into FY26 and beyond. Multi-year AI services pipelines are expanding, and the mix shift toward higher-margin AI offerings should support continued EPS growth and potential valuation re-rating. For long-term investors, this positions Accenture as one of the top large-cap beneficiaries of enterprise AI adoption.
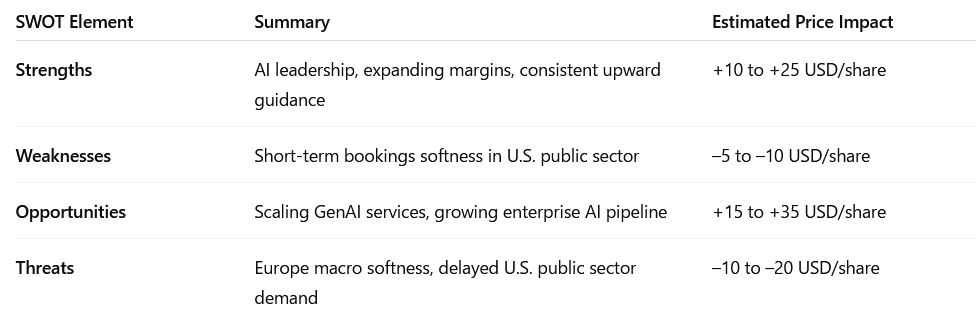
SWOT Analysis — Accenture Stock After Q3 FY25
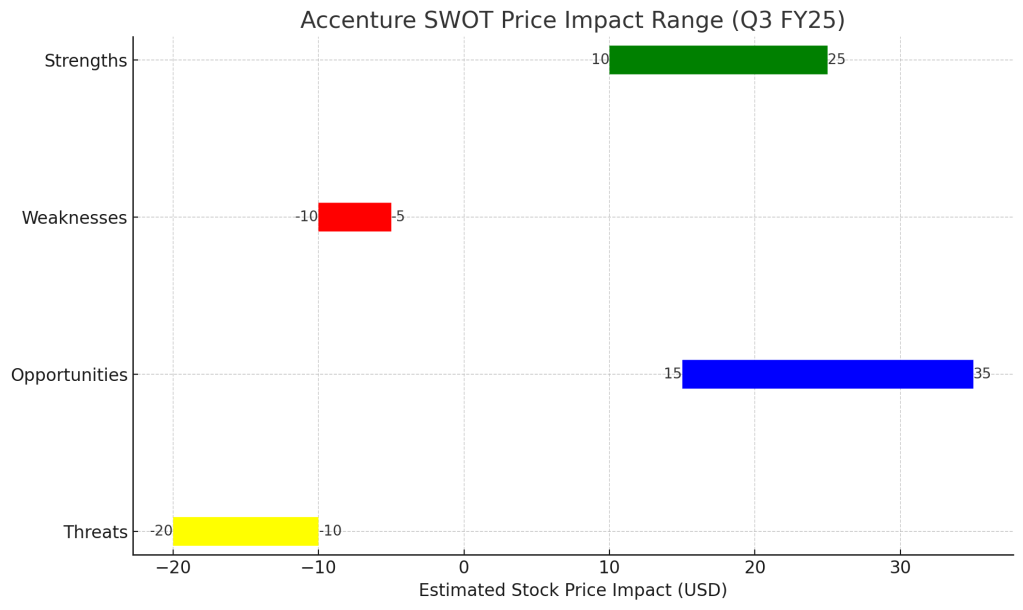
Strengths: Leadership in AI services, expanding margins, and consistent upward revisions to guidance provide valuation upside of $10 to $25 per share.
Weaknesses: Short-term bookings softness in the U.S. public sector presents a near-term headwind of approximately –$5 to –$10 per share.
Opportunities: Scaling GenAI services and a growing pipeline of large enterprise AI deals could contribute $15 to $35 per share in valuation upside.
Threats: Macroeconomic headwinds, especially in Europe and delayed U.S. public sector demand, may pose downside risk of –$10 to –$20 per share.
SWOT Price Impact Chart
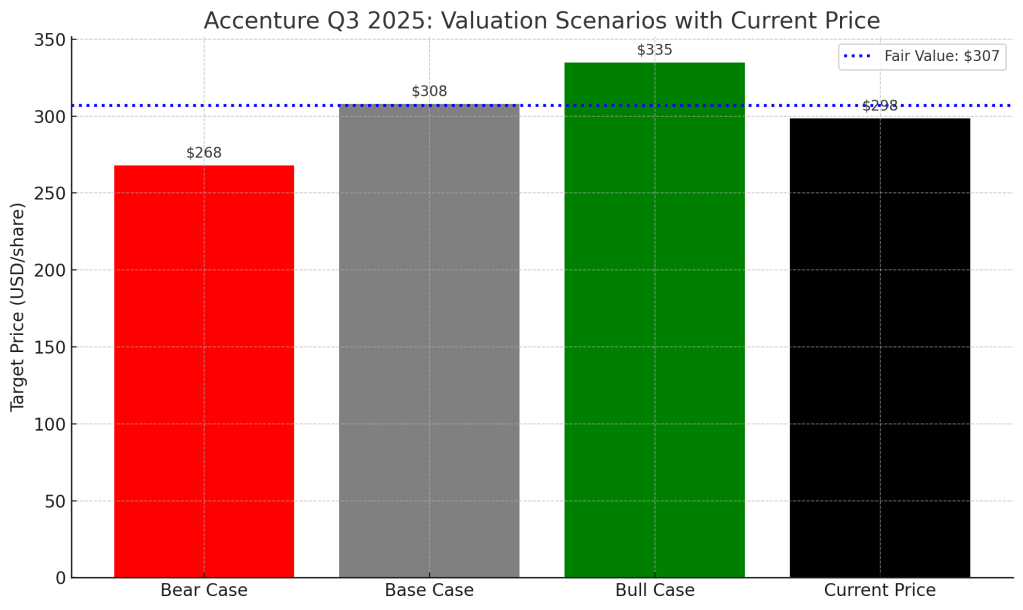
Valuation Scenarios — Where Is Fair Value?

Our updated weighted valuation suggests a fair value of approximately $307 per share, with the stock now trading near $298.50.
Should You Buy Accenture Stock Now?
For tech-savvy growth investors, the current pullback presents an attractive opportunity. Accenture is executing well on its AI-first strategy, financial fundamentals remain strong, and the company is building durable AI-driven pipelines for future growth. While short-term volatility remains likely, we view levels below $300 per share as an excellent entry point for long-term holders seeking exposure to enterprise AI transformation.
Final Takeaway
Accenture continues to solidify its leadership in enterprise AI services. The Q3 pullback reflects temporary contract timing issues, not structural demand weakness. As GenAI services scale into FY26 and beyond, we believe Accenture stock offers compelling long-term value for growth-focused investors.
Disclaimer
This analysis is based exclusively on Accenture’s Q3 FY2025 official earnings release and earnings call transcript. It is not financial advice. Investors should conduct their own due diligence.


Leave a comment