Amazon Q2 2026: AWS Accelerates, but Has the Stock Already Priced In the AI Upside?

Amazon’s Q2 2026 results highlight significant growth, particularly in AWS, which saw a 37% revenue increase and a 64% rise in operating income. Despite negative free cash flow and high capital intensity, the report indicated strong AI demand. However, current valuations reflect much of this positive outlook, leaving little margin for safety.

TL;DR

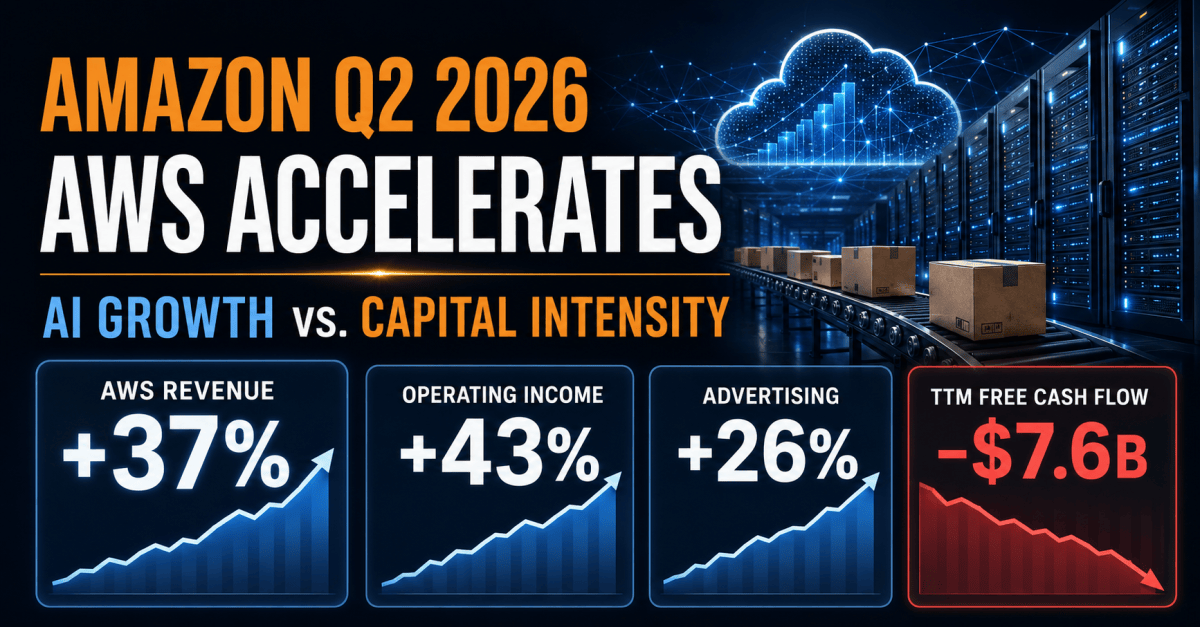
Amazon (AMZN:NASDAQ) Q2 2026 results materially strengthened its growth thesis. AWS revenue accelerated 37%, AWS operating income jumped 64%, advertising grew 26%, and all three operating segments remained profitable. More importantly, AWS achieved this growth while expanding its operating margin to 39.4%.

The principal concern has shifted. The question is no longer whether Amazon has genuine AI demand; its disclosed revenue, customer spending and multiyear commitments provide convincing evidence that it does. The unresolved question is whether the returns generated by Amazon’s enormous infrastructure build will ultimately justify its capital intensity.

After Amazon shares closed at $271.58 following a 15.25% post-earnings rise, much of the improved outlook appears reflected in the price. Our probability-weighted fair value is approximately $275 per share, leaving little margin of safety.

Amazon Q2 2026 Earnings Recap

Amazon reported net sales of $200.6 billion, an increase of 20% year over year. Operating income advanced 43% to $27.5 billion, lifting the consolidated operating margin from 11.4% to 13.7%.

Reported net income reached $62.6 billion, equivalent to diluted EPS of $5.75. However, this included $53.4 billion of non-operating pre-tax income, primarily associated with Amazon’s investment in Anthropic. This gain should not be treated as recurring operating earnings.

The operating performance was nevertheless exceptionally strong.

  • North American sales increased 16% to $116.2 billion, with operating income rising to $9.1 billion.
  • International sales grew 15% to $42.2 billion and generated $1.7 billion of operating income.
  • AWS revenue surged 37% to $42.2 billion, while operating income increased 64% to $16.6 billion.
  • Advertising revenue grew 26% to $19.8 billion.

Amazon also guided for Q3 net sales of $197 billion to $202 billion and operating income of $22.5 billion to $26.5 billion.

AWS Changes the AI Investment Debate

AWS was the defining feature of the quarter.

Its 37% revenue growth represented a sharp acceleration, while its operating margin expanded from 32.9% to 39.4%. AWS accounted for only around 21% of Amazon’s consolidated sales but approximately 60% of segment operating income.

This matters because Amazon did not have to sacrifice current AWS profitability to achieve faster AI-driven growth. Revenue growth and margin expansion occurred simultaneously.

Amazon also disclosed tangible evidence that its AI infrastructure is already being monetized:

  • The AWS AI business exceeded a $25 billion annual revenue run rate.
  • Amazon’s chips business also exceeded a $25 billion annual revenue run rate.
  • Both businesses were growing at triple-digit year-over-year rates.
  • Anthropic and OpenAI entered multiyear, multigigawatt Trainium commitments.
  • Graviton revenue commitments nearly tripled quarter over quarter.
  • Bedrock customer spending during Q2 exceeded spending across all previous quarters combined.

These disclosures do not guarantee attractive long-term returns, but they reduce the risk that Amazon is building AI infrastructure without corresponding customer demand.

The Cost of Capturing That Demand

The strength of AWS comes with an increasingly capital-intensive financial structure.

Trailing operating cash flow grew 33% to $161.4 billion. However, net property and equipment investment reached approximately $169 billion, causing trailing free cash flow to fall from positive $18.2 billion to negative $7.6 billion.

Amazon is therefore investing more in infrastructure than its entire business currently generates in operating cash.

That does not automatically make the investment uneconomic. Amazon may be deliberately sacrificing current free cash flow to build capacity that will generate revenue for many years. But the required financial outcome is demanding.

The new capacity must:

  • Reach high utilization relatively quickly;
  • Produce sufficient revenue to absorb depreciation, energy and operating costs;
  • Maintain competitive pricing against other cloud platforms;
  • Avoid becoming economically obsolete as AI chips and models improve; and
  • Generate returns above Amazon’s cost of capital.

Capital expenditure is an upfront cash outflow, while depreciation appears gradually after assets enter service. Current AWS margins may therefore not yet reflect the complete accounting cost of Amazon’s latest infrastructure investments.

SWOT Analysis

Amazon’s Q2 results present a fundamentally positive growth picture, but one that remains financially conditional.

Strengths

  • AWS has regained powerful momentum. Revenue rose 37%, while operating income grew even faster at 64%.
  • AWS growth and profitability improved together. Its 39.4% operating margin demonstrates strong current utilization and operating leverage.
  • AI demand is already measurable. Amazon disclosed substantial AI and chip revenue, rapidly rising Bedrock spending and multiyear infrastructure commitments.
  • Amazon controls more of the AI stack. Trainium, Graviton, Bedrock and AWS allow it to participate across chips, computing and enterprise AI deployment.
  • Advertising provides another high-growth earnings engine. Its 26% growth should support Amazon’s revenue mix and consolidated profitability.
  • Retail is no longer merely consuming AWS profits. North America and International produced a combined $10.8 billion of quarterly operating income.

Weaknesses

  • Free cash flow has turned negative. Infrastructure investment has grown faster than operating cash generation.
  • Capital intensity is exceptionally high. Amazon must earn significant incremental profit simply to justify the capital being committed.
  • AWS remains disproportionately important to group earnings. A five-percentage-point decline in AWS margin would reduce annualized operating income by approximately $8.4 billion at its current revenue run rate.
  • Reported EPS does not represent recurring earning power. The Anthropic investment gain substantially inflated Q2 net income.
  • International retail margins remain thin. Its operating margin stayed at 4.1% despite 15% sales growth.

Opportunities

  • Additional capacity could unlock AWS demand that Amazon cannot currently serve.
  • Trainium could strengthen AWS differentiation while lowering computing costs.
  • Bedrock can become an enterprise distribution layer for multiple competing AI models.
  • Advertising can continue shifting Amazon toward higher-margin service revenue.
  • AI and automation can improve shopping conversion, advertising efficiency and fulfillment productivity across Amazon’s existing scale.

Threats

  • AI demand may not absorb the installed capacity at attractive prices.
  • Rising depreciation could reverse recent AWS margin expansion.
  • Rapid hardware improvements could shorten the useful economic life of current assets.
  • Cloud competition could produce high revenue growth but inadequate returns on capital.
  • Large AI customers may gain substantial pricing power.
  • Energy, chip and construction constraints could delay the conversion of investment into revenue.

How Investors Reacted

Amazon shares closed at $271.58 on July 31, rising 15.25% in the first full trading session following the announcement.

The regular-session move confirmed the initially positive after-hours reaction. Investors did not merely react to the headline EPS, which was distorted by the Anthropic investment gain. The more economically relevant development was that AWS produced faster growth, higher operating income and substantial margin expansion while Amazon demonstrated measurable AI demand.

The market also appeared willing to look through negative free cash flow because Amazon’s current demand indicators made the infrastructure expansion more credible.

However, a positive business development and an attractive stock price are not necessarily the same thing. The post-earnings repricing has already incorporated a significant portion of the improved outlook.

Amazon Valuation Scenarios

Because current free cash flow is distorted by the infrastructure investment cycle, we valued Amazon using normalized 2027 operating earnings. The Anthropic investment gain was excluded from recurring earnings.

Bear case: $175 per share — 25% probability

AWS continues growing but decelerates, while its operating margin falls to 32% as depreciation and infrastructure expenses catch up with investment.

This scenario assumes Amazon generates approximately $102.5 billion of normalized operating income and earns around $7.15 per share after tax. Applying a 24-times multiple produces a target of approximately $175.

The bear case does not require AWS revenue to decline. It reflects the risk that Amazon achieves growth without earning sufficient returns on the capital required to support it.

Base case: $280 per share — 55% probability

AWS reaches approximately $230 billion of 2027 revenue and maintains a normalized operating margin of 36%. Advertising and retail efficiency support moderate improvement in the remainder of Amazon.

Normalized EPS reaches approximately $9.25. Applying a 30-times multiple produces a target price of approximately $280.

This scenario assumes successful AI monetization but also recognizes that depreciation and rising capital intensity could prevent AWS margins from remaining at Q2’s exceptional level.

Bull case: $385 per share — 20% probability

AWS reaches approximately $260 billion of revenue while sustaining a 39% operating margin. Advertising, retail efficiency and a richer service mix lift profitability across the rest of Amazon.

Normalized EPS rises to approximately $11.35. A 34-times multiple produces a target of approximately $385.

This outcome requires several favorable conditions to occur together: sustained AI demand, high infrastructure utilization, successful proprietary-chip adoption and continued margin improvement outside AWS.

Valuation Verdict

Weighting the three scenarios produces an estimated fair value of approximately $275 per share.

Against the July 31 closing price of $271.58, Amazon trades only around 1% below our probability-weighted valuation. That is effectively fair value, not a meaningful margin of safety.

Potential entry levels are:

  • Below $240: a modest discount of around 13% to estimated fair value;
  • Around $220: approximately a 20% margin of safety; and
  • Around $205: approximately a 25% margin of safety.

Amazon’s business-thesis risk declined after Q2 because AWS supplied stronger evidence of AI demand and monetization. Its valuation risk, however, increased after the share-price surge.

Investor Takeaway

Amazon’s Q2 report answered one of the most important questions surrounding the AI infrastructure cycle: there is substantial real demand behind its investment. AWS is growing faster, earning higher margins and securing long-term customer commitments.

What the quarter did not prove is that the full infrastructure build will generate attractive returns throughout the cycle. Negative free cash flow, rising depreciation and the possibility of technological obsolescence remain central risks.

For a Type 1 growth investor, Amazon remains one of the strongest large-scale vehicles for cloud and enterprise AI adoption. At approximately $272, however, investors are already paying for a considerable amount of that success.

The central conclusion is simple: Q2 made Amazon a stronger company, but the post-earnings rally prevented it from becoming an obviously cheaper stock.

Disclaimer

This article is for informational and educational purposes only. It does not constitute financial advice, investment advice or a recommendation to buy or sell any security. Valuation estimates and scenario probabilities are based on assumptions that may prove incorrect. Investors should conduct their own research and consider their financial objectives, risk tolerance and circumstances before making investment decisions.
Microsoft FY2026 Q4 Earnings: Azure Accelerates—but Can AI Returns Outrun the Capex?

Microsoft’s FY2026 results showcased robust growth, with quarterly revenue up 18% to $90 billion and Azure revenue soaring by 43%. The company reported $678 billion in commercial remaining performance obligations, reflecting strong future demand. However, concerns remain about rising capital expenses and declining margins, making sustained profitability a key focus for FY2027.

TL;DR Summary

Microsoft (MSFT:NASDAQ) ended FY2026 with accelerating cloud growth, rapidly expanding contracted demand and the clearest evidence yet that its enormous AI investment is translating into revenue.

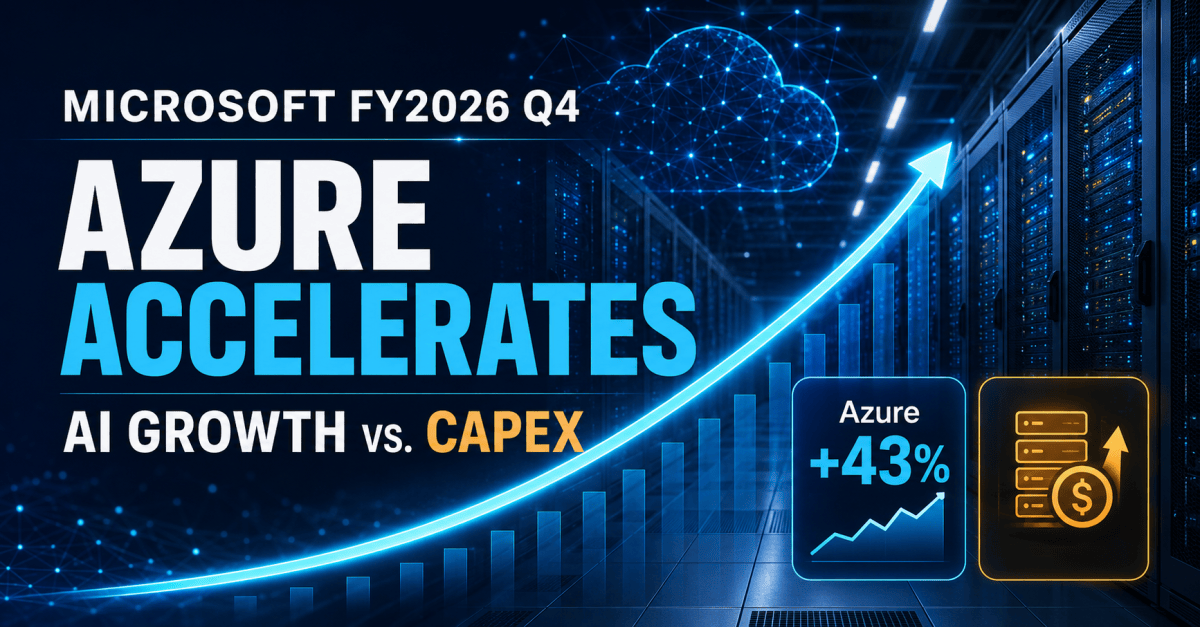
Quarterly revenue rose 18% to $90.0 billion, operating income increased 18% to $40.6 billion and Azure growth accelerated to 43%. Microsoft Cloud revenue reached $59.3 billion, while commercial remaining performance obligations surged 84% to $678 billion. Microsoft 365 Copilot also surpassed 30 million paid seats.

The market responded strongly. Microsoft shares rose approximately 8–9% in pre-market trading following the report. External market coverage largely attributed the reaction to faster-than-expected Azure growth, stronger forward guidance and the absence of another unexpected increase in underlying capital-spending expectations.

However, the investment case is not free of tension. Microsoft Cloud gross margin declined from 68% to 65%, while annual additions to property and equipment nearly doubled to $115.9 billion. The company is clearly monetizing AI, but it must still prove that revenue growth can outrun depreciation and infrastructure costs over a complete investment cycle.

Our probability-weighted valuation produces an estimated fair value of approximately $501 per share, compared with a pre-market reference price near $426. That suggests around 18% potential upside, but only a moderate margin of safety.

Quarter Recap

Microsoft delivered quarterly revenue of $90.0 billion, an increase of 18% year over year. Operating income rose at the same 18% rate to $40.6 billion.

GAAP net income increased 31% to $35.8 billion, while diluted EPS rose 32% to $4.81. These figures were affected by changes in the value of Microsoft’s AI investments and several discrete quarterly items, including a $3.2 billion Anthropic investment gain. Excluding the impact of OpenAI investments, net income increased 22% to $35.3 billion and diluted EPS reached $4.74.

The operating performance was led by Intelligent Cloud:

  • Intelligent Cloud revenue increased 32% to $39.3 billion.
  • Azure and other cloud-services revenue grew 43%.
  • Productivity and Business Processes revenue increased 14% to $37.8 billion.
  • Microsoft 365 Commercial cloud revenue increased 14%, or 16% after adjusting for a prior-year revenue-recognition comparison.
  • More Personal Computing revenue declined 4% to $12.9 billion.
  • Windows OEM and Devices revenue fell 7%, while Xbox content and services revenue declined 10%.

For the full year, Microsoft generated $331.8 billion in revenue and $155.2 billion in operating income, representing growth of 18% and 21%, respectively. Azure annual revenue exceeded $100 billion for the first time.

These results show that Microsoft is no longer relying on expectations of future AI monetization alone. Azure, Copilot and contracted cloud demand are already contributing at sufficient scale to affect the company’s overall growth.

Key Highlights

Azure growth accelerated

Azure and other cloud-services revenue increased 43%, making it the most important operating figure in the quarter.

The acceleration matters because Microsoft has committed extraordinary amounts of capital to cloud and AI capacity. Faster Azure growth provides evidence that the investment is generating revenue rather than merely enlarging the company’s cost base.

The result also suggests that AI demand is adding to Microsoft’s established cloud business rather than simply shifting existing workloads from conventional computing to more expensive infrastructure.

Contracted demand expanded dramatically

Commercial remaining performance obligations increased 84% to $678 billion.

RPO does not convert immediately into recognized revenue, and the timing of large contracts can make quarterly comparisons uneven. Nevertheless, the scale of the increase provides substantial forward visibility and shows that customers are making long-term commitments to Microsoft’s cloud ecosystem.

This backlog helps reduce the risk that Microsoft is constructing infrastructure purely in anticipation of demand that has not yet materialized.

Copilot adoption became financially meaningful

Microsoft 365 Copilot surpassed 30 million paid seats.

The figure does not reveal average revenue per user, deployment depth or whether adoption is broad across each customer organization. It nevertheless moves Copilot beyond the pilot-stage narrative. Microsoft now has a commercially meaningful installed base from which it can expand usage and revenue.

For Type 1 growth investors, the next question is whether Copilot becomes an additional premium revenue layer or mainly supports retention within the existing Microsoft 365 franchise.

Cash generation remained strong, but capital intensity increased sharply

Quarterly operating cash flow rose to $55.4 billion from $42.6 billion. Full-year operating cash flow reached $182.9 billion.

However, additions to property and equipment increased to $35.8 billion for the quarter and $115.9 billion for the full year. The annual figure was substantially above the previous year’s $64.6 billion.

Microsoft therefore remains highly cash-generative, but much more of that cash must now be reinvested before it becomes available to shareholders. This makes operating cash flow alone an incomplete measure of AI economics.

Cloud margins remain the main financial pressure point

Microsoft Cloud gross margin declined from 68% to 65%.

The decline does not invalidate the growth thesis. It reflects, at least partly, the cost of bringing large amounts of new AI capacity online before that capacity reaches mature utilization.

Nevertheless, the margin decline establishes the key test for FY2027: Microsoft must demonstrate that higher Azure and Copilot revenue can eventually absorb depreciation, energy, hardware and data-centre costs.

The market reaction represented a positive expectations reset

Microsoft shares initially rose after the release, with the gain expanding to approximately 8–9% in pre-market trading (as of time of writing).

The move carried the stock well above its pre-earnings trading range, indicating more than routine relief. External coverage attributed the reaction principally to strong Azure growth, encouraging forward guidance and maintained underlying capital-spending expectations. The market appeared to reward Microsoft for showing improving AI monetization without introducing another negative spending surprise.

SWOT Analysis

Strengths

  • Azure is growing at sufficient scale to move Microsoft’s consolidated results. Azure growth of 43% helped Intelligent Cloud revenue rise 32% and segment operating income increase from $12.1 billion to $16.0 billion. This shows that AI infrastructure demand is contributing to real operating earnings, not merely creating a promising revenue pipeline.
  • Microsoft possesses one of the strongest enterprise distribution systems in technology. Azure, Microsoft 365, Dynamics, GitHub, security products and Copilot are already embedded in customer workflows. Microsoft can distribute AI through existing contracts and relationships rather than acquiring every customer from scratch.
  • The $678 billion commercial RPO provides unusual revenue visibility. The 84% increase strengthens the argument that infrastructure expansion is supported by contracted demand. Even allowing for long-duration agreements and timing effects, the backlog materially reduces near-term demand uncertainty.
  • Cash generation provides strategic endurance. Microsoft generated $182.9 billion in full-year operating cash flow while continuing to return capital to shareholders. Few competitors can fund infrastructure, foundation-model partnerships, product development and shareholder distributions simultaneously at this scale.

Weaknesses

  • AI growth is becoming considerably more capital-intensive. Annual property-and-equipment additions increased to $115.9 billion. This creates a widening difference between reported earnings and the cash economically available after infrastructure investment.
  • Cloud gross margin has declined. Microsoft Cloud gross margin fell three percentage points to 65%. If depreciation and operating costs rise faster than utilization, Azure’s rapid revenue growth may not translate proportionally into free cash flow.
  • Headline earnings contain investment-related noise. The Anthropic gain and changes in the value of Microsoft’s OpenAI investments make GAAP EPS less representative of underlying operating performance. Investors should focus on normalized operating earnings rather than applying a valuation multiple mechanically to reported EPS.
  • Parts of the portfolio remain weak. More Personal Computing revenue declined 4%, including a 7% fall in Windows OEM and Devices and a 10% decline in Xbox content and services. These businesses are no longer central to the growth thesis, but their weakness reduces diversification outside cloud and enterprise software.

Opportunities

  • Copilot can become a new premium revenue layer. More than 30 million paid Microsoft 365 Copilot seats provide a sizeable commercial base. If deployment expands within existing customers, Microsoft can grow revenue without having to create an entirely new distribution channel.
  • Azure could benefit from a sustained AI-compute shortage. If customer demand continues to exceed available capacity, newly deployed infrastructure may achieve high utilization relatively quickly. That would improve revenue growth and eventually support better incremental margins.
  • Microsoft can monetize AI across several layers of the technology stack. The company participates in infrastructure, model access, development tools, productivity software, cybersecurity and business applications. This allows it to capture value regardless of which specific AI interface or model becomes dominant.
  • Operating leverage could return after the investment phase. If revenue from existing AI capacity continues expanding while the rate of new infrastructure growth eventually moderates, depreciation and operating expenses would represent a smaller share of revenue. That would strengthen both earnings and free-cash-flow conversion.

Threats

  • Infrastructure spending may outrun monetization. The primary risk is not a lack of AI demand today. It is that Microsoft continues adding capacity faster than customers generate profitable workloads, leaving the company with lower utilization and structurally weaker returns on capital.
  • Depreciation pressure may arrive after the revenue celebration. Infrastructure costs are recognized over time. Current operating margins may therefore understate the full expense associated with the recent capital buildout.
  • Competition could limit AI pricing power. Amazon, Google, OpenAI, Anthropic and open-source models are competing across infrastructure and applications. Strong usage growth would not guarantee attractive returns if model and compute prices decline rapidly.
  • Copilot adoption may not equal deep usage. Paid seats demonstrate commercial progress, but Microsoft has not yet provided enough information to determine usage intensity, renewal behaviour or the incremental profitability of those seats.
  • The valuation still requires sustained execution. Even after normalizing earnings, Microsoft remains priced as a high-quality growth company. Any material slowdown in Azure, weakness in Copilot expansion or further cloud-margin pressure could cause both earnings estimates and the valuation multiple to decline.

Valuation Scenarios

Because Microsoft’s GAAP EPS includes gains and losses from AI investments and other discrete items, our valuation begins with approximately $16.80 of normalized FY2026 operating EPS. The scenarios then apply different FY2027 growth rates and forward earnings multiples.

Bear Case — $388 per share

  • Normalized EPS increases approximately 10% to $18.48.
  • Azure growth moderates as comparisons become more difficult.
  • Higher depreciation and infrastructure expenses continue pressuring cloud margins.
  • Investors assign a 21-times forward P/E multiple.
  • Estimated value: approximately $388 per share.

This case represents roughly 9% downside from the $426 pre-market reference price. It does not require a collapse in Microsoft’s business. Slower earnings growth and weaker cash conversion would be sufficient.

Base Case — $504 per share

  • Normalized EPS increases approximately 20% to $20.16.
  • Azure and AI demand remain strong enough to support high-teens to 20% earnings growth.
  • Copilot adoption becomes increasingly visible in revenue but does not transform the company’s overall growth rate immediately.
  • Infrastructure costs remain manageable as utilization improves.
  • Investors apply a 25-times forward P/E multiple.
  • Estimated value: approximately $504 per share.

This scenario requires Microsoft to convert its backlog and AI demand into earnings without allowing depreciation and infrastructure costs to overwhelm operating leverage.

Bull Case — $609 per share

  • Normalized EPS increases approximately 25% to $21.00.
  • AI capacity remains supply-constrained because demand continues expanding rapidly.
  • Copilot adoption accelerates across Microsoft’s installed enterprise base.
  • Revenue growth absorbs infrastructure costs, allowing operating leverage to re-emerge.
  • Sustained AI monetization supports a premium 29-times forward P/E multiple.
  • Estimated value: approximately $609 per share.

The bull case requires evidence that Microsoft is building a durable, high-margin AI platform rather than simply benefiting from the early stages of an infrastructure investment cycle.

Probability-Weighted Fair Value

We assign a 25% probability to the bear case, 50% to the base case and 25% to the bull case.

This produces a probability-weighted fair value of approximately $501 per share.

Compared with the pre-market reference price near $426:

  • Estimated upside to fair value is approximately 18%.
  • The stock trades around 21 times our base-case FY2027 normalized EPS.
  • The price is above the bear-case value but remains materially below the base-case estimate.

These values are scenario estimates based on earnings-growth and valuation-multiple assumptions. They are not precise forecasts.

Verdict

Microsoft’s FY2026 Q4 report materially strengthened the Type 1 growth thesis.

Azure growth accelerated to 43%, annual Azure revenue exceeded $100 billion, commercial RPO reached $678 billion and Microsoft 365 Copilot surpassed 30 million paid seats. Together, these figures provide stronger evidence that Microsoft is converting AI investment into revenue and contracted customer demand.

The quarter does not eliminate the capital-spending risk. Microsoft Cloud gross margin has declined, annual infrastructure additions have nearly doubled and the associated depreciation burden will continue moving through the income statement. The most important question for FY2027 is therefore not whether Microsoft can generate AI growth. It is whether that growth can produce attractive incremental returns after accounting for the full infrastructure cost.

At approximately $426, the stock appears reasonably attractive for a Type 1 investor. Our $501 probability-weighted fair value indicates worthwhile potential upside, but the margin of safety is moderate rather than exceptional. Investors are still relying on sustained Azure growth, deeper Copilot monetization and eventual improvement in infrastructure economics.

Microsoft has presented some of the strongest evidence in the market that AI spending can produce commercial returns. It must now show that those returns belong primarily to shareholders—and not only to the suppliers financing the infrastructure buildout.

Call to Action

Do you believe Microsoft’s 43% Azure growth and $678 billion commercial backlog justify the scale of its AI investment, or will depreciation and infrastructure costs eventually catch up with the growth?

Follow SWOTstock for independent, evidence-based earnings analysis built around company disclosures, business drivers and valuation scenarios.

Disclaimer

This article is for informational and educational purposes only and does not constitute investment advice, a recommendation or an offer to buy or sell securities. The valuation scenarios are based on assumptions and independent analytical judgment. Actual results and market prices may differ materially. Investors should conduct their own research and consider their objectives, financial circumstances and risk tolerance before making investment decisions.


ServiceNow Q2 2026: AI Momentum Strengthens, but Organic Growth Still Needs Scrutiny

TL;DR Summary

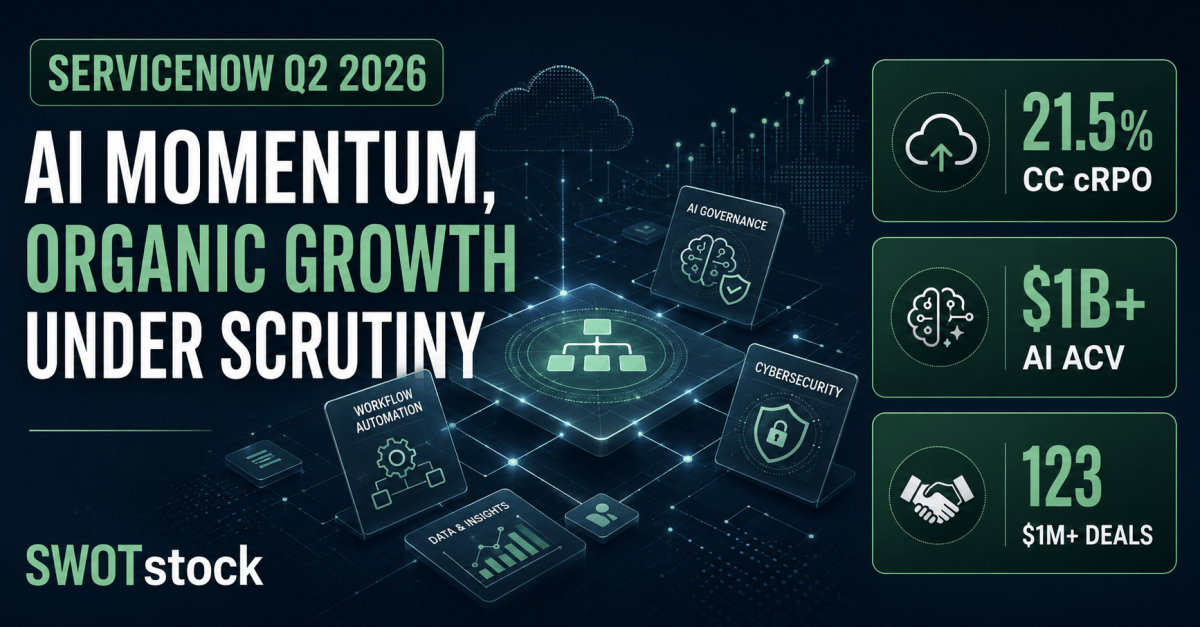
ServiceNow (NOW:NYSE) delivered a stronger-than-expected second quarter, supported by 21.5% constant-currency cRPO growth, accelerating large transactions and AI annual contract value exceeding $1 billion. The report materially weakened the most bearish argument that artificial intelligence is already eroding ServiceNow’s competitive position.

The results were not unambiguously bullish, however. Acquisitions contributed meaningfully to reported growth, part of the revenue outperformance came from business moving forward from Q3, and AI infrastructure costs pressured gross-margin guidance.

Using dilution-adjusted owner earnings and three valuation scenarios, SWOTstock estimates ServiceNow’s probability-weighted fair value at approximately $113 per share. Against the pre-earnings closing price of $95.46, the shares appeared moderately undervalued—but without a large margin of safety.

Quarter Recap

ServiceNow reported Q2 2026 subscription revenue of $3.877 billion, increasing 24.5% as reported and 23% in constant currency. Total revenue reached $3.987 billion, representing 24% reported growth and 22.5% constant-currency growth.

The more important forward-looking indicator was current remaining performance obligations, or cRPO. ServiceNow ended the quarter with $13.20 billion of cRPO, up 21% as reported and 21.5% in constant currency. This exceeded management’s previous 19.5% constant-currency guidance by approximately 200 basis points.

Approximately 125 basis points of Q2 cRPO growth came from Armis. Subtracting that disclosed contribution produces an estimated ex-Armis growth rate of approximately 20.25%. This is not a complete organic-growth calculation because ServiceNow did not separately disclose the contribution from every acquisition, but it suggests that the underlying platform remained healthy during the quarter.

ServiceNow also reported $29 billion of total remaining performance obligations, up 22% in constant currency, while its subscription renewal rate remained 98%.

Key Highlights

The quarter provided stronger commercial evidence than a simple revenue beat. Large contracts increased, AI adoption became more measurable and operating profitability exceeded guidance.

  • ServiceNow completed 123 transactions above $1 million in net-new annual contract value, nearly 40% more than last year.
  • The company ended the quarter with 658 customers generating more than $5 million in ACV, approximately 23% more than a year earlier.
  • ServiceNow AI crossed $1 billion in ACV and remained on track to exceed $1.5 billion by the end of 2026.
  • Management reported that million-dollar AI transactions approximately tripled, while customers operating agentic AI in production increased ninefold over nine months.
  • Approximately 50% of net-new business is now generated through non-seat-based models, helping reduce ServiceNow’s dependence on the number of human software users.
  • Non-GAAP operating margin reached 29.5%, 300 basis points above guidance.
  • ServiceNow maintained its full-year non-GAAP operating-margin target of 31.5% and free-cash-flow margin target of 35%.

There were also important qualifications.

  • Management said approximately half the Q2 revenue outperformance came from strong federal demand that moved some on-premise subscription revenue from Q3 into Q2.
  • Full-year subscription-revenue guidance was increased only modestly to $15.760–$15.780 billion.
  • Subscription gross-margin guidance was reduced from 81.5% to 81%, reflecting greater hyperscaler usage and accelerating AI consumption.
  • Q3 cRPO guidance is 20% in constant currency, including approximately 150 basis points from Armis. The estimated Q3 growth rate excluding Armis is therefore closer to 18.5%.

The quarter was fundamentally bullish, but it did not prove that ServiceNow’s organic growth is reaccelerating beyond 20%.

SWOT Analysis

The following price-impact ranges estimate how individual developments could affect ServiceNow’s shares over approximately 12–18 months. They are scenario sensitivities and should not be added together mechanically.

Strengths

ServiceNow’s core strengths remain its high customer retention, deeply embedded workflows and ability to expand relationships across multiple enterprise functions.

  • Strong contracted demand: potential price impact of +8% to +15%. Constant-currency cRPO growth reached 21.5%, while the estimated result excluding Armis remained approximately 20.25%.
  • Large-deal momentum: potential price impact of +5% to +10%. Transactions exceeding $1 million in net-new ACV increased nearly 40%, supporting the quality of the cRPO result.
  • Measurable AI monetization: potential price impact of +8% to +18%. AI ACV exceeded $1 billion, large AI transactions increased and more customers moved agentic applications into production.
  • Durable customer relationships: potential price impact of +5% to +10%. The 98% renewal rate indicates that customers are not broadly replacing ServiceNow with standalone AI platforms.
  • Strong operating leverage: potential price impact of +5% to +12%. The operating-margin beat and maintained full-year FCF-margin target demonstrate continued financial discipline.

Weaknesses

ServiceNow’s weaknesses center on the quality of reported growth, the difference between GAAP and non-GAAP profitability, and the economic cost of employee compensation.

  • Acquisition-supported growth: potential price impact of −8% to −15%. Estimated Q3 cRPO growth falls from 20% to approximately 18.5% after removing the disclosed Armis contribution.
  • Limited guidance increase: potential price impact of −4% to −8%. The small full-year revenue increase suggests management is not extrapolating the entire Q2 outperformance.
  • Gross-margin pressure: potential price impact of −5% to −10%. AI adoption is increasing hyperscaler and consumption expenses before the full revenue benefit is visible.
  • High stock-based compensation: potential price impact of −10% to −18%. Q2 SBC reached $655 million, while management expects it to represent approximately 15% of full-year revenue.
  • Low GAAP operating margin: potential price impact of −5% to −12%. ServiceNow’s 4% GAAP operating margin was substantially below its 29.5% non-GAAP result.

Opportunities

ServiceNow’s principal opportunity is to become the governance and execution layer through which enterprises operate AI agents across different models, applications and infrastructure providers.

  • AI ACV exceeding $1.5 billion: potential price impact of +10% to +20%. Achieving this target would strengthen the case that AI is becoming a durable incremental revenue stream.
  • AI reaching 30% of total ACV by 2030: potential price impact of +20% to +35%. This would transform ServiceNow’s positioning from an incumbent adding AI features into a major enterprise AI platform.
  • Security expansion: potential price impact of +10% to +20%. The combination of AI Control Tower, Armis and Veza could establish a differentiated security, identity and connected-asset platform.
  • Non-seat-based monetization: potential price impact of +8% to +15%. Usage- and outcome-based revenue could offset slower growth in human software seats.
  • CRM and employee-workflow expansion: potential price impact of +8% to +18%. ServiceNow can increase its share of customer spending by expanding beyond its established IT workflow position.

Threats

The largest long-term threat is not necessarily immediate replacement by an AI model. It is the possibility that AI reduces human software usage while increasing ServiceNow’s delivery costs faster than new AI products generate revenue.

  • AI-driven seat compression: potential price impact of −20% to −35%. Fewer human users could weaken traditional subscription revenue before alternative pricing models become sufficiently large.
  • Organic growth falling below 15%: potential price impact of −20% to −30%. The current valuation still requires sustained double-digit owner-earnings growth.
  • Acquisition-integration problems: potential price impact of −15% to −25%. ServiceNow spent approximately $8.8 billion on acquisitions during the first half, increasing goodwill, acquired intangibles and debt.
  • AI costs rising faster than monetization: potential price impact of −10% to −20%. Continued gross-margin pressure would reduce the value of otherwise impressive AI ACV growth.
  • Growth-stock multiple compression: potential price impact of −15% to −25%. ServiceNow remains sensitive to discount rates and changes in investor appetite for enterprise software.

Valuation Scenarios

The valuation begins with ServiceNow’s official full-year guidance. Subscription revenue is expected to reach approximately $15.77 billion at the midpoint, while total revenue should be approximately $16.2 billion after including professional services.

A 35% non-GAAP FCF margin implies approximately $5.7 billion of reported free cash flow. However, stock-based compensation remains a genuine economic cost. Deducting estimated SBC produces normalized owner earnings of approximately $3.2–$3.3 billion, or around $3.10–$3.20 per diluted share.

Bear Scenario — $60

The bear scenario assumes that acquisition-adjusted growth moves toward the low teens, AI monetization does not fully offset seat pressure and ServiceNow receives a lower valuation multiple.

  • Starting owner earnings: approximately $3.0 billion
  • First five years’ growth: 10%
  • Following five years’ growth: 5%
  • Discount rate: 10%
  • Terminal growth: 3%
  • Probability: 20%
  • Estimated value: $60 per share

This represents approximately 37% downside from the $95.46 reference price.

Base Scenario — $105

The base scenario assumes that ServiceNow sustains mid-teens owner-earnings growth, AI becomes incrementally profitable and the company successfully integrates its acquisitions.

  • Starting owner earnings: approximately $3.25 billion
  • First five years’ growth: 15%
  • Following five years’ growth: 8%
  • Discount rate: 9%
  • Terminal growth: 3%
  • Probability: 50%
  • Estimated value: $105 per share

This represents approximately 10% upside from the reference price.

Bull Scenario — $163

The bull scenario assumes that ServiceNow sustains growth close to 20%, successfully monetizes AI at attractive margins and establishes its platform as the governance and action layer for enterprise AI.

  • Starting owner earnings: approximately $3.5 billion
  • First five years’ growth: 18%
  • Following five years’ growth: 10%
  • Discount rate: 8.5%
  • Terminal growth: 3.5%
  • Probability: 30%
  • Estimated value: $163 per share

This represents approximately 71% upside from the reference price.

Applying the assigned probabilities produces a probability-weighted fair value of approximately $113 per share.

Verdict

ServiceNow’s Q2 report materially improved the investment thesis. Contracted growth remained strong, large transactions accelerated and AI adoption produced measurable ACV rather than only product announcements or pilot activity.

The evidence also challenges the strongest version of the enterprise-software pessimism. Customers are not broadly leaving ServiceNow, the renewal rate remains high, and AI appears to be generating additional products and use cases. The company’s movement toward non-seat-based pricing also gives it a potential mechanism to monetize work performed by AI agents.

Nevertheless, the report did not remove every concern. Acquisitions contributed meaningfully to growth, underlying Q3 cRPO may remain in the high teens, AI is pressuring gross margin and SBC continues to absorb a significant portion of the economic value generated by the business.

At $95.46, ServiceNow appeared moderately undervalued, with approximately 18% potential appreciation to the $113 probability-weighted fair value. The corresponding margin of safety was approximately 16%.

That is sufficient to make the stock more interesting, but it is not yet a clear fat pitch. A price near $90 would offer approximately a 20% margin of safety, while a price around $79 would provide approximately 30%.

The appropriate conclusion is therefore:

ServiceNow remains a high-quality growth company whose Q2 results weakened the AI-disruption thesis. The valuation has become reasonable, but the stock still requires successful AI monetization and acquisition integration to generate substantial long-term upside.

Call to Action

Do you believe ServiceNow’s $1 billion of AI ACV proves that established enterprise-software platforms can benefit from AI, or does acquisition-supported growth still make the underlying picture too difficult to judge?

Share your view in the comments, and follow SWOTstock for independent, evidence-based earnings analysis.

Disclaimer

This article is for informational and educational purposes only and does not constitute investment advice, a recommendation or an offer to buy or sell securities. The valuation scenarios and estimated price impacts reflect judgment based on ServiceNow’s publicly available company materials and may not occur. Investors should conduct their own research and consider their financial circumstances, investment objectives and risk tolerance before making investment decisions.