TL;DR Summary
Intuit (INTU:NASDAQ) delivered solid Q2 FY2026 results with 17% revenue growth and reaffirmed full-year guidance. However, softer near-term profit expectations pressured the stock.
At roughly $400 per share, Intuit trades around 17x forward EPS — a valuation typically reserved for slower software companies. Based on management’s official guidance and structural economics, fair value appears closer to the $620–$690 range.
The key question: Is the market pricing in real structural risk — or overreacting to temporary guidance noise?
Quarter Recap
Intuit reported fiscal Q2 2026 revenue of approximately $4.65 billion, up 17% year-over-year. Non-GAAP EPS came in around $4.15, reflecting strong operating leverage.
Management reiterated full-year FY2026 guidance of roughly $21.0–$21.2 billion in revenue, implying 12–13% annual growth. Non-GAAP EPS guidance stands near $23.
The earnings headline was solid. The stock’s weakness was tied more to cautious short-term profit expectations related to tax-season investments than to any structural slowdown.
Key Highlights
- Revenue growth remains double-digit at scale
- High recurring subscription base continues expanding
- Gross margins remain around 80%
- Operating leverage intact
- AI initiatives (Intuit Assist and ecosystem automation) positioned as growth accelerators
- FY2026 revenue and EPS guidance reaffirmed
Nothing in the official release suggests moat erosion or structural decay.
SWOT Analysis
Intuit remains a high-margin ecosystem platform with durable recurring revenue. However, valuation compression reflects investor uncertainty around AI disruption and SMB macro sensitivity.
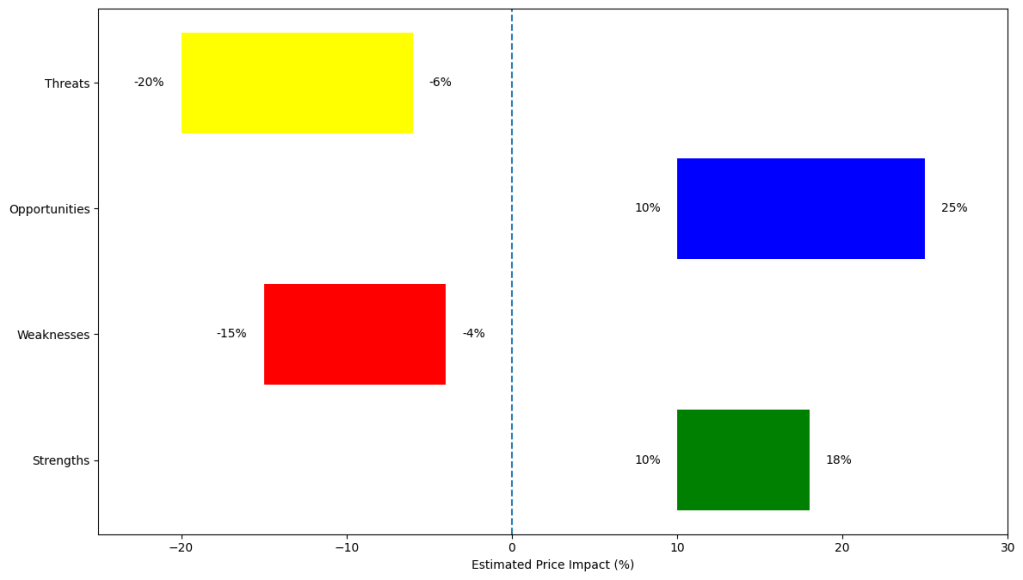
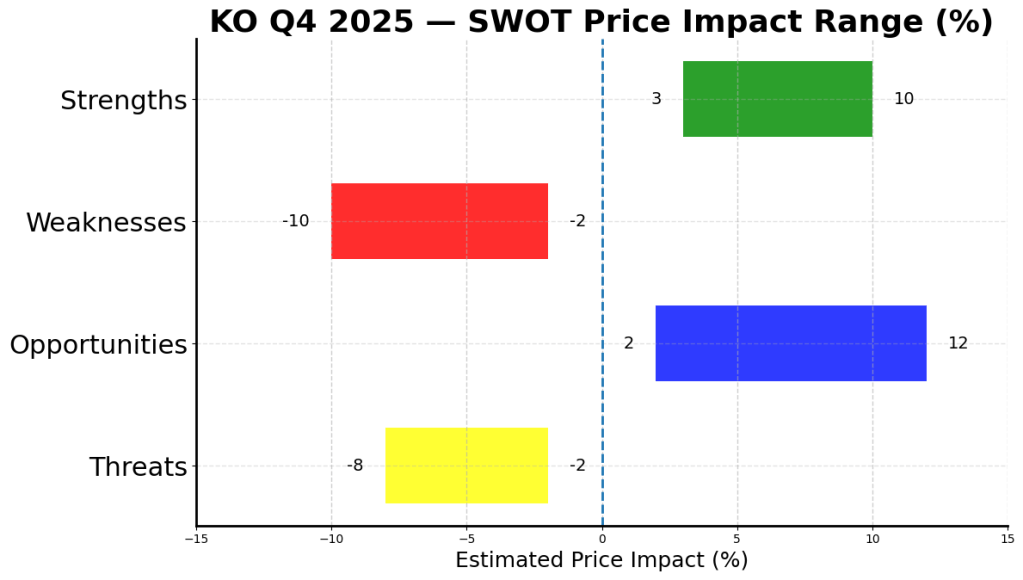
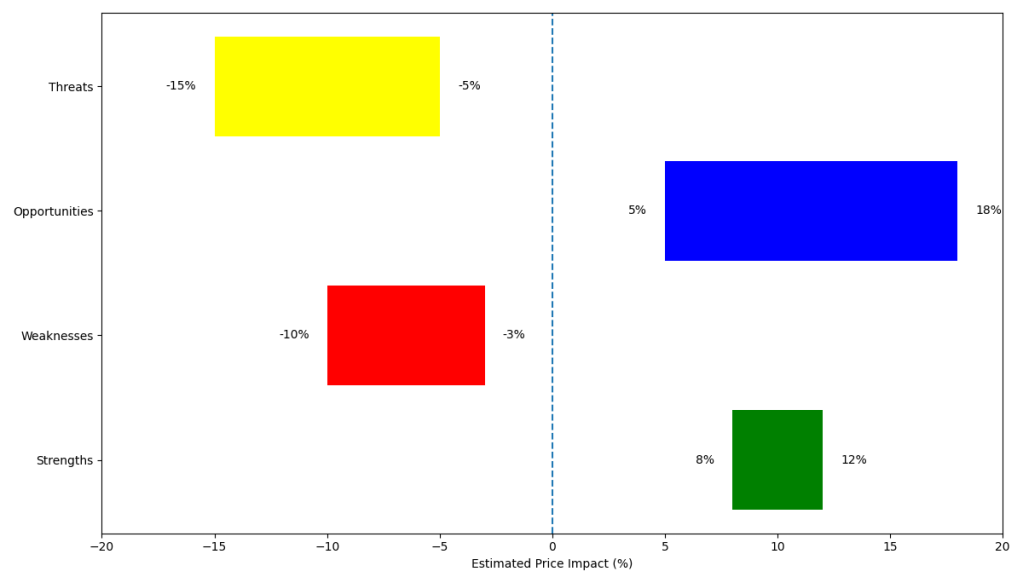
Strengths
- Recurring subscription ecosystem (QuickBooks, TurboTax, Credit Karma)→ Estimated price impact: +8% to +12%
- ~80% gross margins and operating leverage→ Estimated price impact: +5% to +8%
- Cross-sell opportunities across SMB financial stack→ Estimated price impact: +6% to +10%
Weaknesses
- Tax-season concentration and earnings seasonality→ Estimated price impact: -4% to -7%
- Premium historical valuation leaves little room for short-term misses→ Estimated price impact: -6% to -10%
- Integration risk from prior acquisitions→ Estimated price impact: -3% to -5%
Opportunities
- AI-driven ARPU expansion via Intuit Assist→ Estimated price impact: +10% to +18%
- Margin expansion through automation and scale→ Estimated price impact: +5% to +9%
- Mid-market expansion beyond core SMB→ Estimated price impact: +6% to +12%
Threats
- AI disruption in tax preparation and bookkeeping→ Estimated price impact: -8% to -15%
- SMB macro slowdown→ Estimated price impact: -6% to -12%
- Regulatory changes affecting tax complexity→ Estimated price impact: -5% to -10%
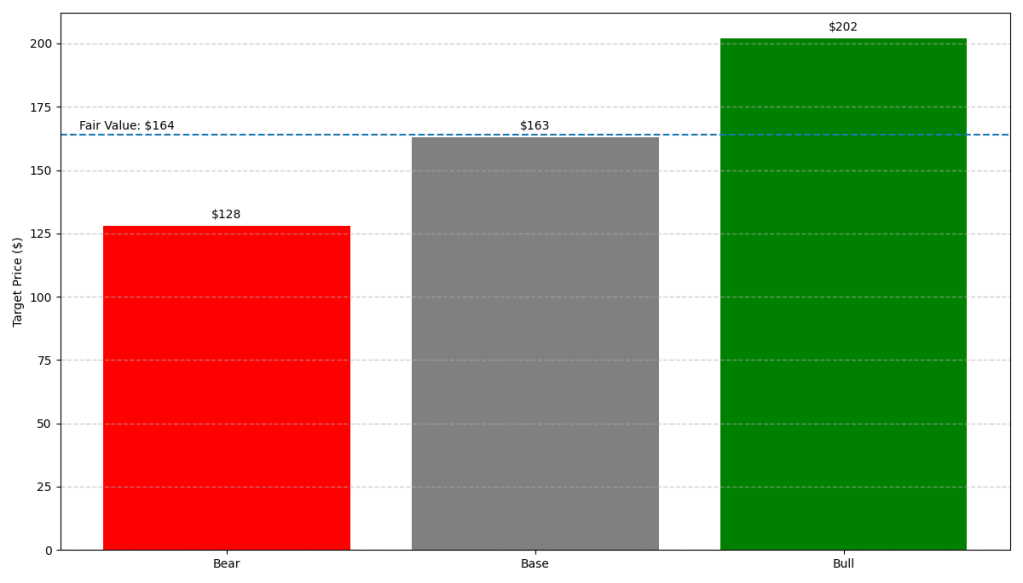
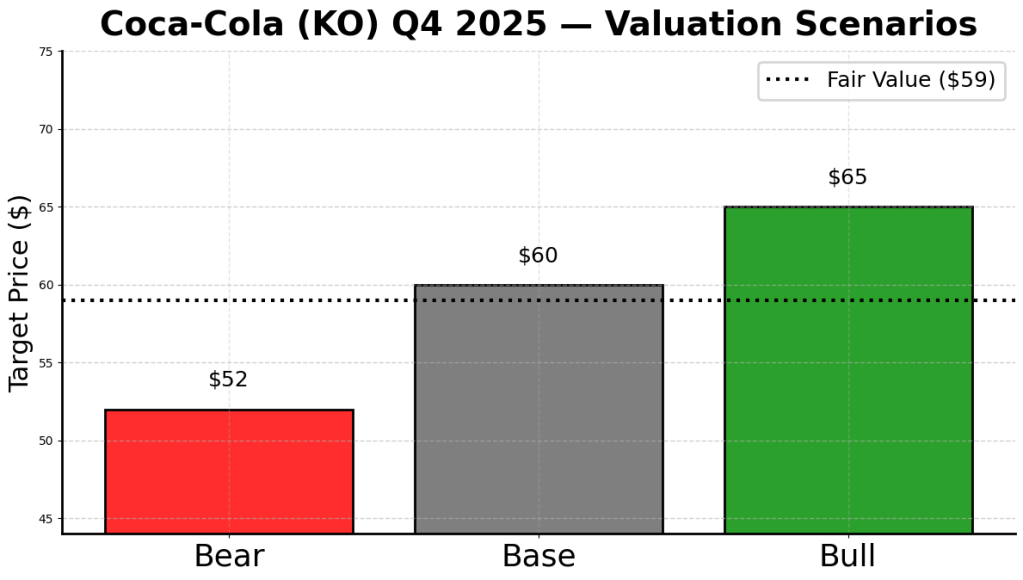
Valuation Scenarios
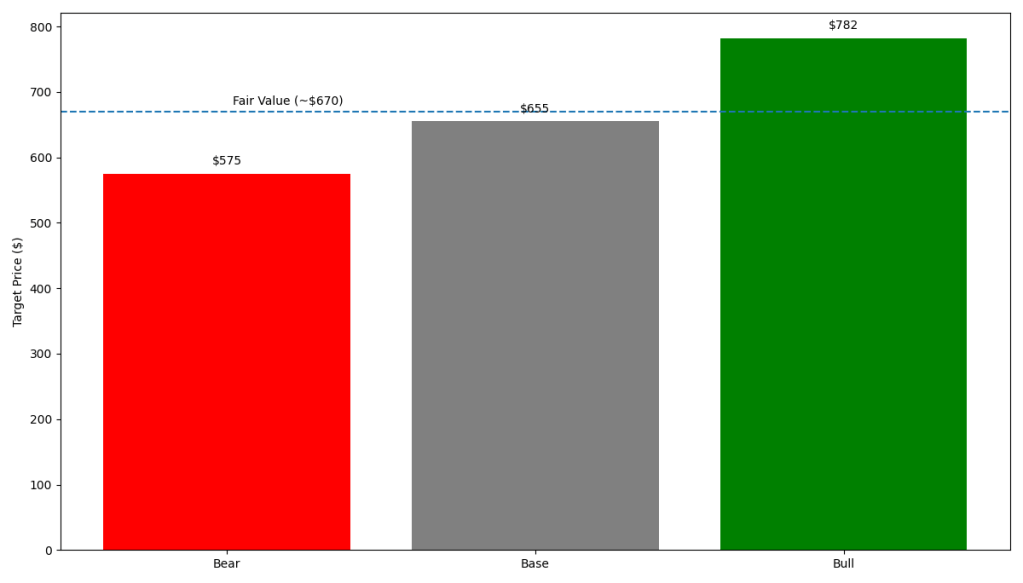
Using FY2026 midpoint EPS guidance of ~$23:
Bear Case
- Growth slows toward high single digits
- AI monetization underwhelms
- Forward multiple compresses to 25x
25 × $23 = $575
Probability: 25%
Base Case
- Revenue growth sustained at 12–14%
- AI supports retention but no explosive expansion
- Multiple stabilizes around 27–30x
27–30 × $23 = $621–$690
Probability: 50%
Bull Case
- AI meaningfully increases ARPU and operating leverage
- EPS growth accelerates toward mid-teens
- Multiple expands to ~34x
34 × $23 = $782
Probability: 25%
Probability-Weighted Fair Value
Approximately $655–$685 range, midpoint near $670.
Verdict
At roughly $390 per share, Intuit trades closer to a cyclical software multiple than to a durable compounding platform.
Management guidance does not indicate structural deterioration. The current price implies significant embedded risk.
For long-term growth investors who believe Intuit can maintain double-digit revenue growth and defend its ecosystem through AI enhancement, the risk-reward profile appears asymmetrically positive.
The debate is not about whether Intuit is high quality.
It is about whether the market is overpricing disruption risk.
Call to Action
If you found this analysis useful, follow SWOTstock for structured earnings breakdowns that combine qualitative moat analysis with valuation discipline.
Next up: Should Intuit be valued like a mature tax software company — or like a platform AI compounder?
Disclaimer
This analysis is for informational purposes only and does not constitute investment advice. All figures are based on official company reports and guidance. Investors should conduct their own due diligence before making investment decisions.