Bank of America Q1 2026 Earnings: Strong Quarter, But Is the Upside Already Priced In?

TL;DR Summary

Bank of America (BAC:NYSE) delivered a strong Q1 2026, with solid growth in net interest income, a rebound in investment banking, and stable credit quality. The market reacted positively, but not aggressively—because the key question hasn’t changed:

Is BAC a stable compounder deserving a higher multiple, or still a rate-sensitive cyclical bank?

Our probability-weighted valuation lands at ~$54, suggesting the stock is fairly valued today, with upside dependent on capital markets recovery and downside tied to credit normalization.


Quarter Recap

Bank of America opened 2026 with a quarter that looked stronger than many investors expected. Revenue reached $30.3 billion, up 7% year-over-year, while net income came in at $8.6 billion, translating into $1.11 EPS.

What stands out is not just the headline numbers, but the composition. Net interest income grew to $15.7 billion, signaling that the bank is still extracting value from its deposit base even in a maturing rate cycle. At the same time, capital markets activity showed clear signs of recovery, with investment banking fees and trading revenue both moving higher.

Underneath, credit quality remains controlled. Net charge-offs are still relatively low at 0.48% of loans, and capital remains strong with a CET1 ratio of 11.2%.

This is not a one-dimensional quarter—it’s a balanced earnings engine at work.


Key Highlights

The quarter tells a simple story: Bank of America is no longer relying on just one lever.

Net interest income continues to provide a stable base, while capital markets are beginning to add cyclical upside. Consumer banking and wealth management remain steady contributors, and the balance sheet continues to expand with loan growth holding firm.

At the same time, nothing in the quarter suggests excessive risk-taking. Credit remains benign, and capital levels leave room for continued shareholder returns.

That combination—growth without visible stress—is exactly what investors look for in a large-cap bank.


SWOT Analysis (with price impact ranges)

The real debate for Bank of America is not whether the business is performing—it clearly is. The question is how much of that performance is sustainable, and how the market should value it.

Strengths

Bank of America’s biggest strength today is the resilience of its earnings engine. Net interest income continues to grow despite concerns around peak rates, which suggests that its deposit franchise remains a structural advantage.

At the same time, the bank benefits from a highly diversified model. Consumer banking, wealth management, trading, and investment banking all contributed meaningfully in the quarter, reducing reliance on any single driver.

Finally, capital and credit remain solid. With a CET1 ratio above 11% and low charge-offs, the bank has both downside protection and flexibility to return capital.

Estimated price impact:
+3% to +10% across key strength drivers


Weaknesses

The core weakness is one that has always defined Bank of America: its sensitivity to interest rates. While that worked in its favor during rate hikes, it becomes a constraint if rates move lower more quickly than expected.

In addition, the bank’s scale creates structural inefficiencies. Large universal banks face higher fixed costs—technology, compliance, and operations—which limits operating leverage compared to smaller or more focused peers.

Estimated price impact:
-3% to -8%


Opportunities

The biggest opportunity lies in capital markets. The rebound in investment banking and trading activity in Q1 may be the early stages of a broader recovery cycle. If deal activity continues to improve, this could provide a meaningful boost to earnings beyond what is currently priced in.

At the same time, steady loan growth and a stable deposit base create a foundation for organic expansion without taking on excessive risk.

Estimated price impact:
+4% to +12%


Threats

The main risks are cyclical. Credit costs are currently low, but they are unlikely to stay there indefinitely. A normalization cycle could quickly pressure earnings if provisions rise faster than expected.

Macro uncertainty also remains a key factor. A combination of rate cuts and economic slowdown would hit both net interest income and loan growth at the same time.

Estimated price impact:
-5% to -12%

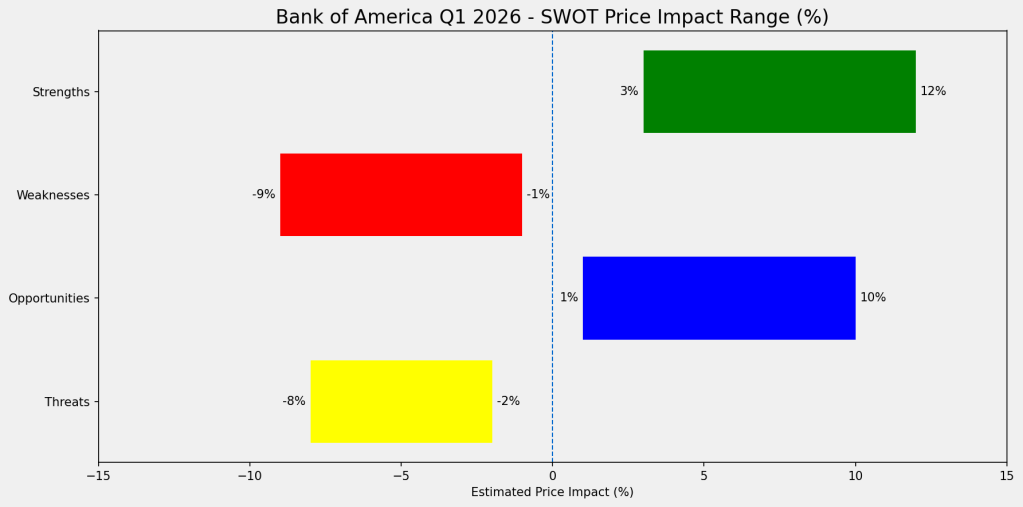
Bank of America Q1 2026 SWOT price impact chart showing strengths (+3% to +12%), weaknesses (-9% to -1%), opportunities (+1% to +10%), and threats (-8% to -2%) on a horizontal axis from -20% to +20%.
Bank of America’s valuation profile reflects balanced upside from capital markets and NII resilience, offset by downside risks from credit normalization and macro uncertainty.

Valuation Scenarios

The valuation comes down to how the market interprets this mix of strengths and risks.

Base Case (50%) — Stable but not re-rated

In the most likely scenario, Bank of America continues to deliver steady earnings with moderate growth. Net interest income stabilizes, capital markets gradually recover, and credit costs rise slightly but remain manageable.

Fair value: $52–$60


Bull Case (25%) — Earnings upgrades + multiple expansion

In a more optimistic scenario, capital markets rebound strongly and credit remains benign. The market begins to see Bank of America as a high-quality compounder rather than a cyclical bank, leading to both earnings upgrades and multiple expansion.

Fair value: $64–$75


Bear Case (25%) — Macro and credit pressure

In the downside scenario, rates fall faster than expected while credit costs rise. Earnings decline and the market applies a lower multiple, reflecting increased uncertainty.

Fair value: $32–$40


Probability-Weighted Valuation

Bringing these scenarios together results in a weighted fair value of approximately:

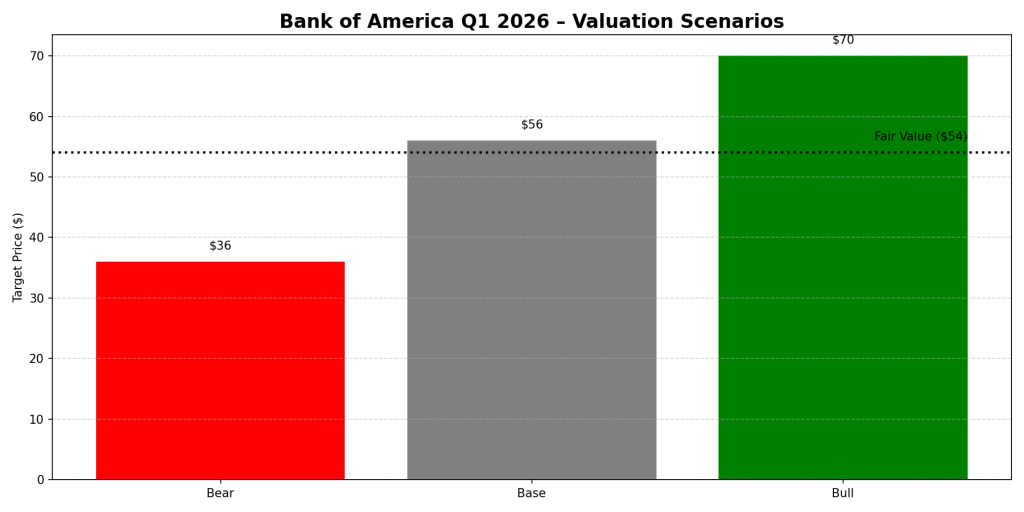
~$54 per share

At current levels, this suggests the stock is fairly valued, with limited margin of safety.

Bar chart showing Bank of America Q1 2026 valuation scenarios with bear case at $36, base case at $56, and bull case at $70, with a dotted fair value line at approximately $54.
Bank of America’s Q1 2026 valuation scenarios highlight a balanced risk-reward profile, with the current price near fair value, upside driven by capital markets recovery, and downside risk from credit normalization and macro uncertainty.

Verdict

Bank of America is executing well. The business is strong, diversified, and supported by solid capital and credit fundamentals.

But the stock is no longer cheap. The market is already pricing in a stable base case, leaving investors dependent on either a capital markets-driven upside surprise or exposed to a credit or macro-driven downside.

For value-oriented investors, this becomes a question of timing rather than conviction.


Call to Action

Would you buy Bank of America at $55, or wait for a better entry point closer to the downside scenario?

Let me know how you’re thinking about large-cap banks in this cycle.


Disclaimer

This analysis is for informational purposes only and does not constitute investment advice. All assumptions are based on Bank of America’s official earnings release and investor materials for Q1 2026. Investors should conduct their own research before making investment decisions.
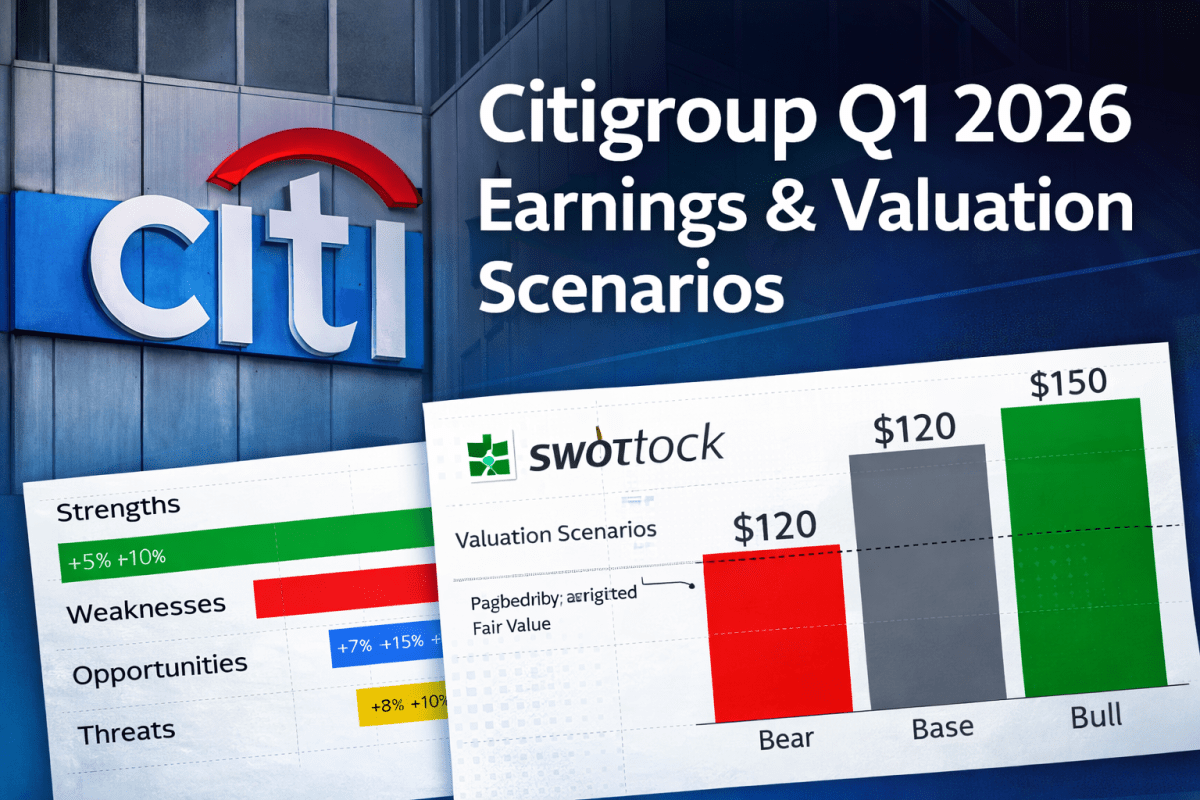
Citigroup Q1 2026 Earnings: The Turnaround Is Showing — But Is the Stock Already There?

TL;DR Summary

Citigroup (C:NYSE) delivered a strong quarter, with revenue up 14% and net income up 42%, showing real progress in its turnaround.

The stock responded positively — but at current levels, much of that improvement may already be priced in.

For value investors, Citi is no longer a deep discount. It’s now an execution story.


Quarter Recap

Citi’s Q1 2026 results were strong across the board, and importantly, not just in one area.

Revenue came in at $24.6 billion, up 14% year-over-year, while net income reached $5.8 billion. Earnings per share hit $3.06, supported by both improved operations and continued buybacks.

The strength was driven by Citi’s core institutional businesses. Services continued to deliver steady growth, while Markets saw a strong rebound, particularly in equities trading. These higher-quality businesses are increasingly shaping the bank’s earnings profile.

At the same time, weaker areas remain. U.S. Consumer Cards saw profits decline, and credit costs are beginning to normalize, which could become a headwind.


Market Reaction

The stock moved from around $126 before earnings to about $129.6 after, a gain of roughly 2.6%. It opened higher, traded up during the day, and held most of those gains into the close.

That kind of price action typically signals that investors not only reacted positively to the results, but also found them credible enough to hold positions rather than sell into strength.


Key Highlights

Citi’s strongest asset remains its Services business, which continues to generate stable growth and high returns.

Markets also delivered a strong quarter, showing Citi can still compete globally in trading, especially during periods of volatility.

Capital return is another key pillar. Citi repurchased $6.3 billion of stock in just one quarter, reinforcing the investment case.

On the other hand, consumer credit remains an area to watch, with declining profits in cards and rising signs of stress in credit metrics.


SWOT Analysis (with Price Impact Ranges)

Citi today sits at an interesting point — the business is clearly improving, but the stock is increasingly reflecting that improvement. The following ranges show how each factor could influence valuation.


Strengths

Citi’s biggest strength is the growing contribution from its higher-quality businesses.

The Services franchise continues to deliver strong, stable returns, and as it becomes a larger part of the mix, it can lift overall profitability. At the same time, aggressive share buybacks are supporting earnings per share and helping anchor the stock. Markets also contributed meaningfully this quarter.

👉 Estimated upside impact: +5% to +10% (Services mix improvement)

👉 +4% to +8% (buybacks support)

👉 +3% to +6% (Markets strength, cyclical)


Weaknesses

Despite the progress, Citi still trails the best-performing banks in terms of overall profitability, which limits how much investors are willing to pay for the stock.

Costs remain elevated due to ongoing transformation efforts, and consumer banking — particularly credit cards — continues to face pressure as credit costs normalize.

👉 Estimated downside impact: -8% to -12% (profitability gap vs peers)

👉 -4% to -7% (cost inefficiency)

👉 -3% to -6% (consumer credit pressure)


Opportunities

The biggest opportunity lies in execution. Citi is nearing the end of its transformation program, and meaningful cost improvements could significantly boost returns.

If Citi can sustain higher returns on equity, the market may be willing to re-rate the stock closer to or above book value. Continued buybacks also provide an additional tailwind.

👉 Estimated upside impact: +10% to +18% (cost transformation)

👉 +8% to +15% (RoTCE expansion and re-rating)

👉 +3% to +6% (balance sheet growth)


Threats

The main risks are tied to the credit cycle and the sustainability of recent performance.

Credit quality is starting to show early signs of deterioration, and Markets revenue — while strong this quarter — can be volatile. There is also ongoing execution risk, as Citi still needs to prove that its turnaround is durable.

👉 Estimated downside impact: -10% to -18% (credit deterioration)

👉 -5% to -9% (Markets normalization)

👉 -6% to -10% (execution risk)

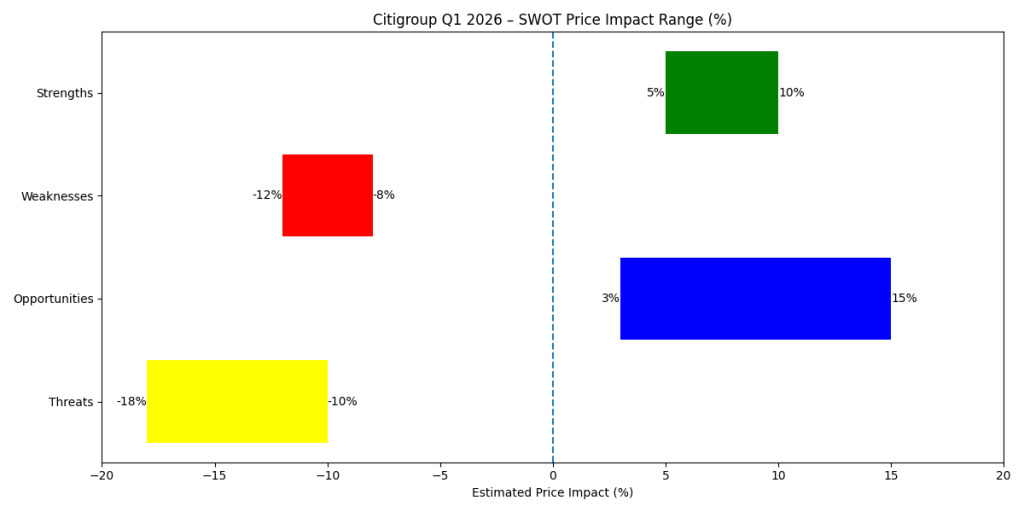
Citigroup Q1 2026 SWOT analysis chart showing estimated stock price impact ranges: strengths (+5% to +10%) and opportunities (+3% to +15%) on the positive side, and weaknesses (−12% to −8%) and threats (−18% to −10%) on the negative side, with a zero reference line.
Citigroup Q1 2026 SWOT analysis: Upside is driven by Services strength and ongoing transformation, while downside risks stem from credit deterioration and earnings volatility in Markets.

Valuation Scenarios

Citi’s valuation still anchors to its tangible book value of around $99 per share. The key variable is how much return the bank can generate on that capital.


Bear Case (30% probability)

In a downside scenario, credit costs rise and Markets normalize, pushing returns closer to ~10%.

In this case, Citi would likely trade below book value, around 0.9x TBV.

👉 Target Price: ~$90


Base Case (50% probability)

In a more balanced scenario, Citi continues to execute steadily, maintaining returns around 11–12% and delivering gradual efficiency improvements.

This would justify a valuation closer to 1.2x TBV.

👉 Target Price: ~$120


Bull Case (20% probability)

In a stronger execution scenario, Citi successfully improves efficiency and sustains higher returns (13–14%+), leading to a re-rating.

This could push valuation toward 1.5x TBV.

👉 Target Price: ~$150


Probability-Weighted Fair Value

Blending these scenarios results in a fair value of approximately:

👉 ~$117 per share

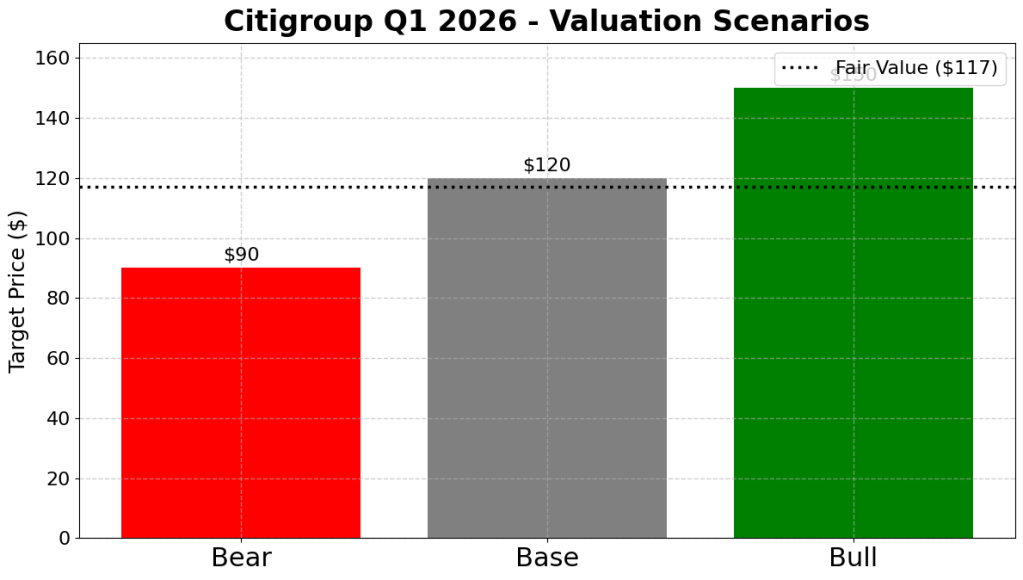
Citigroup Q1 2026 valuation scenarios chart showing bear case at $90, base case at $120, and bull case at $150, with a probability-weighted fair value line at $117.
Citigroup valuation scenarios: The stock’s upside depends on sustained execution, with a base case of $120 and a fair value of $117, suggesting limited margin of safety at current levels.

Verdict

Citi is clearly making progress. The latest results show that the turnaround is real and gaining traction.

But the stock has already moved ahead of that improvement.

At around $130, Citi is trading above what a probability-weighted valuation would suggest. That means investors are no longer buying a discount — they are betting on continued execution.


Call to Action

For value investors, the key question is simple:

👉 Would you buy Citi today, knowing that the upside depends on continued strong execution?

Or would you wait for a pullback to get a better margin of safety?


Disclaimer

This article is for informational purposes only and does not constitute investment advice. All analysis is based on publicly available information from Citigroup’s official financial disclosures. Investors should conduct their own research before making any investment decisions.

Intuit Q2 FY2026: Why AI May Strengthen — Not Disrupt — the Tax Software Giant

Intuit’s stock surged 26% following solid earnings, contradicting fears that AI could disrupt tax preparation software. The company’s regulatory compliance, legal liabilities, and extensive financial data form strong barriers to entry. Results indicate resilience against AI threats, signaling investor reassessment of Intuit’s value amidst broader market challenges.

TL;DR

AI fears triggered a massive selloff in software stocks over the past few weeks, and Intuit (INTU:NASDAQ) was caught in the narrative that generative AI could replace tax preparation and accounting software.

But Intuit’s latest earnings suggest the opposite may be happening.

From the day before earnings to March 6, Intuit’s stock surged about 26%, dramatically outperforming both the software sector ETF IGV (~+9%) and the S&P 500 (~-3%) over the same period.

The divergence suggests investors may be reassessing the AI disruption thesis.

Tax preparation is not just software. It involves regulatory compliance, legal liability, and long-term financial data trust — structural advantages that favor incumbents like Intuit.


Quarter Recap

Intuit’s latest quarterly results demonstrated continued strong momentum across its core businesses.

Key highlights:

  • Revenue grew 17% year-over-year
  • Non-GAAP EPS increased 25%
  • Small business and consumer segments both delivered solid growth
  • Full-year guidance remained intact

Despite widespread fears that AI could undermine the company’s value proposition, the earnings report showed no signs of structural weakness in demand.

Instead, the results reinforced that Intuit’s ecosystem continues expanding across tax preparation, accounting, payroll, and financial management services.


Market Reaction

The most telling signal came from the market’s reaction.

From February 25 to March 6:

  • Intuit (INTU): +26%
  • Software ETF (IGV): +9%
  • S&P 500: -3%

This divergence indicates the rally was company-specific, not simply a sector move.

While broader markets struggled with geopolitical tensions and macro volatility, investors appeared to reprice Intuit upward after reassessing the AI threat narrative.


Key Highlights

Three structural factors help explain why AI disruption may be harder than many investors initially assumed.

1. Tax preparation involves legal liability

Tax returns are not just informational outputs.

They represent legally filed financial documents.

Companies like Intuit effectively stand behind the accuracy of their systems. If errors occur, audits and penalties can follow.

An AI chatbot providing general advice does not carry the same legal responsibility.


2. Regulatory infrastructure creates barriers

Tax software integrates directly with government filing systems, financial institutions, and accounting workflows.

This infrastructure took decades to build and maintain.

AI models alone cannot easily replicate these regulatory integrations.


3. Financial data trust forms a powerful moat

Millions of individuals and businesses store years of financial history inside the Intuit ecosystem.

That historical data matters for:

  • tax carry-forwards
  • financial planning
  • bookkeeping continuity
  • compliance records

Switching platforms introduces risk and friction, strengthening customer retention.


SWOT Analysis

Strengths

Intuit’s moat rests on regulatory integration, trusted infrastructure, and proprietary financial data.

These advantages make the company far more resilient to AI disruption than typical SaaS providers.

In fact, AI may enhance the platform by enabling new capabilities such as automated bookkeeping, predictive financial insights, and tax optimization.

Estimated price impact: +$40 to +$80


Weaknesses

Despite the recent rally, Intuit still faces high expectations for continued growth.

If growth slows significantly or AI commoditizes certain services, the market could compress valuation multiples.

Estimated price impact: −$20 to −$40


Opportunities

AI could expand Intuit’s platform into a broader financial operating system for individuals and small businesses.

Potential capabilities include:

  • automated financial forecasting
  • real-time tax planning
  • intelligent expense classification
  • AI-assisted audit preparation

These features could increase platform engagement and raise switching costs.

Estimated price impact: +$60 to +$120


Threats

Some adjacent product areas — particularly marketing automation and other software services — face more traditional competitive pressures.

Additionally, government initiatives around simplified tax filing could create long-term competitive risks.

Estimated price impact: −$40 to −$80


Valuation Scenarios

Bear Case — AI commoditizes some services

If growth slows to high-single digits and valuation multiples compress:

Estimated fair value: $350–380

Probability: 25%


Base Case — AI enhances the platform

If Intuit maintains mid-teens growth and expands its ecosystem:

Estimated fair value: $430–480

Probability: 50%


Bull Case — AI expands the TAM

If AI significantly increases platform engagement and revenue opportunities:

Estimated fair value: $550–650

Probability: 25%


Probability-Weighted Fair Value

Combining the three scenarios yields an estimated fair value around:

~$470 per share


Verdict

The recent earnings report does not support the idea that AI will disrupt Intuit’s core business.

Instead, the evidence suggests something more nuanced.

In industries where software intersects with legal responsibility, regulatory integration, and trusted financial data, AI may actually reinforce incumbents rather than displace them.

Intuit appears to be one of those cases.

The stock’s strong post-earnings rally suggests investors are beginning to recognize this dynamic.


Call to Action

If you enjoy this type of analysis, follow SWOTstock for more deep dives into how structural industry forces shape long-term stock performance.


Disclaimer

This article is for informational purposes only and does not constitute investment advice. Investors should conduct their own research and consider their risk tolerance before making investment decisions.