Meta Q3 2025 — AI Momentum, Ad Strength, and a $505 Fair Value

Meta’s Q3 2025 report showed strong results, with AI enhancements driving user engagement and advertising success on Facebook and Instagram. Stock surged +7.7%, affirming confidence in future earnings. Key points included improved cost management, narrowing Reality Labs losses, and an optimistic outlook for 2026, maintaining a fair value estimate of $505 per share.

TL;DR Summary

Meta delivered a strong Q3 2025, with AI ranking models boosting engagement and ad yield across Facebook and Instagram. Management highlighted that “AI continues to be the primary driver of incremental time spent,” and capex is stabilizing after two years of heavy investment. The stock jumped +7.7% as results reinforced confidence in Meta’s 2026 earnings trajectory. Our fair value estimate remains $505 per share.


Quarter Recap

Meta’s third quarter demonstrated a well-balanced combination of product and financial execution. Advertising remained robust, driven by stronger pricing and an uptick in Reels engagement. Management emphasized that “Reels is now contributing positively to overall revenue growth,” confirming the format’s successful maturation.

Operating discipline also played a meaningful role in the quarter. CFO Susan Li noted that “the largest wave of AI infrastructure investment is now behind us,” which reassured investors concerned about multi-year capex drag. Reality Labs continued to operate at a loss, but management highlighted improved efficiency, saying “we’re seeing meaningful progress in reducing the cost structure of our AR/VR portfolio.”

Together, these factors contributed to the stock’s sharp post-earnings move.


Key Highlights

  • AI-driven engagement increased time spent across apps; management reiterated “AI ranking improvements remain one of the biggest drivers of ad performance.”
  • Advertising trends improved heading into the Q4 holiday season.
  • Capex expected to stabilize; CFO confirmed “2026 capex growth will be significantly more measured compared to prior years.”
  • Reality Labs losses narrowed on better cost controls.
  • Market responded with a +7.7% surge after results.
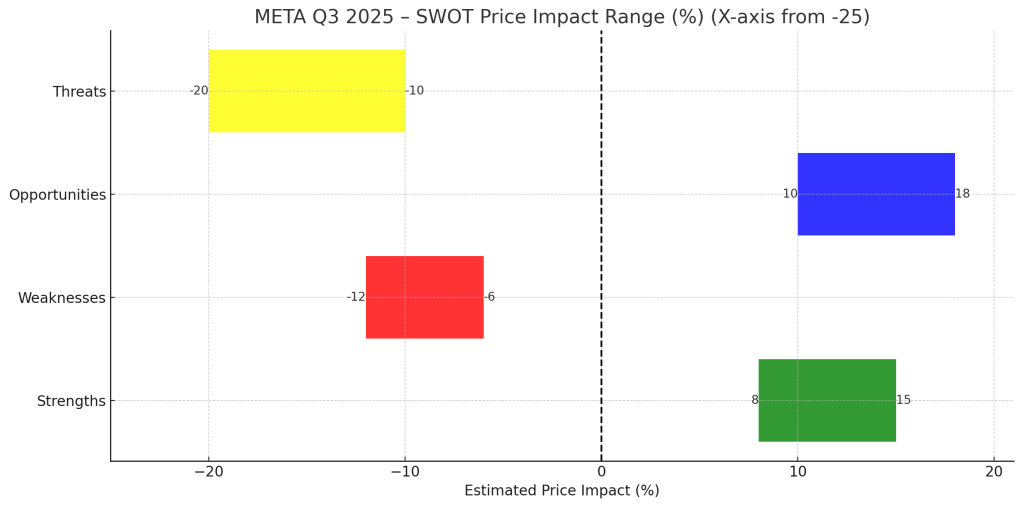
SWOT Analysis

Meta’s competitive edge lies in its ability to compound engagement, monetization, and AI-enabled product velocity. Management’s commentary reinforced this dynamic, noting that “AI is improving every major surface of the Family of Apps,” setting up continued momentum into 2026.

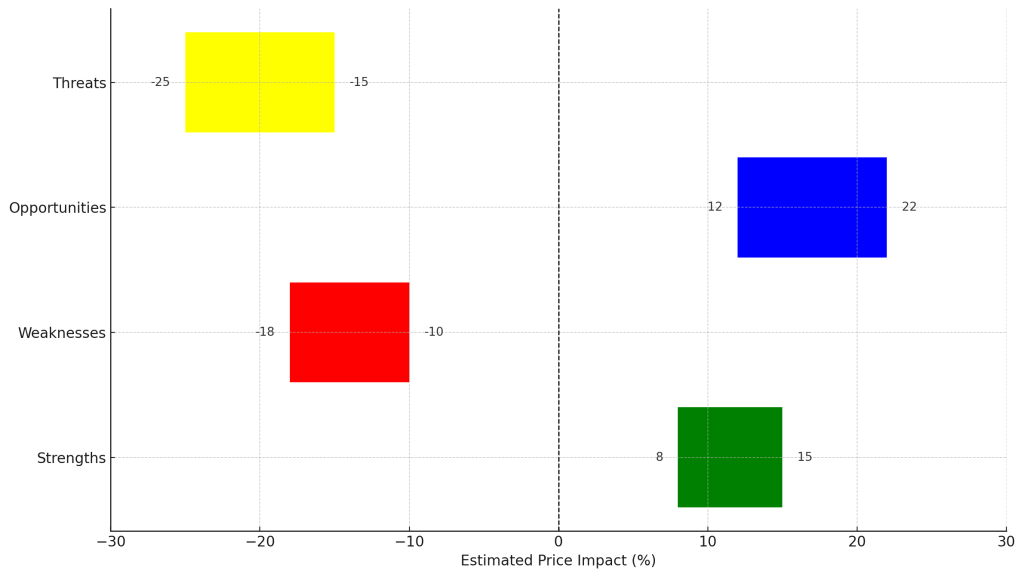
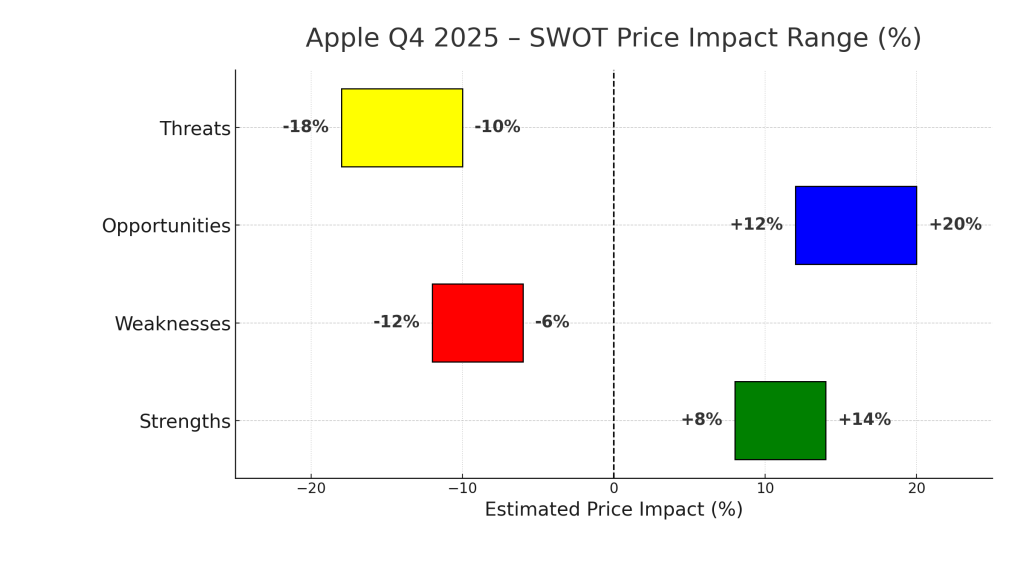
Strengths (+8% to +15%)

  • AI-driven ranking systems improving engagement and ad yield.
  • Massive 3.4B+ global daily active users.
  • Margin expansion supported by cost discipline.
  • Llama ecosystem adds strategic AI optionality.

Weaknesses (–6% to –12%)

  • Heavy reliance on ads as the primary revenue source.
  • Reality Labs remains a multi-year drag on profitability.
  • Regulation and safety compliance add structural costs.
  • High capex slows free cash flow near-term.

Opportunities (+10% to +18%)

  • Messaging monetization—WhatsApp and Messenger ads still early-day.
  • Generative AI-powered features improving content creation and engagement.
  • Ray-Ban Meta showing early AR/VR traction.
  • Retail and SMB ad recovery accelerating into 2026.

Threats (–10% to –20%)

  • Fierce competition from TikTok and YouTube.
  • Regulatory challenges in the EU and U.S.
  • Hardware adoption uncertainty.
  • Emerging market volatility affecting ad budgets.
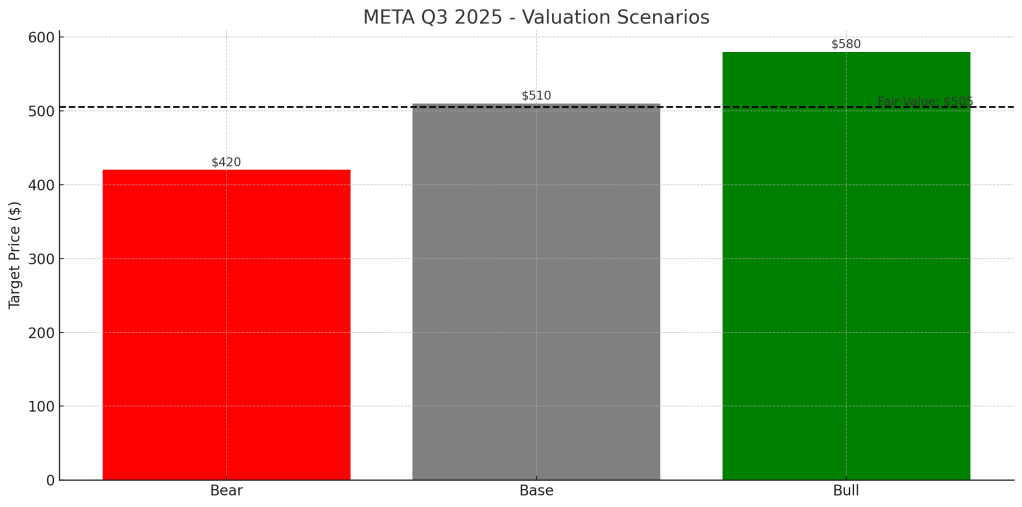
META Q3 2025 SWOT analysis chart showing estimated stock price impact ranges for strengths, weaknesses, opportunities, and threats from –20% to +18%.

Valuation Scenarios

Management’s commentary around costs, engagement, and AI infrastructure aligns well with our modeled ranges. As Zuckerberg noted, “We’re entering a more efficient phase of our AI investments,” supporting a healthier earnings trajectory.

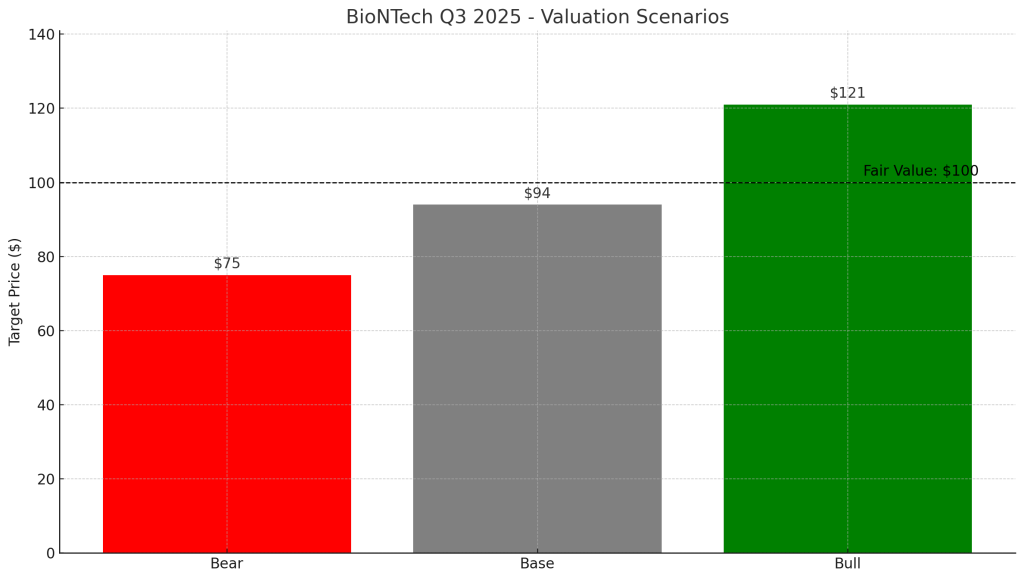
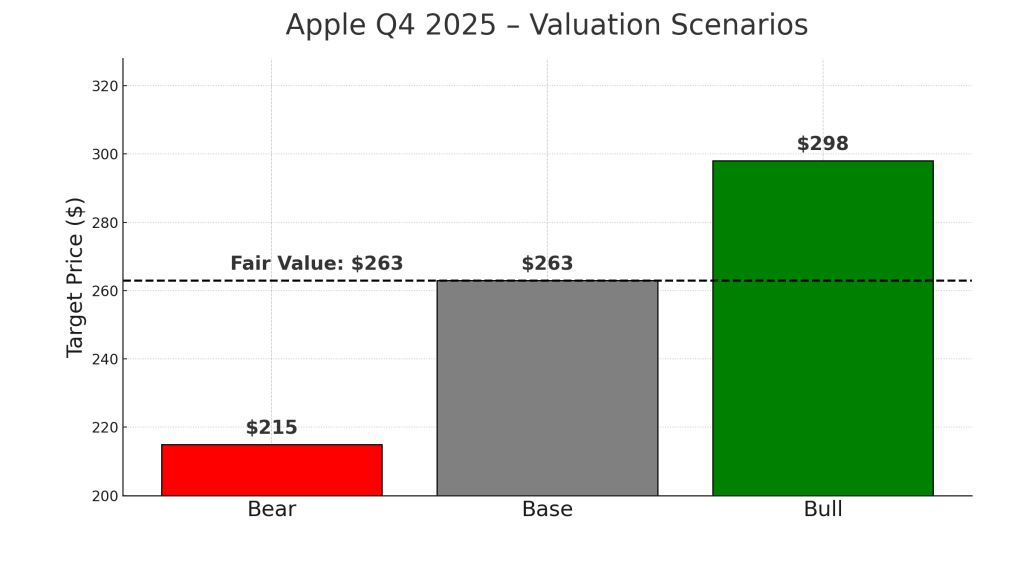
Bear Case — $420 (Prob. 25%)

  • Formula: $18.50 EPS × 22.7×
  • Slower ad growth; monetization plateaus
  • Elevated capex persists
  • Slight margin compression
  • Reality Labs losses widen

Base Case — $510 (Prob. 50%)

  • Formula: $19.80 EPS × 25.8×
  • Strong engagement; Reels + messaging push up monetization
  • Margin expansion from cost discipline
  • Stabilizing capex
  • AI ranking improvements continue to enhance ad yield

Bull Case — $580 (Prob. 25%)

  • Formula: $20.70 EPS × 28×
  • Strong retail ad cycle
  • Messaging monetization ramps
  • Faster cost improvement in Reality Labs
  • Strong AI-driven ad performance

Probability-Weighted Fair Value: $505

META Q3 2025 valuation scenarios chart showing Bear ($420), Base ($510), and Bull ($580) target prices with a fair value line at $505.

Verdict

Meta’s Q3 performance reinforces the company’s position as the most scaled and monetization-efficient AI-driven social platform. With engagement and ad yield rising, capex stabilizing, and incremental AI products rolling out across apps, the long-term setup remains attractive. Our fair value of $505 per share offers a balanced, grounded view for long-term growth investors.


Call to Action

If you enjoy these breakdowns, follow SWOTstock on LinkedIn and explore more analyses at SWOTstock.com.


Disclaimer

This content is for informational purposes only and is not investment advice. Investors should conduct their own research or consult a licensed financial advisor.


BioNTech Q3 2025 — The Next Vaccine Is a Tumor

BioNTech reported a revenue rebound to €1.52B in Q3 2025, driven by partnerships rather than vaccine sales, despite a net loss of €28.7M. With guidance raised to €2.6–2.8B and significant cash reserves, the company emphasizes oncology development, although profitability remains deferred. Future success hinges on upcoming trials, particularly Pumitamig.

TL;DR (SEO-optimized)

BioNTech’s Q3 2025 proved the pivot is real: revenue rebounded to €1.52B (+22% YoY) on partnership inflows (not vaccines), guidance was raised to €2.6–2.8B, and cash remains massive at €16.7B. Profit is still negative as R&D ramps into oncology. Our 12-month weighted fair value ≈ $100/share (vs. ~$104), with upside tied to 2026 oncology readouts — notably Pumitamig (BNT327) — and the company’s AI-assisted immunotherapy engine.


Quarter Recap (human-readable narrative)

BioNTech reported €1.52B in Q3 revenue, up sharply year over year as the Bristol Myers Squibb oncology collaboration recognized upfront and milestone payments. Core COVID vaccine sales continued to fade, while R&D rose to €565M and SG&A held near €148M, reflecting tighter operating discipline during the pivot. Despite the stronger top line, BioNTech posted a net loss of €28.7M (€–0.12 per share). Management raised FY25 revenue guidance to €2.6–2.8B and emphasized that a €16.7B cash/securities balance provides a multi-year runway to prosecute late-stage oncology programs.


Key Highlights (what matters this quarter)

  • Guidance raised: FY25 revenue now €2.6–2.8B (was €1.7–2.2B).
  • Cash strength: €16.7B war chest supports multi-year, late-stage pipeline without dilution.
  • Oncology pivot: Lead program Pumitamig (BNT327) advancing toward 2026 readouts; mRNA cancer vaccines continue with partners.
  • AI inside: Internal models for neoantigen prediction and mRNA construct design shorten design-to-trial cycles.
  • Profitability deferred: Negative EPS persists as spending concentrates on oncology milestones.

SWOT Analysis (with short intro + bullet points)

Intro: BioNTech is transitioning from pandemic windfall to a pipeline-driven oncology model. The following SWOT reflects only what management disclosed in the Q3 2025 report/call and our interpretation of how each area could move the stock.

Strengths — estimated stock impact: +8% to +15%

  • €16.7B cash & securities provide exceptional runway and deal flexibility.
  • Blue-chip partners (BMS, Pfizer, Genentech) validate platforms and add non-dilutive funding.
  • FY25 guidance raised; operating discipline improving despite elevated R&D.

Weaknesses — estimated stock impact: –10% to –18%

  • Still loss-making; near-term earnings visibility limited.
  • Revenue mix skewed to one-off collaboration payments vs. recurring product sales.
  • COVID vaccine decline continues to weigh on recurring revenue base.

Opportunities — estimated stock impact: +12% to +22%

  • 2026 catalysts: Pumitamig Phase 2/3 and mRNA cancer-vaccine readouts could reset valuation.
  • AI-assisted design may accelerate cycle times and increase program hit-rate.
  • Expansion of BMS collaboration and additional combo trials across solid tumors.

Threats — estimated stock impact: –15% to –25%

  • Regulatory slippage or mixed efficacy signals could push timelines to 2027–2028+.
  • Intense competition (e.g., Moderna mRNA oncology; antibody leaders) and pricing scrutiny.
  • Biotech risk sentiment — multiple compression if sector flows weaken.
Horizontal SWOT price-impact bar chart for BioNTech Q3 2025 showing Strengths (+8 to +15%), Weaknesses (–18 to –10%), Opportunities (+12 to +22%), and Threats (–25 to –15%) with color-coded bars and a vertical dashed line at zero.

Valuation Scenarios (short intro + bullet points)

Intro: We anchor valuation to FY25 guidance and management’s pipeline cadence. We apply standard biotech framing: earnings multiple when profitable; sales multiple when loss-making. All inputs reflect the Q3 2025 disclosures.

Bull Case — ~$121 (+≈16% vs. $104)

  • Assumptions: first oncology readouts positive; FY26 EPS ≈ $3.45; apply 35× P/E (pipeline re-rate).
  • Math: $3.45 × 35 ≈ $121.

Base Case — ~$94 (near-fair)

  • Assumptions: executes to raised FY25 guide; FY26 EPS ≈ $1.94; apply 25× P/E (mid-cap biotech).
  • Math: $1.94 × 25 ≈ $94.

Bear Case — ~$75 (–≈28%)

  • Assumptions: oncology timelines slip; losses persist; value on P/S = 3× FY25 sales (~€2.3B) on ~235M diluted shares.
  • Math: ≈ $75.

Weighted Fair Value ≈ $100/share

  • 35% Bull, 45% Base, 20% Bear → ~$100. With shares near ~$104, risk/reward is neutral until we get 2026 data.
Valuation scenarios chart for BioNTech Q3 2025 showing Bull case at $121, Base case at $94, Bear case at $75, with color-coded vertical bars and a dotted fair-value line at $100.

Verdict

BioNTech is no longer a COVID stock — it’s a clinical-trial story with an AI-assisted engine behind it. The balance sheet and partnerships provide stability; outcomes in 2026 will determine whether the multiple expands toward leaders or compresses with delays. For tech-savvy growth investors, this screens as a speculative hold near fair value, with asymmetric upside if even one late-stage asset delivers.


Call to Action

  • Track Pumitamig (BNT327) Phase 2/3 updates in 1H 2026.
  • Watch for AI-pipeline disclosures (design cycles, neoantigen modeling) and any BMS scope expansion.
  • Re-underwrite position sizing on dips toward the $90–95 support zone if sector beta weighs on biotech.

Disclaimer

This post is based only on BioNTech’s official Q3 2025 financial report and earnings call. It is not investment advice. Biotech equities are volatile and may result in loss of principal. Conduct your own research before investing.


Apple Q4 2025 — The Comeback Quarter That Put “Intelligence” Back in Apple

Apple reported 8% revenue growth to $102.5 billion and a record $28.75 billion in Services, signaling a return to growth after a flat trend. The iPhone 17 launch and deeper ecosystem engagement drove this performance. Guidance for the holiday quarter suggests continued growth, aligning with Apple’s AI ambitions. Investors reacted positively, with a 6% share price increase post-announcement.

TL;DR Summary

Apple finally broke its flat-growth streak.
Revenue climbed 8 % y/y to $102.5 billion, EPS reached $1.85 (+9 %), and Services hit a record $28.75 billion.
Guidance for the holiday quarter calls for +10–12 % growth, reigniting belief that Apple Intelligence is more than a buzzword.
For growth investors, this quarter marks Apple’s return to the AI-led expansion narrative.


Quarter Recap

After four quarters of muted growth, Apple delivered what Tim Cook called “our strongest lineup ever.”
The iPhone 17 launch, deeper ecosystem engagement, and record Services revenue lifted results well above expectations.
Gross margin expanded to 47.2 %, net income rose to $24.2 billion, and Apple declared another $0.26 dividend while continuing aggressive buybacks.

Beyond the numbers, the tone of the call signaled confidence: management expects the December quarter to be the best holiday season in Apple’s history.
That optimism—and the 6 % share-price jump that followed—suggests investors finally see Apple’s AI strategy taking shape.


Key Highlights

  • Services: $28.75 B (+15 %) — now 28 % of total revenue and driving margin expansion.
  • iPhone: $49.0 B (+6 %) — AI-capable models leading upgrade cycle.
  • Mac / iPad: Flat to down slightly as users wait for AI refreshes.
  • Geography: Greater China $14.5 B (+3 %) — showing early stabilization.
  • Guidance: Revenue +10–12 %, gross margin 47–48 % next quarter.

(Note: Apple’s 8 % revenue growth trails Microsoft’s +12 % and Google’s +10 %, but represents its strongest acceleration since 2022.)


How Apple Intelligence Actually Creates Value

For now, “Apple Intelligence” isn’t a separate subscription—it’s a device-pull engine.
AI-driven features such as natural-language photo search, cross-app summaries, and on-device personal assistance require the latest hardware chips (A18, M4).
That design forces upgrades and feeds Services usage. Apple plans to layer paid tiers later, turning AI into a recurring revenue lever by FY 2026.


SWOT Analysis — Estimated Price Impact

Strengths (+6 to +12 %)
A 2.2 billion-device installed base and record Services margin growth create durable pricing power.
AI-ready devices expand average selling prices and lift gross margin.
→ + $15 – $30 per share

Weaknesses (–5 to –10 %)
Hardware still ≈ 48 % of sales; tariffs and China competition pressure margins.
AI monetization lag keeps near-term EPS growth modest.
→ – $13 – $26 per share

Opportunities (+10 to +18 %)
AI integration across devices and services bundles can boost ARPU by 5–8 %.
Emerging-market FinTech and subscriptions expand TAM.
→ + $20 – $36 per share

Threats (–8 to –15 %)
Regulation (EU DMA, App Store fees), supply-chain relocation costs, and AI competition remain real headwinds.
→ – $18 – $32 per share

Horizontal SWOT bar chart for Apple Q4 2025 showing the estimated stock-price impact ranges for Strengths, Weaknesses, Opportunities, and Threats. Strengths (green) range from +8% to +14%, Weaknesses (red) from –12% to –6%, Opportunities (blue) from +12% to +20%, and Threats (yellow) from –18% to –10%.

Valuation Scenarios

Apple’s fair value clusters around $270, but outcomes vary depending on how quickly its AI ecosystem monetizes.
Here’s how the road ahead could play out:

  • Bull Case ($305, ~30 % probability):
    Apple executes on AI integration, driving 12 % EPS growth and pushing Services beyond 30 % of total revenue.
    The market rewards it with a premium multiple near 32×.
  • Base Case ($270, ~50 % probability):
    EPS grows about 8 % as AI demand builds gradually.
    The stock trades around 29× earnings — roughly where it sits today.
  • Bear Case ($230, ~20 % probability):
    China softness, regulation, and muted AI monetization limit EPS to +3 %.
    Multiple compresses to 25× as investors rotate to faster-growing peers.

➡️ Fair Value Estimate: ≈ $272.5 per share, balancing these three outcomes.

Vertical bar chart for Apple Q4 2025 valuation scenarios showing Bear, Base, and Bull price estimates. Bear scenario (red) is $215, Base (gray) is $263, and Bull (green) is $298. A horizontal dashed line marks Fair Value at $263.

Verdict

At ≈ $270, Apple is fairly valued with a clear path to earnings expansion.
Growth investors should hold core positions and add on dips near $230–240.
The next inflection point arrives mid-2026, when AI features begin contributing revenue and Apple could justify a re-rating to 32–34× P/E ($285–295 target).
If Apple proves that Intelligence sells devices — not just headlines — $300 may come sooner than bears expect.


What to Watch Next

  • Adoption metrics for Apple Intelligence features in real-world use.
  • Services ARPU growth and subscription renewal rates.
  • China unit sales momentum post-holiday quarter.
  • Margin management as $1.4 B tariff cost hits Q1.

(Visual Placeholder #5 – Peer Comparison Table: Apple vs Microsoft vs Alphabet Growth and Margins)


Call to Action

Follow SWOTstock for AI-era earnings analysis of Amazon, Microsoft, and Tesla as we track how AI execution reshapes Big Tech leadership.
Subscribe for alerts when next-quarter AI scorecards drop.


Disclaimer

This analysis uses only Apple Inc.’s official Q4 FY 2025 financial report and earnings call.
It is for informational purposes only and not investment advice.