TL;DR
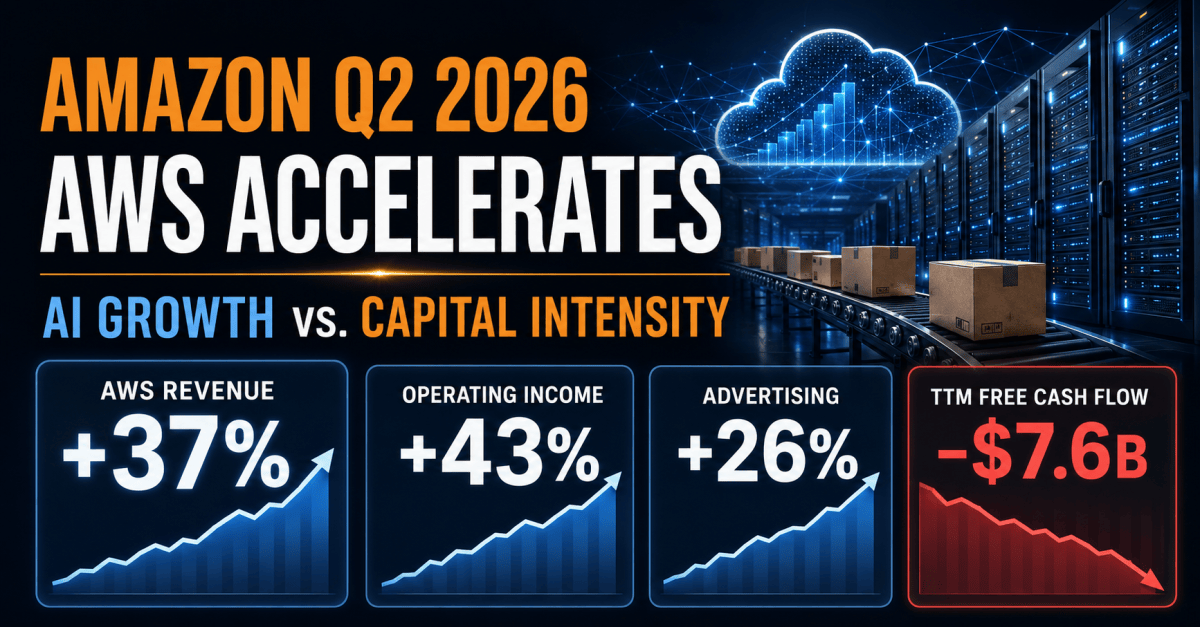
Amazon (AMZN:NASDAQ) Q2 2026 results materially strengthened its growth thesis. AWS revenue accelerated 37%, AWS operating income jumped 64%, advertising grew 26%, and all three operating segments remained profitable. More importantly, AWS achieved this growth while expanding its operating margin to 39.4%.
The principal concern has shifted. The question is no longer whether Amazon has genuine AI demand; its disclosed revenue, customer spending and multiyear commitments provide convincing evidence that it does. The unresolved question is whether the returns generated by Amazon’s enormous infrastructure build will ultimately justify its capital intensity.
After Amazon shares closed at $271.58 following a 15.25% post-earnings rise, much of the improved outlook appears reflected in the price. Our probability-weighted fair value is approximately $275 per share, leaving little margin of safety.
Amazon Q2 2026 Earnings Recap
Amazon reported net sales of $200.6 billion, an increase of 20% year over year. Operating income advanced 43% to $27.5 billion, lifting the consolidated operating margin from 11.4% to 13.7%.
Reported net income reached $62.6 billion, equivalent to diluted EPS of $5.75. However, this included $53.4 billion of non-operating pre-tax income, primarily associated with Amazon’s investment in Anthropic. This gain should not be treated as recurring operating earnings.
The operating performance was nevertheless exceptionally strong.
- North American sales increased 16% to $116.2 billion, with operating income rising to $9.1 billion.
- International sales grew 15% to $42.2 billion and generated $1.7 billion of operating income.
- AWS revenue surged 37% to $42.2 billion, while operating income increased 64% to $16.6 billion.
- Advertising revenue grew 26% to $19.8 billion.
Amazon also guided for Q3 net sales of $197 billion to $202 billion and operating income of $22.5 billion to $26.5 billion.
AWS Changes the AI Investment Debate
AWS was the defining feature of the quarter.
Its 37% revenue growth represented a sharp acceleration, while its operating margin expanded from 32.9% to 39.4%. AWS accounted for only around 21% of Amazon’s consolidated sales but approximately 60% of segment operating income.
This matters because Amazon did not have to sacrifice current AWS profitability to achieve faster AI-driven growth. Revenue growth and margin expansion occurred simultaneously.
Amazon also disclosed tangible evidence that its AI infrastructure is already being monetized:
- The AWS AI business exceeded a $25 billion annual revenue run rate.
- Amazon’s chips business also exceeded a $25 billion annual revenue run rate.
- Both businesses were growing at triple-digit year-over-year rates.
- Anthropic and OpenAI entered multiyear, multigigawatt Trainium commitments.
- Graviton revenue commitments nearly tripled quarter over quarter.
- Bedrock customer spending during Q2 exceeded spending across all previous quarters combined.
These disclosures do not guarantee attractive long-term returns, but they reduce the risk that Amazon is building AI infrastructure without corresponding customer demand.
The Cost of Capturing That Demand
The strength of AWS comes with an increasingly capital-intensive financial structure.
Trailing operating cash flow grew 33% to $161.4 billion. However, net property and equipment investment reached approximately $169 billion, causing trailing free cash flow to fall from positive $18.2 billion to negative $7.6 billion.
Amazon is therefore investing more in infrastructure than its entire business currently generates in operating cash.
That does not automatically make the investment uneconomic. Amazon may be deliberately sacrificing current free cash flow to build capacity that will generate revenue for many years. But the required financial outcome is demanding.
The new capacity must:
- Reach high utilization relatively quickly;
- Produce sufficient revenue to absorb depreciation, energy and operating costs;
- Maintain competitive pricing against other cloud platforms;
- Avoid becoming economically obsolete as AI chips and models improve; and
- Generate returns above Amazon’s cost of capital.
Capital expenditure is an upfront cash outflow, while depreciation appears gradually after assets enter service. Current AWS margins may therefore not yet reflect the complete accounting cost of Amazon’s latest infrastructure investments.
SWOT Analysis
Amazon’s Q2 results present a fundamentally positive growth picture, but one that remains financially conditional.
Strengths
- AWS has regained powerful momentum. Revenue rose 37%, while operating income grew even faster at 64%.
- AWS growth and profitability improved together. Its 39.4% operating margin demonstrates strong current utilization and operating leverage.
- AI demand is already measurable. Amazon disclosed substantial AI and chip revenue, rapidly rising Bedrock spending and multiyear infrastructure commitments.
- Amazon controls more of the AI stack. Trainium, Graviton, Bedrock and AWS allow it to participate across chips, computing and enterprise AI deployment.
- Advertising provides another high-growth earnings engine. Its 26% growth should support Amazon’s revenue mix and consolidated profitability.
- Retail is no longer merely consuming AWS profits. North America and International produced a combined $10.8 billion of quarterly operating income.
Weaknesses
- Free cash flow has turned negative. Infrastructure investment has grown faster than operating cash generation.
- Capital intensity is exceptionally high. Amazon must earn significant incremental profit simply to justify the capital being committed.
- AWS remains disproportionately important to group earnings. A five-percentage-point decline in AWS margin would reduce annualized operating income by approximately $8.4 billion at its current revenue run rate.
- Reported EPS does not represent recurring earning power. The Anthropic investment gain substantially inflated Q2 net income.
- International retail margins remain thin. Its operating margin stayed at 4.1% despite 15% sales growth.
Opportunities
- Additional capacity could unlock AWS demand that Amazon cannot currently serve.
- Trainium could strengthen AWS differentiation while lowering computing costs.
- Bedrock can become an enterprise distribution layer for multiple competing AI models.
- Advertising can continue shifting Amazon toward higher-margin service revenue.
- AI and automation can improve shopping conversion, advertising efficiency and fulfillment productivity across Amazon’s existing scale.
Threats
- AI demand may not absorb the installed capacity at attractive prices.
- Rising depreciation could reverse recent AWS margin expansion.
- Rapid hardware improvements could shorten the useful economic life of current assets.
- Cloud competition could produce high revenue growth but inadequate returns on capital.
- Large AI customers may gain substantial pricing power.
- Energy, chip and construction constraints could delay the conversion of investment into revenue.
How Investors Reacted
Amazon shares closed at $271.58 on July 31, rising 15.25% in the first full trading session following the announcement.
The regular-session move confirmed the initially positive after-hours reaction. Investors did not merely react to the headline EPS, which was distorted by the Anthropic investment gain. The more economically relevant development was that AWS produced faster growth, higher operating income and substantial margin expansion while Amazon demonstrated measurable AI demand.
The market also appeared willing to look through negative free cash flow because Amazon’s current demand indicators made the infrastructure expansion more credible.
However, a positive business development and an attractive stock price are not necessarily the same thing. The post-earnings repricing has already incorporated a significant portion of the improved outlook.
Amazon Valuation Scenarios
Because current free cash flow is distorted by the infrastructure investment cycle, we valued Amazon using normalized 2027 operating earnings. The Anthropic investment gain was excluded from recurring earnings.
Bear case: $175 per share — 25% probability
AWS continues growing but decelerates, while its operating margin falls to 32% as depreciation and infrastructure expenses catch up with investment.
This scenario assumes Amazon generates approximately $102.5 billion of normalized operating income and earns around $7.15 per share after tax. Applying a 24-times multiple produces a target of approximately $175.
The bear case does not require AWS revenue to decline. It reflects the risk that Amazon achieves growth without earning sufficient returns on the capital required to support it.
Base case: $280 per share — 55% probability
AWS reaches approximately $230 billion of 2027 revenue and maintains a normalized operating margin of 36%. Advertising and retail efficiency support moderate improvement in the remainder of Amazon.
Normalized EPS reaches approximately $9.25. Applying a 30-times multiple produces a target price of approximately $280.
This scenario assumes successful AI monetization but also recognizes that depreciation and rising capital intensity could prevent AWS margins from remaining at Q2’s exceptional level.
Bull case: $385 per share — 20% probability
AWS reaches approximately $260 billion of revenue while sustaining a 39% operating margin. Advertising, retail efficiency and a richer service mix lift profitability across the rest of Amazon.
Normalized EPS rises to approximately $11.35. A 34-times multiple produces a target of approximately $385.
This outcome requires several favorable conditions to occur together: sustained AI demand, high infrastructure utilization, successful proprietary-chip adoption and continued margin improvement outside AWS.
Valuation Verdict
Weighting the three scenarios produces an estimated fair value of approximately $275 per share.
Against the July 31 closing price of $271.58, Amazon trades only around 1% below our probability-weighted valuation. That is effectively fair value, not a meaningful margin of safety.
Potential entry levels are:
- Below $240: a modest discount of around 13% to estimated fair value;
- Around $220: approximately a 20% margin of safety; and
- Around $205: approximately a 25% margin of safety.
Amazon’s business-thesis risk declined after Q2 because AWS supplied stronger evidence of AI demand and monetization. Its valuation risk, however, increased after the share-price surge.
Investor Takeaway
Amazon’s Q2 report answered one of the most important questions surrounding the AI infrastructure cycle: there is substantial real demand behind its investment. AWS is growing faster, earning higher margins and securing long-term customer commitments.
What the quarter did not prove is that the full infrastructure build will generate attractive returns throughout the cycle. Negative free cash flow, rising depreciation and the possibility of technological obsolescence remain central risks.
For a Type 1 growth investor, Amazon remains one of the strongest large-scale vehicles for cloud and enterprise AI adoption. At approximately $272, however, investors are already paying for a considerable amount of that success.
The central conclusion is simple: Q2 made Amazon a stronger company, but the post-earnings rally prevented it from becoming an obviously cheaper stock.
Disclaimer
This article is for informational and educational purposes only. It does not constitute financial advice, investment advice or a recommendation to buy or sell any security. Valuation estimates and scenario probabilities are based on assumptions that may prove incorrect. Investors should conduct their own research and consider their financial objectives, risk tolerance and circumstances before making investment decisions.