💼 JPMorgan Q3 2025 Earnings — The Fortress Bank Tightens Its Grip on Stability

JPMorgan Chase’s Q3 2025 results showcase strong performance with EPS of $5.07 and a net income of $13.7 billion. Investment banking surged 25%, and AI efficiencies are enhancing operations. The stock, currently at $308, appears undervalued with a fair value of $328, making it a solid choice for long-term investors.

TL;DR Summary

JPMorgan Chase (JPM:NYSE) once again proved why it’s considered Wall Street’s fortress.
Third-quarter earnings beat expectations, investment banking is rebounding, and AI-driven efficiency is quietly reshaping operations.
At around $308 per share, the stock looks slightly undervalued with a fair value near $328 — steady upside for long-term value investors.


Quarter Recap

On October 14, 2025, JPMorgan reported EPS $5.07 on $46.4 billion in revenue, up about 9 percent year over year.
Net income reached $13.7 billion, with ROTCE 24 percent and ROE 20 percent, both exceptional for a global bank.
The company raised its full-year net interest income guidance to roughly $93 billion (excluding Markets), signaling confidence in margin stability.

CEO Jamie Dimon described the U.S. economy as “resilient but still pressured,” while emphasizing that AI adoption is already driving measurable productivity gains across fraud detection, operations, and client service.


Key Highlights

  • Investment banking surged 25 percent year over year, led by stronger M&A and equity underwriting.
  • Net interest income continued to climb, supported by robust consumer deposits.
  • Wealth and asset management hit record levels: $4.7 trillion AUM with $80 billion in net inflows.
  • Capital strength: CET1 ratio rose to 14.3 percent; management plans ≈ $30 billion in dividends and buybacks.
  • Credit quality: Card loss rates normalized to ~2.6 percent — still well below pre-pandemic levels.

Market response was positive: the stock climbed roughly 3 percent to $310 following the release, as investors rewarded its steady execution.


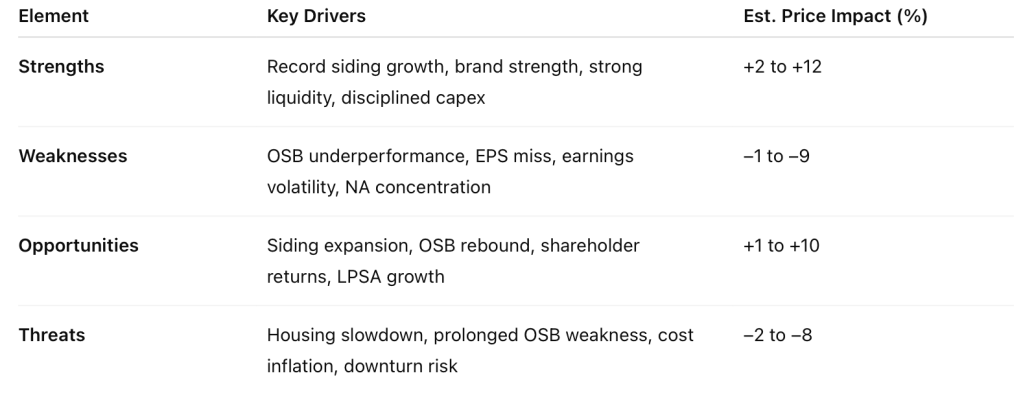
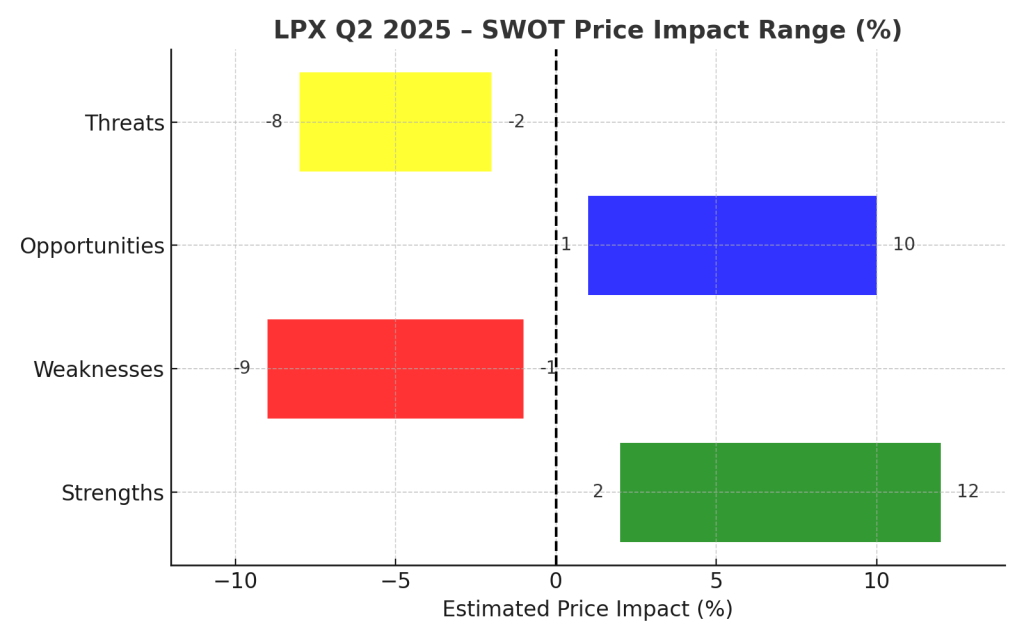
SWOT Analysis (12-Month Price-Impact View)

Strengths (+ $15 to + $25)

  • Industry-leading ROE (20 %) and ROTCE (24 %) sustain premium valuation.
  • Fortress capital position (CET1 14.3 %) supports $30 B capital return program.
  • AI and automation enhance efficiency and risk controls.
  • Diversified revenue mix limits cyclicality across business lines.

Weaknesses (– $10 to – $18)

  • Deposit costs rising faster than loan yields — NII growth plateau ahead.
  • Consumer credit losses slowly normalizing.
  • Technology and compliance investments pressure short-term margins.

Opportunities (+ $8 to + $20)

  • Revival in deal-making and capital markets fees.
  • Continued wealth inflows boost recurring revenues.
  • Efficiency gains from AI could add ~3 % EPS growth through 2026.

Threats (– $12 to – $20)

  • Potential U.S. slowdown reducing loan demand.
  • Basel III Endgame rules may tighten capital buffers.
  • Global market volatility could curb trading income.
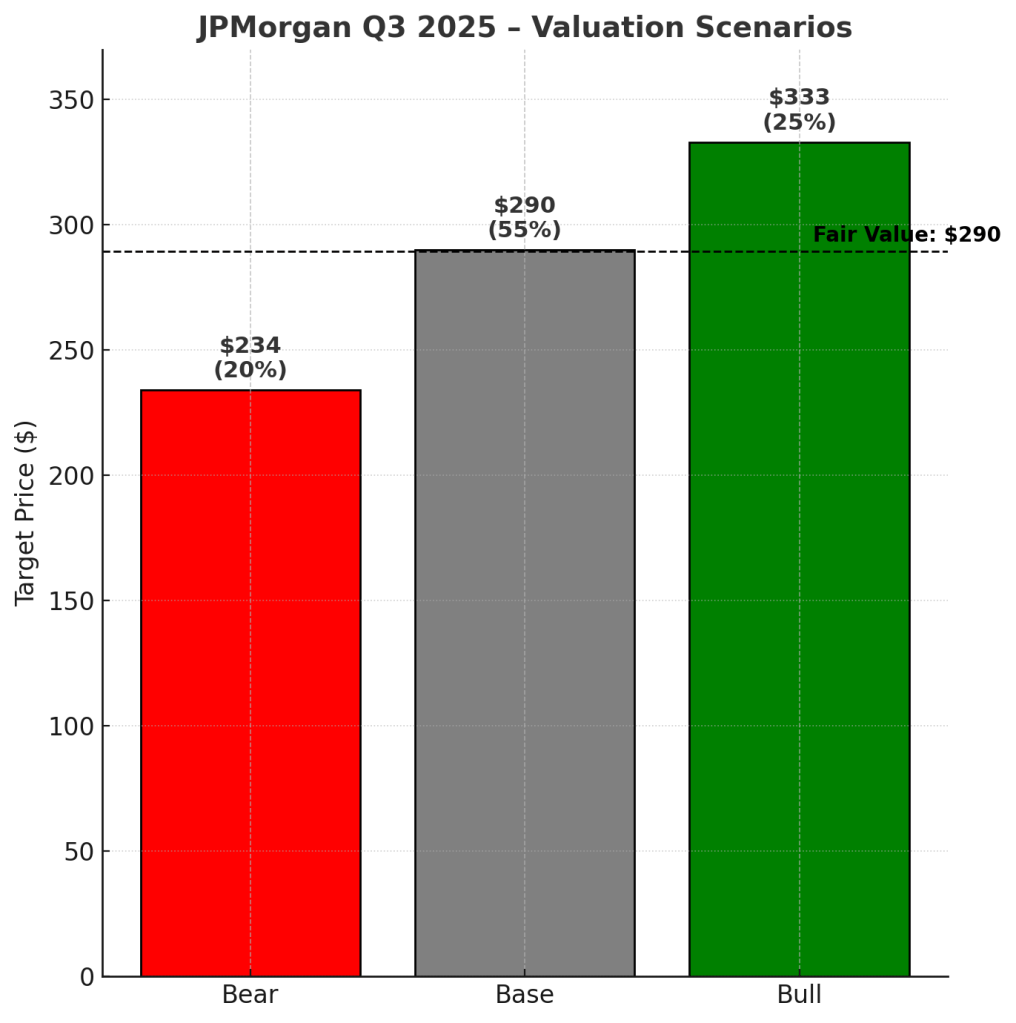
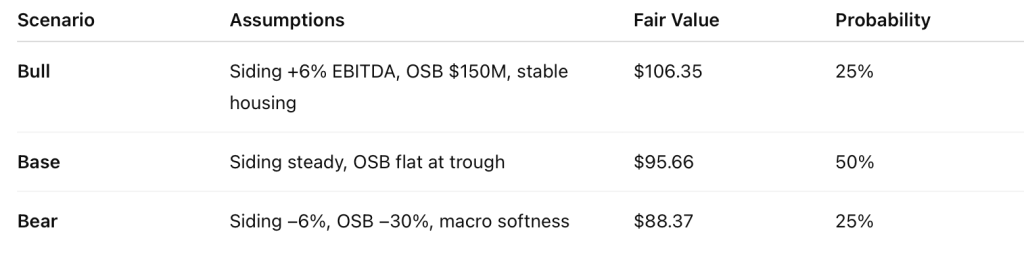
A bar graph illustrating the SWOT analysis for JPMorgan Chase's Q3 2025 price impact range, featuring four colored bars representing strengths, weaknesses, opportunities, and threats, with corresponding estimated price impact values.
SWOT analysis of JPMorgan’s price impact range for Q3 2025, highlighting strengths, weaknesses, opportunities, and threats.

Valuation Scenarios

  • Bull (+ 20 %) → $370
    • Net interest income stays high, AI efficiency adds ~3 % to EPS, and P/B expands to 1.9×.
  • Base (+ 5 %) → $325
    • Stable credit costs and moderate growth support 1.7× P/B multiple.
  • Bear (– 10 %) → $277
    • Economic soft landing turns shaky; credit loss > 3 %, multiple compresses to 1.5×.

Probability-weighted fair value: ≈ $328 per share, implying a 6–7 % upside from the current $308.

Bar chart illustrating valuation scenarios for JPMorgan in Q3 2025, with target prices for Bear ($234), Base ($290), and Bull ($333), highlighting the fair value at $290.
JPMorgan Q3 2025 Valuation Scenarios: Bear, Base, and Bull target prices with fair value highlighted.

Fair Price Assessment

The valuation rests on JPMorgan’s own fundamentals — not sentiment.
At 24 percent ROTCE and 1.7× book value, shares reflect fortress-level returns with room for modest re-rating.
AI efficiency and buybacks should sustain mid-single-digit EPS growth, keeping the fair price range between $315 and $340.


Verdict

JPMorgan is the definition of a fortress value stock — disciplined, diversified, and resilient.
It won’t outpace Silicon Valley, but its consistency and capital strength make it a cornerstone holding for long-term DIY value investors.
If you’re seeking steady dividends and defensive growth in an uncertain rate environment, this remains one of the best-managed banks in the world.


Call to Action

Track how AI efficiency unfolds across JPMorgan’s business lines in the coming quarters.
If those gains compound like its interest income, the “fortress bank” might quietly build its next growth engine.


Disclaimer

This analysis is for informational purposes only and is based solely on JPMorgan Chase’s official Q3 2025 financial report and earnings call transcript.
It does not constitute investment advice or a recommendation to buy or sell securities.


ASML’s Q3 Performance: Steady Growth Amid Challenges

ASML posted a solid Q3 with €7.5 billion in sales and €2.1 billion in net income, leading to a positive stock reaction. Despite a projected decline in Chinese demand for 2026, management remains optimistic, maintaining a fair valuation of approximately $1,190 per share, indicating significant growth potential driven by AI advancements.

🔎 TL;DR Summary

ASML (AMSL:NASDAQ) just delivered another steady quarter: €7.5 billion in sales, €2.1 billion net income, and margins holding above 51 %. The stock reacted positively in pre-market, climbing ~3 %, as investors looked beyond a cautious China outlook to renewed confidence in ASML’s long-term AI-driven roadmap. Our fair-value model points to ~ $1,190 per share, ≈ 25 % upside.


🧭 Quarter Recap

Management called Q3 “in line with guidance.” Bookings hit €5.4 billion, supported by continued momentum in EUV and early shipments of High-NA EUV systems. The company also highlighted its new AI partnership with Mistral AI, aiming to embed machine-learning control into yield and productivity.

The only dark cloud: ASML expects a “significant decline in China demand in 2026.” Still, management does not foresee overall sales falling below 2025 levels — a sign of resilience amid geopolitical shifts.


💡 Key Highlights

  • Net sales: €7.52 billion | Gross margin: 51.6 %
  • Net income: €2.13 billion | EPS: €5.49
  • Bookings: €5.4 billion | Service revenue: €1.96 billion
  • Guidance: Q4 sales €9.2 – €9.8 billion | Full-year +15 % growth

🧩 SWOT Analysis (Q3 2025)

Strengths (+8 to +12 %) Technological monopoly in EUV and upcoming High-NA tools sustain >50 % gross margin and high visibility.

Weaknesses (−4 to −7 %) Cap-ex cycles and €1.2 billion quarterly R&D keep cash flows volatile.

Opportunities (+10 to +18 %) AI lithography, Mistral AI integration, and High-NA adoption expand ASML’s total addressable market through 2028.

Threats (−8 to −12 %) China sales normalization and export controls could trim €1.5 – 2 billion from 2026 revenue.

Net SWOT bias: +5 % to +9 % upside.

A graph illustrating the SWOT analysis of ASML for Q3 2025, showing estimated price impact ranges for strengths, weaknesses, opportunities, and threats in percentage.
SWOT analysis chart highlighting ASML’s strengths, weaknesses, opportunities, and threats for Q3 2025.

📊 Valuation Scenarios

• Bull Case: ASML’s High-NA EUV rollout and AI-driven lithography adoption accelerate revenue growth above 20 % annually through 2027. → Estimated EPS 2026: €27 | P/E 45× | Fair Value ≈ $1,310 (+44 %).

• Base Case: Steady 15 % growth and margin stability around 52 %. → Estimated EPS 2026: €25 | P/E 40× | Fair Value ≈ $1,080 (+14 %).

• Bear Case: China demand softens (-15 % revenue in 2026) and margins slip to 49 %. → Estimated EPS 2026: €22 | P/E 35× | Fair Value ≈ $830 (-13 %).

🎯 Weighted Fair Value:$1,190 per share (+25 % upside)


Bar chart depicting ASML's valuation scenarios for Q3 2025, with 'Bear' case at $830, 'Base' case at $1080, and 'Bull' case at $1310, along with a dashed line indicating the fair value at $1099.
ASML Q3 2025 Valuation Scenarios: Target prices under Bear, Base, and Bull cases.

🧠 Verdict

ASML remains the “picks-and-shovels” play for the AI era. Even as near-term demand wobbles, its EUV and High-NA roadmap locks in a multi-year growth path few companies can match. For tech-savvy growth investors, the setup still favours accumulation on dips.


💬 Investor Takeaway

Market reaction shows confidence in ASML’s long-term story: from chipmaker orders to AI co-design tools, it continues to define the semiconductor future. Short-term noise aside, the firm’s monopoly position and AI-linked flywheel justify a premium valuation — and our $1,190 fair price reflects that potential.


Disclaimer: This post is for informational purposes only and not financial advice. Please do your own research before investing.

Louisiana-Pacific: Siding Powers Ahead as OSB Drags — Is This a Buy on Weakness?

Louisiana-Pacific (LPX) reported Q2 2025 earnings with strong siding performance, revenue of $755M, but missed EPS expectations due to OSB weakness. Siding now constitutes 88% of EBITDA, reflecting the company’s shift from commodity reliance. Despite macro challenges, LPX presents value for investors, maintaining a stable dividend and strong liquidity.

TL;DR

Louisiana-Pacific (LPX) reported Q2 2025 results showing record siding performance but an OSB-driven EPS miss. With siding now ~88% of EBITDA, the company’s transformation away from commodity cyclicality is well underway. At ~$90.81, LPX trades near our tariff-adjusted bear-case range, offering potential value for patient investors despite macro and policy headwinds.


Quarter Recap

In Q2 2025, LPX generated $755M in revenue (–$60M YoY). Siding Solutions grew 11% to $460M in sales, achieving record EBITDA of $125M with ~27% margins. OSB revenue fell $101M, with margins collapsing to ~8%. Adjusted EPS of $0.99 missed consensus by ~$0.09, mainly due to OSB weakness. Liquidity remains strong at $1.1B with no revolver debt, and the dividend of $0.28/share was maintained.


Key Highlights

Siding’s resilience, paired with OSB’s deep pricing trough, defined Q2’s results. LPX continued to shift its earnings mix toward siding, enhancing margin stability.

Highlights:

  • Record Siding EBITDA: $125M, +11% YoY sales, +8% volume, +2% price/mix.
  • OSB Weakness: $19M EBITDA vs. ~$130M a year ago.
  • Segment Mix Shift: Siding share of EBITDA up from ~47% in 1H24 to ~76% in 1H25.
  • Capex Discipline: FY25 cut by $60M to $350M.
  • Dividend: $0.28/share, ~1.2% yield, payout ratio ~28%.
  • Buyback: $177M authorization remaining.

SWOT Analysis with Price Impacts

LPX’s strengths lie in siding-led growth, brand equity, and a strong balance sheet. Weaknesses remain in OSB’s commodity exposure and concentrated North American footprint. Opportunities include further siding penetration, eventual OSB recovery, and international expansion. Threats are led by housing softness, tariff risk, and cost inflation.


SWOT Summary

SWOT analysis table for Louisiana-Pacific (LPX) Q2 2025 showing strengths, weaknesses, opportunities, and threats with estimated stock price impact ranges in percentages.
Louisiana-Pacific (LPX) Q2 2025 SWOT analysis price impact chart showing estimated stock price change ranges for each category: Strengths (+2% to +12%), Weaknesses (–9% to –1%), Opportunities (+1% to +10%), and Threats (–8% to –2%), with a zero-percent reference line for context.

Valuation Scenarios – Narrative + Table

We model three 12-month outcomes based on SWOT drivers:

Valuation scenarios table for Louisiana-Pacific (LPX) Q2 2025 showing bull, base, and bear case assumptions, fair value estimates, and probability weightings.
Bar chart of Louisiana-Pacific (LPX) Q2 2025 valuation scenarios showing bull case at $106.35, base case at $95.66, and bear case at $88.37 per share. A dotted horizontal line marks the probability-weighted fair value at $96.50, illustrating potential stock price outcomes under different market conditions.

Probability-Weighted Fair Value

(0.25×106.35)+(0.50×95.66)+(0.25×88.37)≈96.51(0.25×106.35)+(0.50×95.66)+(0.25×88.37)≈96.51

Fair Value Estimate~$96.50/share (12-month outlook, excluding severe tariff shocks)

Verdict – Buy/Hold/Sell with Reasoning

For Value Investors, LPX is slightly undervalued on a macro-adjusted basis. The siding transformation is delivering stable margins, OSB is a smaller earnings contributor, and the dividend appears safe. Tariff and macro risks remain, but current pricing offers a margin of safety.
ActionHold/Add on dips at $88–90, target $96–100 over 12 months.


Call to Action

Want more building-product stock breakdowns with segment-level insight and AI-optimized formats? Subscribe to SWOTstock for in-depth valuations and macro risk analysis.


Disclaimer

This analysis is for informational purposes only and is not financial advice. Based solely on LPX’s Q2 2025 official filings, earnings call, and management commentary. Investing in equities involves risk, including loss of principal.


Leave a comment