TL;DR Summary
NVIDIA (NVDA:NASDAQ) delivered another explosive quarter, with Q4 revenue up 73% year-over-year and Data Center revenue surging 75%. Gross margins remain near 75%, and management guided to $78B in next-quarter revenue — even excluding China data center compute revenue.
The AI infrastructure cycle is clearly not over.
Based on official financials and management guidance, fair value lands around $240–$250, versus the current price near $150. For growth investors, the debate is no longer whether NVIDIA is dominant — it’s whether the AI cycle can extend long enough to justify sustained premium valuation.
Quarter Recap
NVIDIA reported Q4 FY2026 revenue of $68.1B, up 73% year-over-year and 20% sequentially. The real engine remains Data Center, which generated $62.3B, growing 75% YoY.
Gross margins held near 75%, confirming that pricing power remains intact despite scale. Full-year FY2026 revenue reached $215.9B, up 65% from the prior year.
Management guided Q1 FY2027 revenue to $78B ±2%, notably excluding China data center compute revenue. That implies the core AI demand machine remains strong even under export constraints.
Key Highlights
• Data Center revenue continues to scale at hyperscale velocity
• Blackwell ramp is underway, supporting next-gen demand
• Gross margin durability near 75% signals structural advantage
• China revenue excluded from guidance, reducing forward visibility but also lowering expectation risk
• $41.1B returned to shareholders in FY2026 through buybacks and dividends
SWOT Analysis
NVIDIA is no longer being valued as a chipmaker. It is being valued as the foundational AI infrastructure layer. The sustainability of that thesis depends on ecosystem dominance, demand durability, and competitive containment.
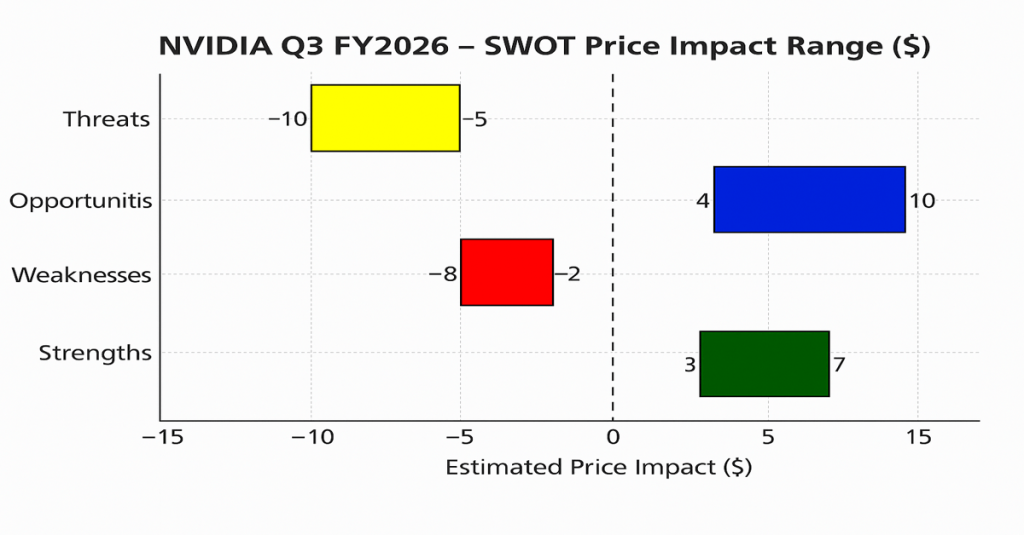
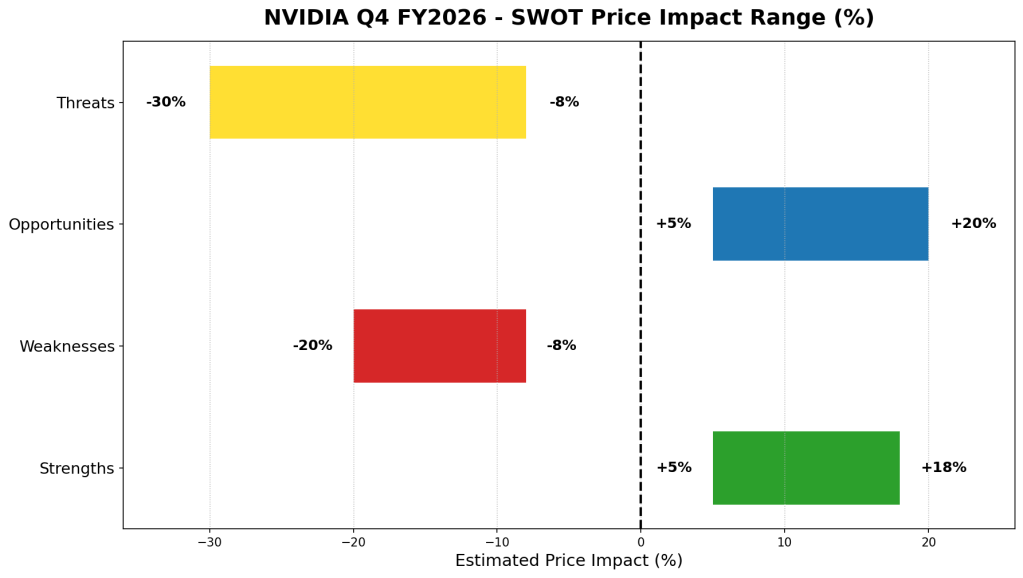
Strengths
• AI infrastructure leadership with 75% YoY Data Center growth
Estimated price impact: +10% to +18%
• CUDA + NVLink ecosystem lock-in creating high switching costs
Estimated price impact: +8% to +15%
• Sustained gross margin near 75% demonstrating pricing power
Estimated price impact: +5% to +10%
• Visible product roadmap (Blackwell, Rubin) reducing cycle uncertainty
Estimated price impact: +6% to +12%
Weaknesses
• Heavy revenue concentration in Data Center
Estimated price impact: -8% to -15%
• Premium valuation near ~45x earnings requires near-flawless execution
Estimated price impact: -10% to -20%
Opportunities
• Inference demand expansion beyond training workloads
Estimated price impact: +10% to +20%
• Sovereign AI and enterprise adoption wave
Estimated price impact: +8% to +15%
• Software monetization and services layer expansion
Estimated price impact: +5% to +12%
Threats
• China export restrictions tightening further
Estimated price impact: -8% to -18%
• Hyperscaler custom silicon (ASICs) long-term margin risk
Estimated price impact: -10% to -20%
• AI capex digestion cycle if hyperscalers pause
Estimated price impact: -15% to -30%
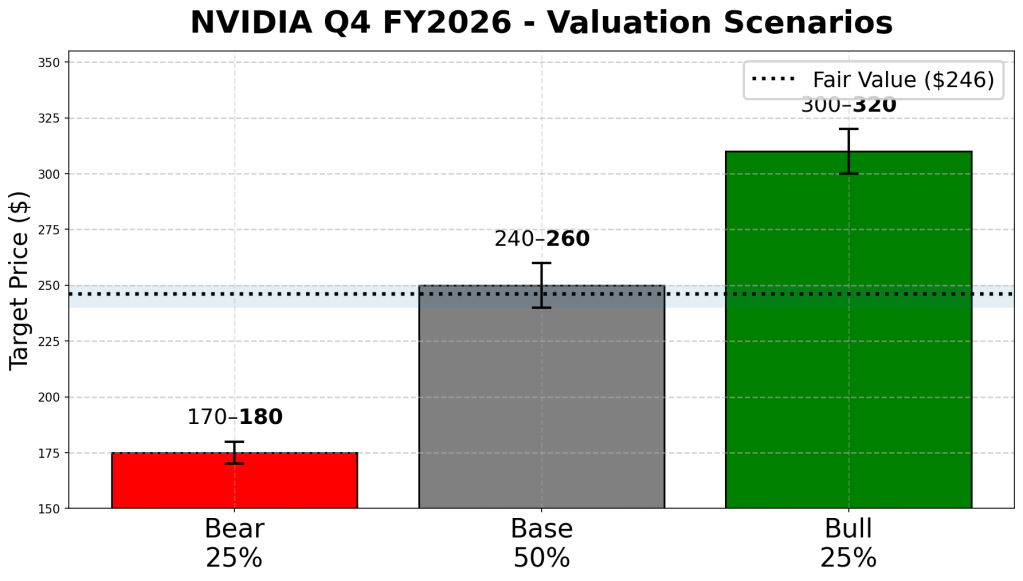
Valuation Scenarios
Bear Case — AI Growth Moderates
Assumptions:
• EPS slows to ~$6.00
• Multiple compresses to ~30x
Target price: $170–$180
Probability: 25%
Base Case — Strong but Moderating Growth
Assumptions:
• EPS ~$6.50
• Multiple stabilizes ~40x
Target price: $240–$260
Probability: 50%
Bull Case — AI Cycle Extends Multi-Year
Assumptions:
• EPS ~$7.00+
• Multiple holds 45–50x
Target price: $300–$320
Probability: 25%
Probability-Weighted Fair Value
Weighted fair value: ~$246
Fair value range based strictly on official financials:
$240–$250
Verdict
For Type 1 growth investors, NVIDIA remains the clearest AI infrastructure winner. The numbers show no structural slowdown yet. Gross margins remain elite. Guidance implies continued scale.
The real risk is not weak demand — it’s cycle compression. If AI capex pauses, the stock will re-rate quickly. But as long as hyperscaler demand persists, NVIDIA remains structurally advantaged.
This is no longer an early-stage AI bet. It is an AI cycle duration bet.
Call to Action
If you follow AI infrastructure leaders, subscribe to SWOTstock for structured earnings breakdowns, price-impact SWOT analysis, and scenario-based valuation models built for growth investors.
Disclaimer
This analysis is for informational purposes only and does not constitute investment advice. Always conduct your own due diligence and consult a licensed financial advisor before making investment decisions.