🧭 TL;DR Summary
Advanced Micro Devices (AMD:NASDAQ) posted record Q3 2025 results: revenue up 36 % y/y to $ 9.25 billion, non-GAAP EPS $ 1.20, and gross margin 54 %.
Data Center sales jumped 22 %, Client & Gaming soared 73 %, while Embedded declined 8 %.
Guidance for Q4 calls for $ 9.3 – 9.9 billion revenue—yet the stock dipped ≈ 4 % after hours as investors digested export-control headwinds and lofty expectations.
🧾 Quarter Recap
AMD’s Q3 marked a clear inflection in its AI and compute franchise.
CEO Lisa Su described the quarter as “a step-up in our growth trajectory as our rapidly scaling data-center AI business drives significant revenue and earnings growth.”
Gross margin improved two points y/y to 52 % (GAAP) and 54 % (non-GAAP), underscoring richer product mix led by EPYC CPUs and Instinct GPUs.
Operating income more than doubled to $ 1.27 billion.
Segment breakdown:
- Data Center: $ 4.34 b (+ 22 %) — 5th Gen EPYC and Instinct MI350 ramp.
- Client + Gaming: $ 4.05 b (+ 73 %) — Ryzen and console demand rebound.
- Embedded: $ 0.86 b (– 8 %) — soft industrial & networking orders.
Management guided Q4 revenue $ 9.3 – 9.9 b (midpoint $ 9.6 b), excluding China-bound MI308 GPU shipments awaiting approval.
🌟 Key Highlights
- AI acceleration: Instinct MI350 shipments ramping, with MI308 awaiting export clearance.
- Margin expansion: Gross margin 54 % shows strong mix shift to high-end compute.
- Balanced growth: Client & Gaming offset softer Embedded demand.
- Cautious guidance: China restrictions = headwind, but secular AI TAM tailwinds intact.
🧩 SWOT Analysis (with Price-Impact Ranges)
Strengths (+ 7 – 15 %)
High-margin AI and server products drive sustainable earnings growth. Data Center + Client momentum supports multiple expansion.
Weaknesses (– 6 – 12 %)
Exposure to export controls and volatile PC cycle; Embedded softness limits diversification.
Opportunities (+ 10 – 22 %)
Next-gen MI350 and Zen 5 launches could unlock share gains vs NVIDIA and Intel; AI server TAM expands through 2026.
Threats (– 8 – 18 %)
Regulatory uncertainty (China exports), intense AI competition, macro slowdown risk.

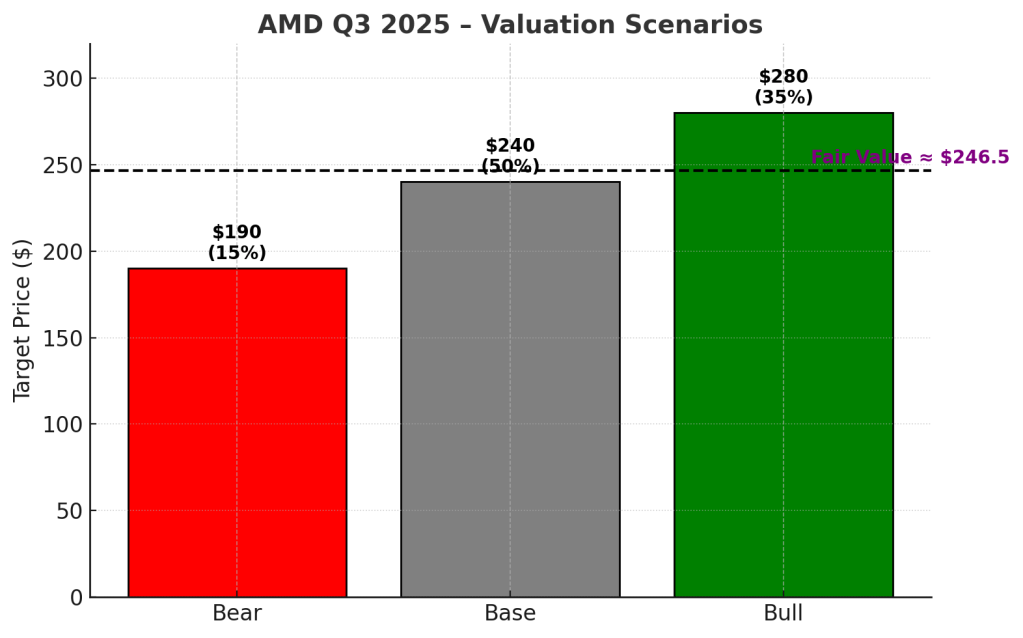
💸 Valuation Scenarios
- Bull Case (35 % probability)
- 2026 E EPS ≈ $ 6.50
- P/E multiple ≈ 40×
- Target Price: $ 260 – 300 (+ 20 %)
- Thesis: Strong AI GPU and EPYC share gains, China shipments resume, margin expansion continues.
- Base Case (50 % probability)
- 2026 E EPS ≈ $ 5.50
- P/E multiple ≈ 35×
- Target Price: $ 230 – 250 (± 0 %)
- Thesis: Balanced growth across Data Center and Client, modest Embedded recovery, stable margins.
- Bear Case (15 % probability)
- 2026 E EPS ≈ $ 4.50
- P/E multiple ≈ 30×
- Target Price: $ 180 – 200 (– 20 %)
- Thesis: AI spending slows, export restrictions persist, competition pressures gross margin.
🎯 Probability-weighted fair value: $ 242 – 255 per share — roughly aligned with current post-earnings price, indicating AMD is fairly valued with moderate upside if AI acceleration outperforms.💸 Valuation Scenarios
🧠 Verdict
AMD Q3 2025 shows AI execution is translating into profits. The stock’s valuation now reflects that success.
Short-term pullbacks from export or competitive news could offer better entries, but long-term investors still have a clear AI compounder.
Call: ⚖️ Hold / Accumulate on Weakness
Fair Value: $ 242 – 255 per share
🗣️ Call to Action
If you’re an AI-infrastructure-focused investor, keep AMD on your watchlist for pullbacks below $ 240.
The next earnings cycle will reveal whether the MI350 and Zen 5 ramps translate into market-share inflection.
⚠️ Disclaimer
This analysis is based solely on AMD’s official Q3 2025 financial report and earnings call. It is not investment advice. Please conduct your own due diligence before making investment decisions.