Berkshire Hathaway Q2 2025: Fortress Balance Sheet, Capital Inaction, and the Buffett‑to‑Abel Transition

Berkshire Hathaway’s Q2 2025 results show a cautious approach, with operating earnings of $11.16B down 4% YoY and a significant net income drop of 59% due to a Kraft Heinz writedown. Despite strong cash reserves of $344B, no buybacks occurred, raising investor concerns over capital deployment ahead of Buffett’s leadership transition to Greg Abel.

📌 TL;DR Summary:

Berkshire Hathaway reported Q2 2025 operating earnings of $11.16 B (–4% YoY) and a $3.8 B writedown on Kraft Heinz, dragging net income down 59%. Cash remains enormous at $344 B, but no buybacks were executed, leaving investors questioning capital deployment. Book value per share grew 6% YoY, but the stock trades near 1.45× book — above Buffett’s historical repurchase thresholds. For value investors, Berkshire remains a fortress‑like hold, but not an obvious bargain as the leadership transition to Greg Abel approaches.


🧾 Quarter Recap:

Berkshire Hathaway’s Q2 2025 earnings reflect disciplined caution with limited offensive moves.

  • Operating earnings: $11.16 B (–4% YoY).
  • Net income: $12.37 B (–59% YoY) due to a $3.8 B Kraft Heinz impairment.
  • Cash: $344 B, slightly down from Q1 but still near record highs.
  • Book value per share~$262, up 6% YoY and ~1% sequentially.
  • No share repurchases, for the second consecutive quarter.
  • Equity activity: Net seller of ~$3 B in stock.
  • Buffett’s discipline holds: As he wrote in the 2023 letter, “We only repurchase shares when we believe they are selling at a meaningful discount to intrinsic value.”

In Q1, we observed:

“Berkshire is signaling caution, not conviction — sitting on cash, avoiding buybacks, and waiting for real value to emerge.”

Q2 results confirm this stance — cash is stockpiled, but deployment remains elusive.


📌 Key Highlights:

  • BNSF Railway: Operating profit up ~19% to $1.47 B on freight volume growth.
  • Geico: Underwriting profit ~$1.8 B, with ~16.5% margin.
  • Insurance (reinsurance & P/C): Underwriting income declined 12%, with P&C reinsurance premiums down ~10%. Float rose to ~$174 B.
  • Consumer goods: Revenue fell ~5%, impacted by tariffs and slowing demand for brands like Fruit of the Loom.
  • FX losses: ~$877 M, pressuring underwriting results.
Line chart showing Berkshire Hathaway’s revenue and net income over the last five quarters: revenue remains relatively stable between $92B and $97B, while net income declines from about $30B in Q2 2024 to $12.37B in Q2 2025.

📈 Book Value & Valuation Context:

  • Book value per share: ~$262, up 6% YoY.
  • Price-to-book: ~1.45×, slightly below the 10‑year average of 1.5×.
  • Historical buyback threshold: Buffett previously authorized buybacks when shares traded under 1.2× book. At current levels (~1.45×), Berkshire remains above that range, which explains the lack of repurchases.

Value investor insight: Berkshire’s market price suggests it’s fully valued by Buffett’s own conservative yardstick.


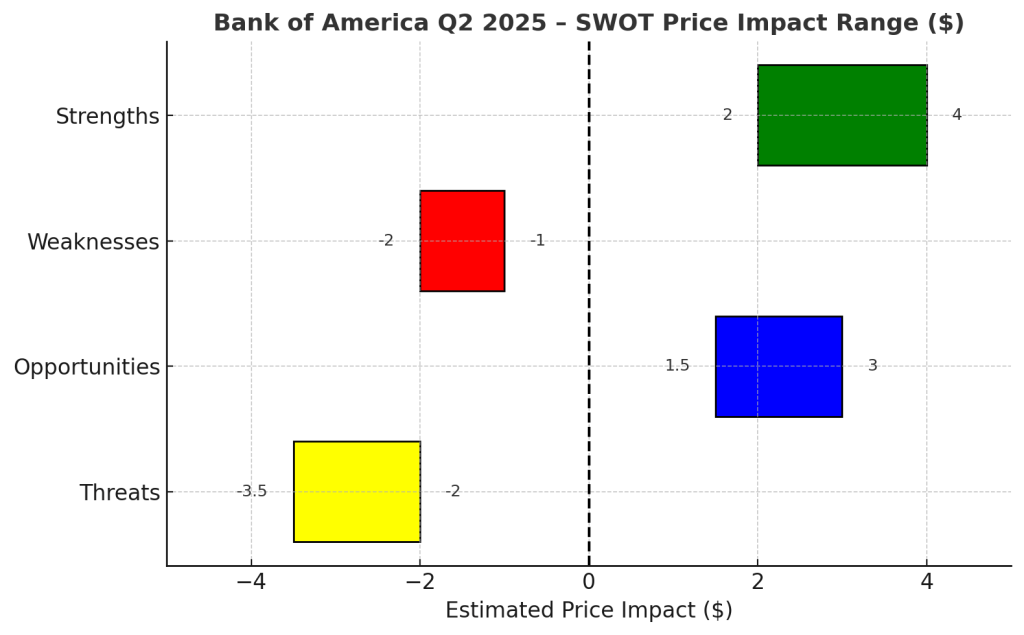
🧠 SWOT Analysis with Price Impact Estimates:

Strengths (+$15 – $25/share)

  • Fortress balance sheet: $344 B in cash and $174 B in insurance float.
  • Operational resilience: BNSF and Geico continue to deliver.
  • Diversified revenue streams: Core industrials and energy shield against sector shocks.

Weaknesses (–$10 – $20/share)

  • Kraft Heinz writedown exposes underperforming legacy investments.
  • No share buybacks, signaling management sees limited margin of safety at current levels.
  • Underwriting softness and FX headwinds pressure insurance results.

Opportunities (+$10 – $20/share)

  • Capital deployment: $344 B cash can be deployed for opportunistic M&A or buybacks if valuations fall.
  • Rail consolidation: BNSF may benefit from strategic M&A moves in the sector.
  • Insurance cycle hardening: Potential for improved pricing in future quarters.

Threats (–$10 – $15/share)

  • Leadership transition: Buffett‑to‑Abel handoff raises uncertainty about future capital allocation.
  • Macro risks: Tariffs and FX volatility weigh on consumer and manufacturing units.
  • Equity portfolio volatility: GAAP fair‑value swings distort net income.

📊 SWOT Summary Table

SWOT summary table for Berkshire Hathaway Q2 2025 showing strengths, weaknesses, opportunities, and threats with estimated price impacts
Horizontal bar chart showing Berkshire Hathaway Q2 2025 SWOT price impact: Threats at approximately –12.5, Opportunities at +15, Weaknesses at –15, and Strengths at +20, with a vertical dashed line at zero.

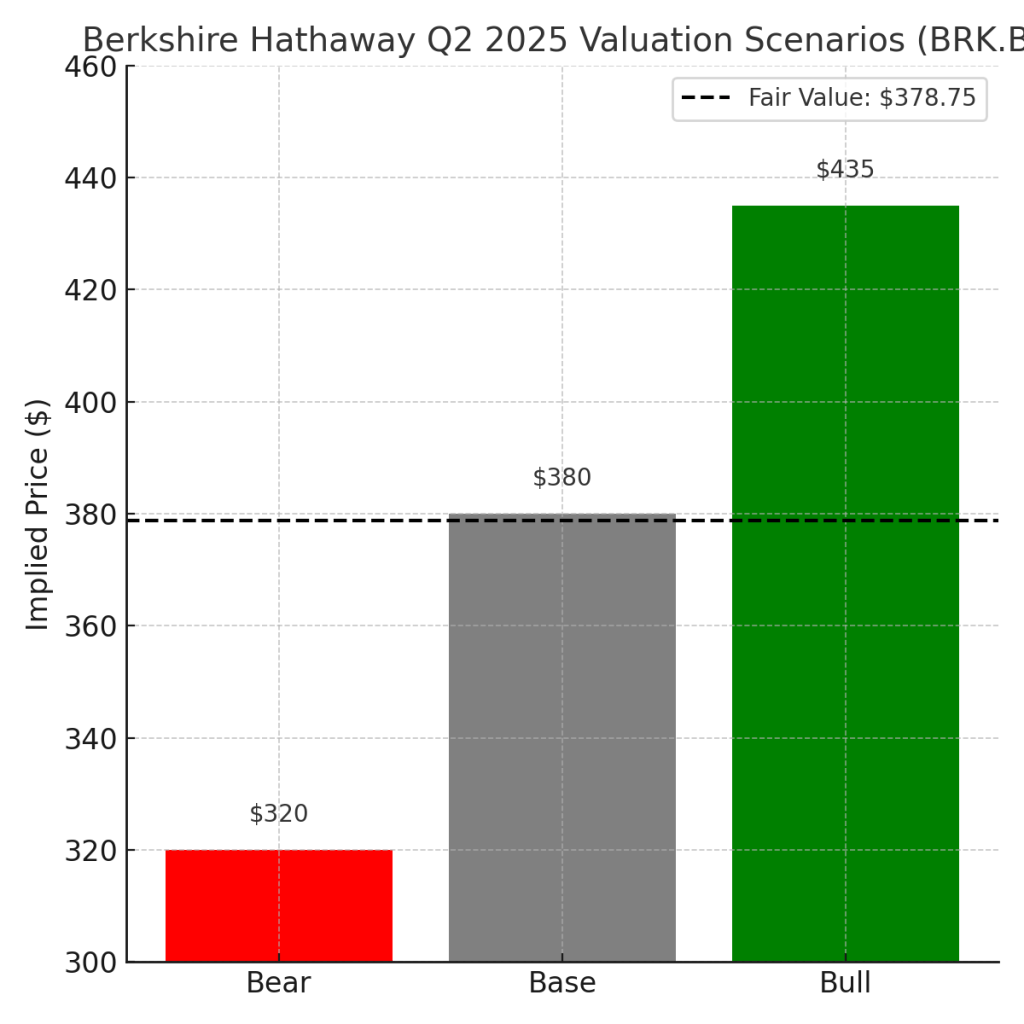
💸 Valuation Scenarios:

We apply sum‑of‑parts (subsidiary cash flows + equity portfolio) and P/B benchmarking:

Valuation scenarios table for Berkshire Hathaway Q2 2025 showing bull, base, and bear cases with assumptions and implied BRK.B share prices

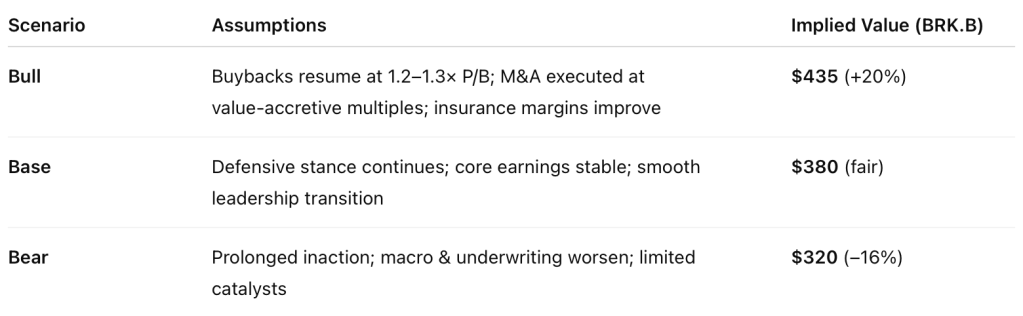
Probability‑Weighted Fair Value = (0.25 × 435) + (0.5 × 380) + (0.25 × 320) = $378.75/share.

Vertical bar chart showing Berkshire Hathaway Q2 2025 valuation scenarios: Bear case at $320, Base case at $380, and Bull case at $435, with a horizontal dashed line indicating the probability-weighted fair value of approximately $378.75.

📊 Peer Comparison Insight:


Berkshire Hathaway’s P/B ratio of 1.45 positions it above Markel (1.2) but far below the S&P 500 average of 4.2, reinforcing its standing as a value‑oriented conglomerate rather than a growth‑priced index constituent. Its ROE of 10% trails the S&P 500’s 14%, reflecting Berkshire’s conservative leverage and capital deployment posture, yet it still outpaces Markel’s 8%. The YTD return of 4% lags the S&P 500’s 6%, highlighting market skepticism about near‑term catalysts amid Buffett’s upcoming transition and limited capital actions. For DIY value investors, this underscores Berkshire’s role as a steady compounding hold rather than a momentum‑driven outperformer.

Horizontal bar chart comparing Berkshire Hathaway, Markel, and the S&P 500 in Q2 2025: Berkshire shows a P/B ratio of 1.45, ROE of 10%, and YTD return of 4%; Markel shows a P/B ratio of 1.2, ROE of 8%, and YTD return of 6%; S&P 500 shows a P/B ratio of 4.2, ROE of 14%, and YTD return of 6%.

🔑 Catalysts for Re‑rating and Market Reaction

Berkshire’s stock continues to trade like the fortress it is — steady but unspectacular — with a year‑to‑date gain of about 4%, trailing the S&P 500’s roughly 6% advance. The muted market response to Q2 earnings suggests that investors see the quarter as “business as usual”: strong balance sheet, reliable operating results, but little in the way of near‑term excitement. For the stock to re‑rate higher, investors are watching for clearer capital deployment signals — whether that’s buybacks at higher price‑to‑book levels, opportunistic large‑scale acquisitions, or a more aggressive investment approach under Greg Abel’s leadership once the Buffett transition is complete. A significant market downturn, which would give Berkshire the chance to deploy its $344 B cash pile into undervalued opportunities, also remains a potential catalyst for a re‑rating. Until then, the shares are likely to trade within a range that reflects their defensive compounding profile rather than breakout growth.


🧠 Verdict:

For value investors, Berkshire remains a defensive cornerstone: diversified, cash‑rich, and well‑positioned for opportunistic moves. But at ~1.45× book, shares are not trading at a margin of safety by Buffett’s standards. Until buybacks resume, M&A materializes, or valuations reset lower, this is a hold for long‑term compounding — not a bargain entry point.


📣 Call to Action:

Stay ahead of Berkshire’s next moves — from buybacks to the post‑Buffett era.
Subscribe to SWOTstock for deep‑dive analyses that cut through the headlines.


⚠️ Disclaimer:

This analysis is based solely on Berkshire Hathaway’s Q2 2025 public filings (Form 10‑Q, earnings release). It does not constitute financial advice. Perform your own due diligence or consult a licensed advisor before making investment decisions.


Leave a comment


Bank of America Q2 2025: Earnings Beat, Dividend Growth Ahead, and a Fair Value Play for Income Investors

TL;DR

Bank of America posted Q2 2025 EPS of $0.89, topping expectations, driven by record net interest income and robust trading revenue. Management reaffirmed NII guidance toward $15.5–$15.7 billion and announced an 8% dividend hike (raising forward yield to ~3.2%). While credit risks in commercial real estate and macro uncertainties persist, BAC remains fairly valued near $48, making it a steady, income‑oriented choice for DIY value investors.


Quarter Recap

In Q2 2025, Bank of America reported revenue of $26.6 billion (+4% YoY) with net interest income (NII) reaching $14.8 billion — a record high. Net income rose to $7.1 billion (EPS $0.89), beating estimates by 3 cents.

Management highlighted:

  • Efficiency progress: Non‑interest expenses dropped ~$600 million QoQ, with a target to reach ~60% efficiency ratio.
  • Deposit strength: 8th straight quarter of deposit growth, with average checking balances rising from $6K to $9.2K YoY.
  • Credit costs: Provisions increased to ~$1.6 billion, mainly from office‑related CRE loans.
  • Trading resilience: Markets revenue rose ~15% YoY, with management expecting a 13‑quarter growth streak to continue.
  • Shareholder returns: $7.3 billion in Q2 (dividends + buybacks) and an 8% dividend increase announced for Q3.

Key Highlights

  • EPS: $0.89 (+7% YoY), beat by 3 cents
  • Revenue: $26.6 billion (+4% YoY)
  • Net Interest Income: $14.8 billion (record)
  • Efficiency: Expenses down $600 million QoQ; targeting ~60% ratio
  • Dividend: 8% hike brings forward yield to ~3.2%
  • Asset quality: Net charge‑offs of $1.5 billion; provisions up to $1.6 billion
  • Deposits: 8th consecutive quarter of growth
Line chart showing Bank of America revenue and net income over the past five quarters, highlighting Q2 2025 growth in both metrics.

SWOT Analysis

  • Strengths (+$2 – 4 impact):
    Record NII, diversified revenue streams, improving efficiency, and a dividend hike reflecting capital confidence.
  • Weaknesses (−$1 – 2 impact):
    Slower revenue growth than peers, elevated CRE‑related losses, and a still‑high expense base.
  • Opportunities (+$1.5 – 3 impact):
    AI & digital investments, sustained deposit momentum, expanding trading revenue, and higher dividend yield enhancing total return.
  • Threats (−$2 – 3.5 impact):
    Tariff‑driven macro risks, potential Fed rate cuts compressing NII, and rising credit costs in commercial real estate.

Net price impact: ≈ +$1.0–1.5/share vs. pre‑earnings levels, supporting the current range.


SWOT Summary Table

Bank of America Q2 2025 SWOT price impact analysis table showing strengths, weaknesses, opportunities, and threats with estimated stock price impacts.
Bar chart showing Bank of America Q2 2025 SWOT price impact ranges: strengths (+2 to +4), weaknesses (−1 to −2), opportunities (+1.5 to +3), and threats (−2 to −3.5), with X-axis starting at −5.

Valuation Scenarios

To frame a realistic outlook for Bank of America’s stock, we modeled three scenarios based on management’s guidance, Q2 results, and macro risks. The Base Case assumes steady EPS growth, stable net interest income, and controlled expenses, keeping the stock near its current range. The Bull Case reflects a scenario where trading revenue momentum accelerates, the efficiency ratio improves faster toward the 60% target, and net interest income benefits from a slower‑than‑expected pace of Fed rate cuts. Conversely, the Bear Case factors in higher commercial real estate charge‑offs and a compressed margin environment from rapid rate cuts. These scenarios give a clear range of plausible outcomes for value investors, balancing potential upside with key risks.

Bank of America Q2 2025 valuation scenarios table showing bull case at $52, base case at $48, and bear case at $42 with probability-weighted fair value of $48.

Probability‑Weighted Fair Value:(0.5 × 48) + (0.3 × 52) + (0.2 × 42) ≈ $48

Bar chart showing Bank of America Q2 2025 valuation scenarios: Bear case at $42, Base case at $48, and Bull case at $52, with a dotted line for the $48 fair value.

Dividend Growth Snapshot

Bank of America’s 8% dividend hike for Q3 2025 raises the quarterly payout from $0.24 to $0.26 per share, pushing the forward yield to roughly 3.2% at current prices. This increase continues the bank’s consistent multi‑year trend of dividend growth, reflecting management’s confidence in earnings stability and capital strength. Combined with $7.3 billion in share buybacks during Q2, this makes BAC a compelling choice for income‑focused investors who prioritize reliable cash returns and long‑term capital appreciation.

  • Q2 dividend: $0.24/share → Q3: $0.26/share
  • 8% increase = forward yield of ~3.2% at $48/share

Peer Comparison

When compared to its large‑cap U.S. banking peers, Bank of America sits in the middle of the pack. At a price‑to‑book ratio of ~1.3× and forward P/E around 13×, it trades cheaper than JPMorgan (P/B ~1.6×, P/E ~12×) but at a premium to Citigroup (P/B ~0.8×, P/E ~9×). Dividend yield at ~3.2% (post‑hike) makes BAC more attractive than JPMorgan (~2.8%) but still below Citi’s ~4%. This positioning reflects its balanced profile: steadier than Citi, but with less growth momentum than JPMorgan — a mix that appeals to value‑oriented investors seeking income without extreme risk exposure.

Peer comparison table for Bank of America Q2 2025 versus JPMorgan and Citigroup, showing price-to-book, price-to-earnings, and dividend yield metrics.

Verdict

At ≈$48/share, BAC trades close to our fair value estimate. For DIY value investors, it offers steady dividendsaggressive buybacks, and a resilient balance sheet. While upside is modest without macro support, the dividend hikeand sustained trading & deposit growth make it a hold‑to‑accumulate for long‑term portfolios.


Call to Action

Do you hold Bank of America or other bank stocks? Comment below — is BAC your top pick for steady income, or do you prefer peers like Citi or JPMorgan?


Disclaimer

This analysis is for informational purposes only and based solely on Bank of America’s official Q2 2025 financial report and earnings call. It does not constitute financial advice. Please consult a licensed advisor before making investment decisions.

💼 Wells Fargo Q2 2025: A Clearer Runway—But Is the Price Still Right?

Wells Fargo Q2 2025 earnings beat expectations, but NII guidance disappointed. Is the stock undervalued or overhyped? SWOT analysis for value investors.

TL;DR – Strong Quarter, Valuation Getting Ahead?

Wells Fargo delivered solid earnings and regulatory clarity in Q2 2025, including the long-awaited removal of its Fed-imposed asset cap. But flat guidance for Net Interest Income (NII) spooked the market. While shares are rebounding, value investors may want to wait for a more attractive margin of safety closer to $76 before entering.


📊 Quarter Recap: Asset Cap Lifted, But NII Dampens Mood

Wells Fargo posted $5.49B in net income (+12% YoY) and $1.60 EPS, beating expectations. Revenue reached $20.82B, with non-interest income showing strength in advisory and trading fees.

However, Net Interest Income (NII) declined 2% YoY, and full-year guidance was trimmed from growth to flat. That change triggered a 5.6% selloff, before shares rebounded.

CEO Charlie Scharf called the quarter a turning point:

“The lifting of the asset cap by the Federal Reserve marked a pivotal milestone in our transformation.”

Wells is now repositioning for growth—especially in fee-based businesses.


🔍 Key Highlights from Q2

  • Net Income rose to $5.49B, with EPS at $1.60 (GAAP)
  • NII dropped 2% YoY; FY guidance trimmed to flat growth
  • Non-interest income strengthened, especially investment banking (+9%)
  • Efficiency focus continues with tight expense control
  • Asset cap lifted, removing key regulatory hurdle
  • Capital return likely to increase—dividend hikes expected post stress test
Line chart showing Wells Fargo’s revenue and net income over the past five quarters from Q2 2024 to Q2 2025.

🏦 Peer Context: Wells vs JPMorgan & Citi

  • Wells Fargo: Guided for flat NII in FY2025
  • Citigroup: Reiterated low single-digit growth
  • JPMorgan: Holding NII flat, with cost controls as offset

Wells appears slightly more conservative than peers, raising questions about credit demand and pricing pressure.


💵 Capital Return Outlook: What’s Coming?

Wells Fargo currently yields 1.73%, but management has hinted at capital returns improving post-stress test.

  • 10–12% dividend hike is feasible, which would push the yield toward 1.9–2.0%.
  • Share repurchases are also likely to resume more meaningfully in H2 2025.

This return to “normal” capital policy is a key pillar for value-focused investors.


🧭 SWOT Analysis

Wells Fargo’s Q2 2025 performance marks a strategic inflection point—regulatory shackles are gone, fee-based income is recovering, and capital returns are back on the table. But macro uncertainty and cautious NII guidance leave questions about short-term upside. The SWOT analysis below breaks down the bank’s positioning, including estimated price impact for each factor to help value investors frame risk and reward.

SWOT analysis table for Wells Fargo Q2 2025 showing strengths, weaknesses, opportunities, and threats with estimated stock price impact ranges.
Updated SWOT price impact bar chart for Wells Fargo Q2 2025 with symmetric spacing and x-axis starting at –8, illustrating the estimated stock price effect of each SWOT factor.

📈 Valuation Scenarios

After evaluating Wells Fargo’s Q2 2025 results, it’s clear that the market has reacted positively to the lifting of the asset cap and stronger capital positioning. However, to determine whether the current share price reflects true value, we turn to the fundamentals. By applying a blended model—based on earnings, book value, and dividend yield—we arrive at a fair value that gives value investors a grounded view of what the stock is really worth.

Valuation scenarios table for Wells Fargo Q2 2025, including bull, base, and bear case target prices with probability weights and risk-adjusted fair value estimate.

🎯 Probability-Weighted Price Target: $82.30

Vertical bar chart showing Wells Fargo’s Q2 2025 valuation scenarios with target prices for Bear, Base, Bull cases and current stock price, including a dotted line marking the fair value estimate at $82.30.

🧮 Fair Value Estimate: Clarity Through the Numbers

We calculate fair value using three methods based on official Q2 2025 data:

Fair value breakdown table for Wells Fargo Q2 2025 using earnings-based, book value, and dividend yield models, showing individual estimates and the blended fair value of $75.94.

🔎 Verdict: Watchlist Candidate, Not Yet a Buy

With the stock currently at $80.64 and our fair value at $75.94, Wells Fargo is trading 5.8% above our estimate.
While long-term upside exists, value investors may want to wait for a pullback toward $74–76 to lock in a proper margin of safety. The market has largely priced in the asset cap news—but not yet the risk of stagnating interest income.


📣 Call to Action

Want to see how Wells Fargo stacks up against JPMorgan and Citi? Check out our recent bank earnings breakdowns and subscribe for alerts on Goldman Sachs, Bank of America, and Morgan Stanley in the days ahead.


🛑 Disclaimer

This blog is for educational and informational purposes only and is not investment advice. All analysis is based solely on official company filings and earnings calls.


Leave a comment